The speed-time graph for a car is shown is Figure
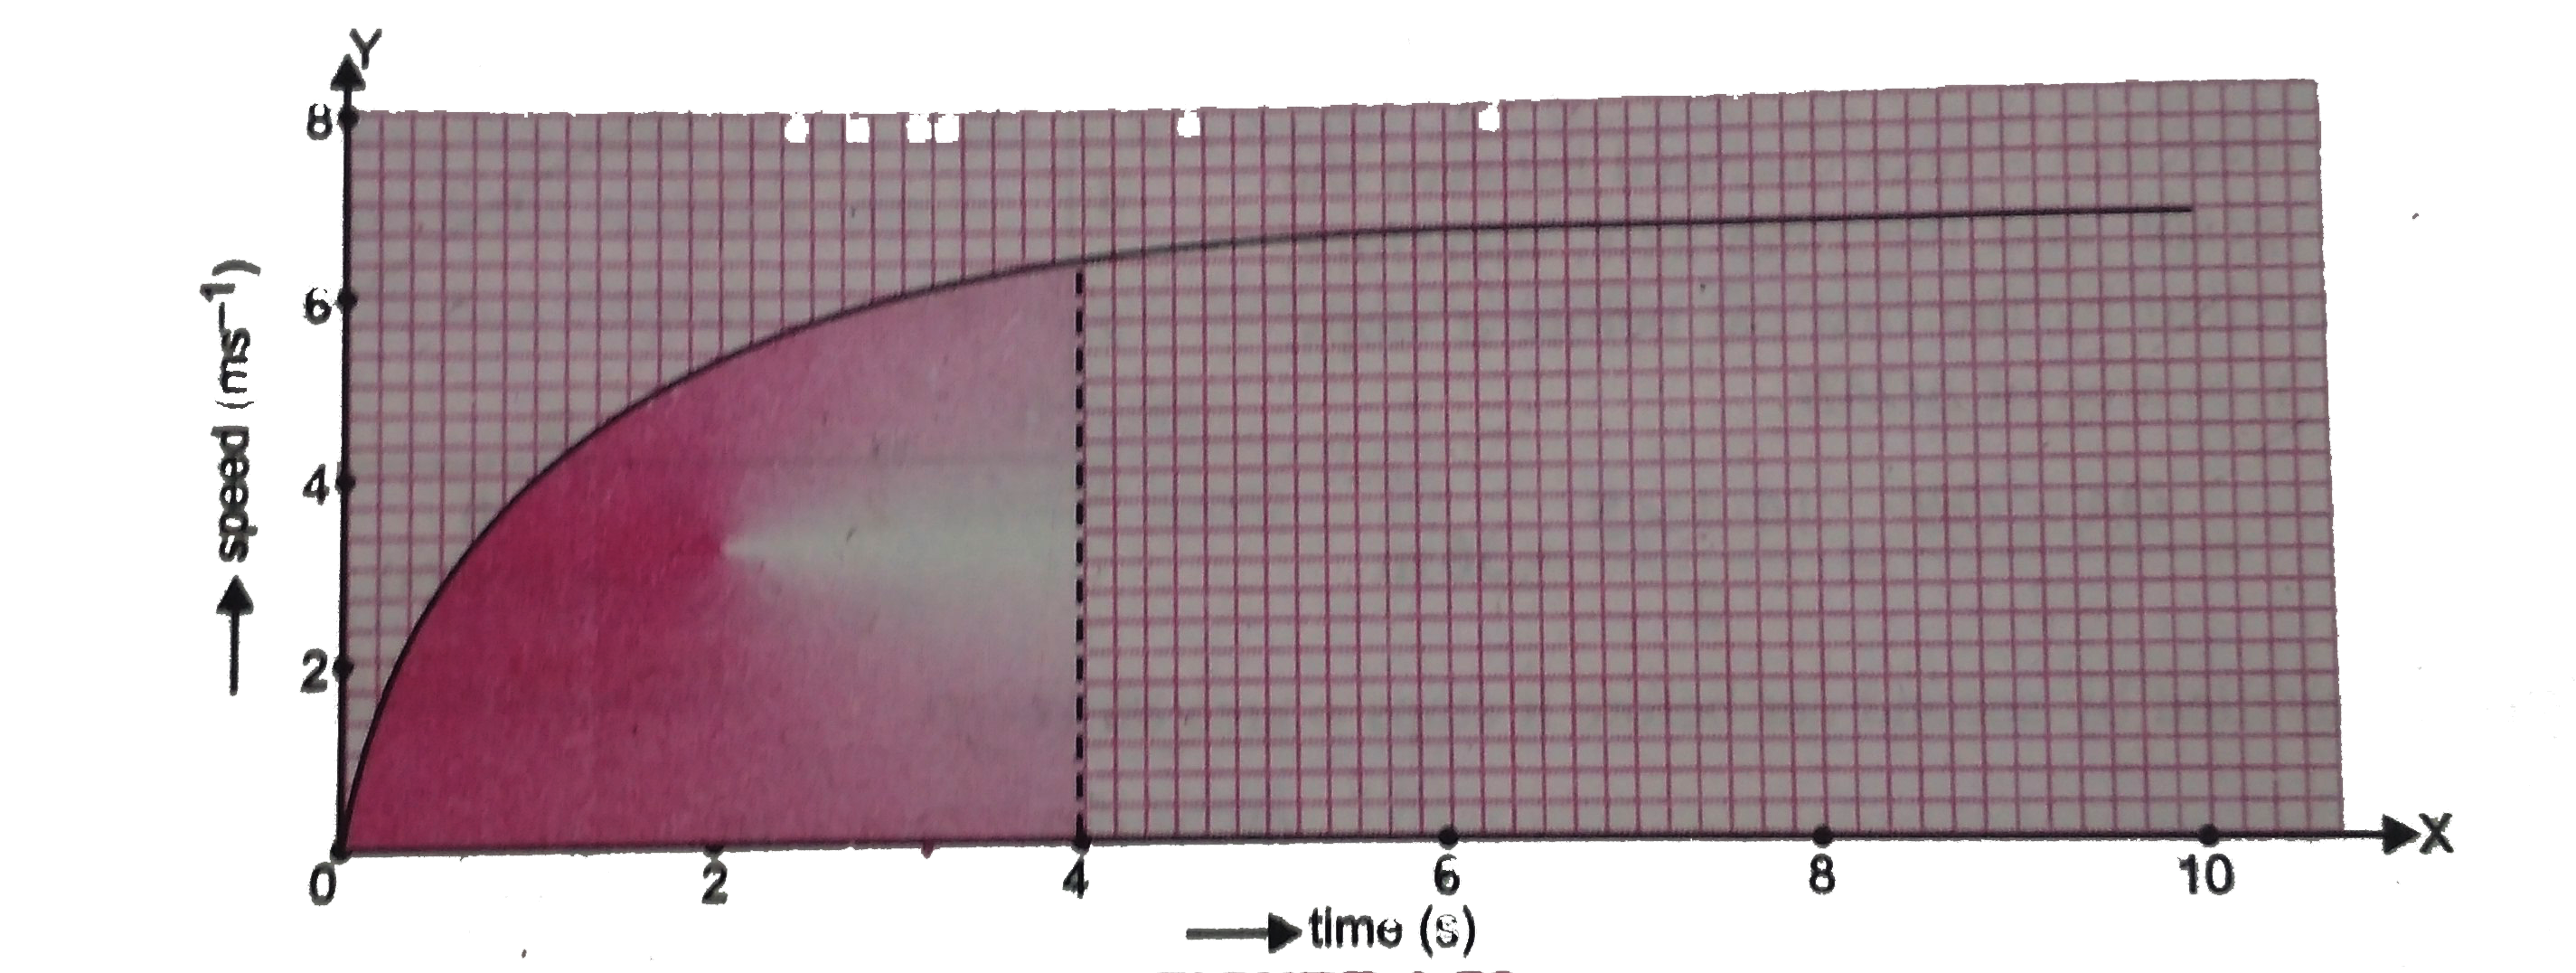
(a) Find how far does the car travel in the first 4 seconds. Shade the area on the graph that represents the distance travelled by the car during this period.
(b) Which part of the graph represents uniform motion of the car ?
(a) 
The shaded area which is equal to 1/2×4×6=12 m represents the distance travelled by the car in the first 4s.
(b) 
The part of the graph in red colour between time 6 s to 10 s represents uniform motion of the car.
Topper's Solved these Questions
Similar Questions
Knowledge Check
Which of the following x-t graphs does not represent periodic motion?
A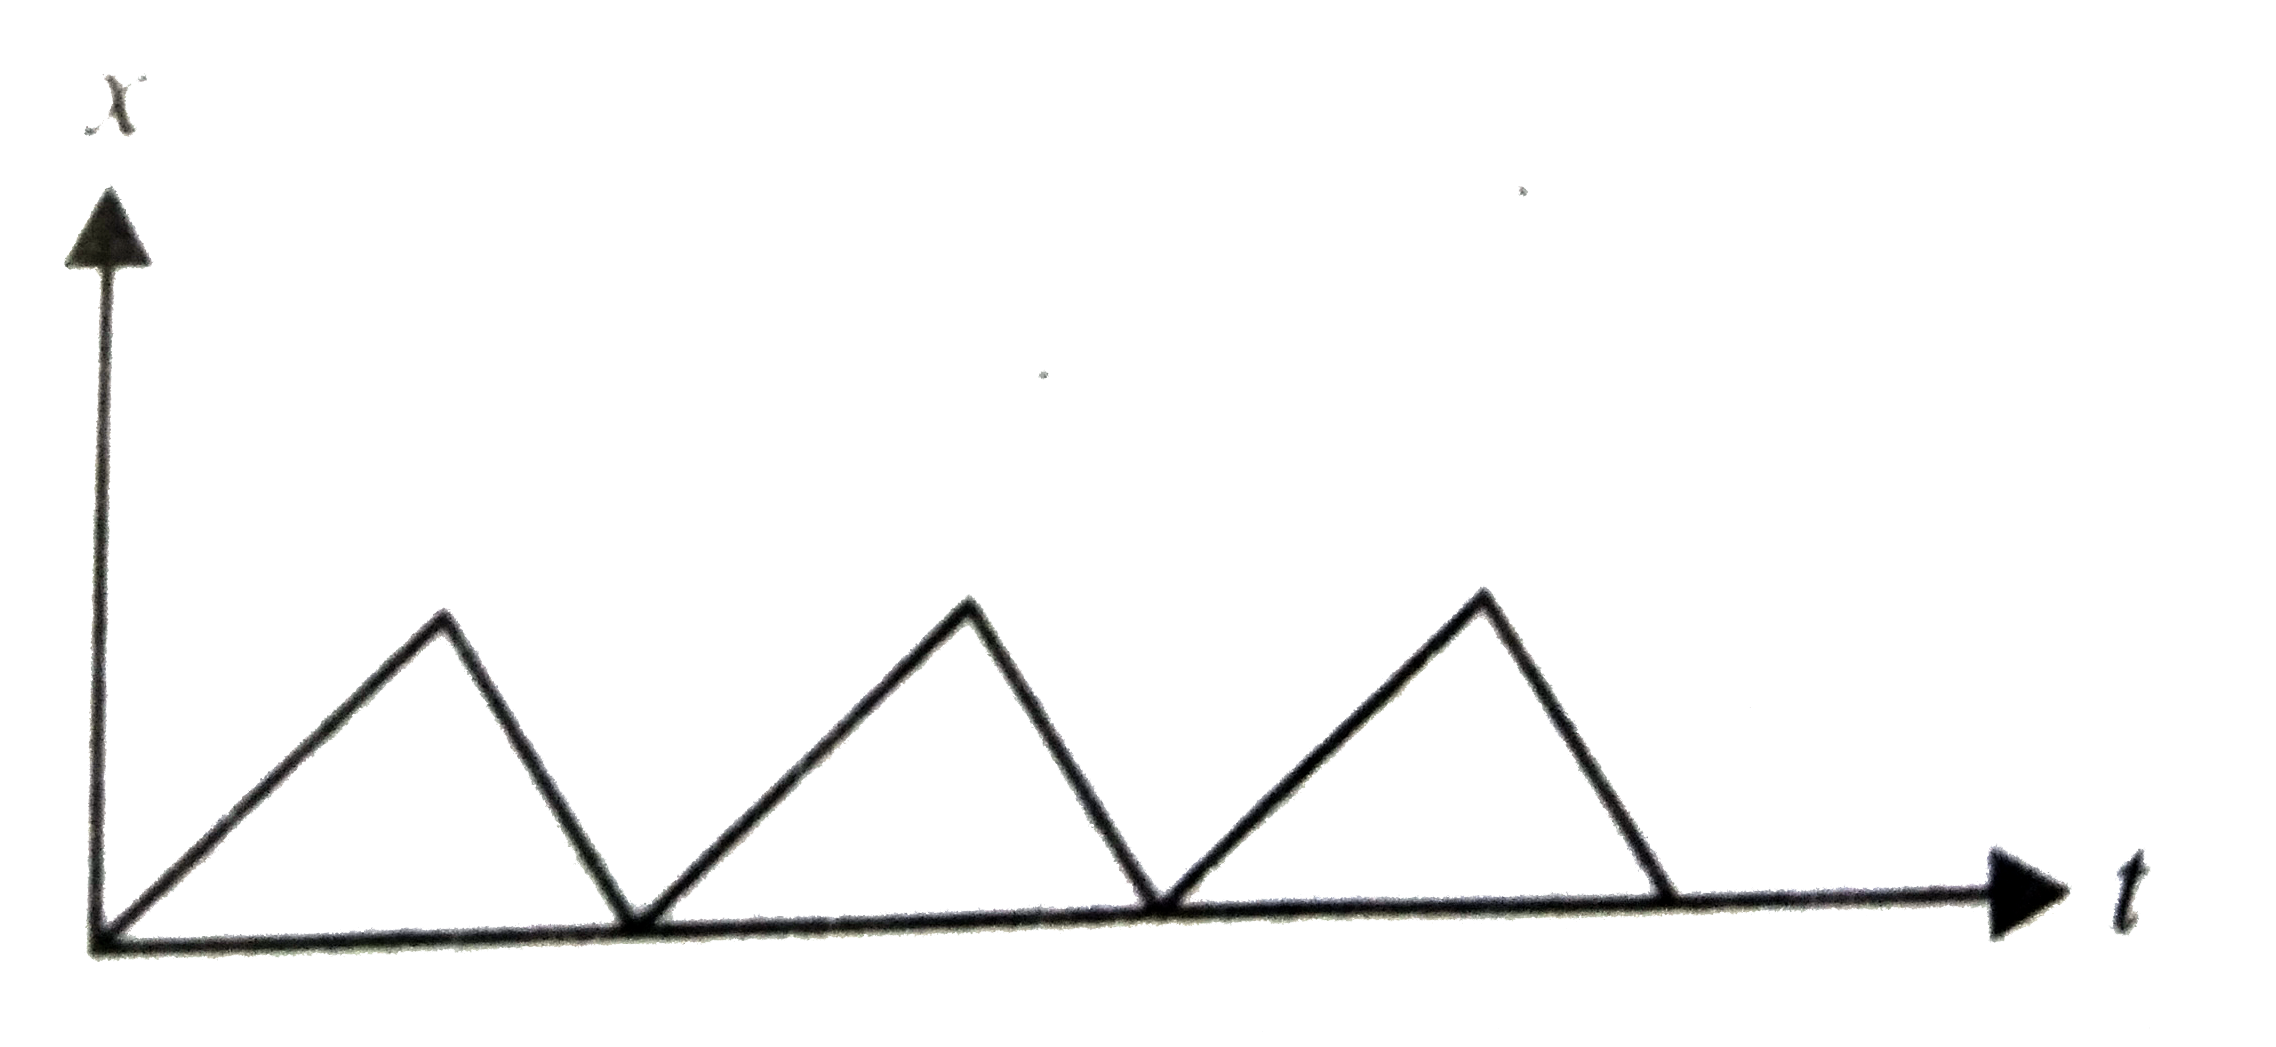 B
B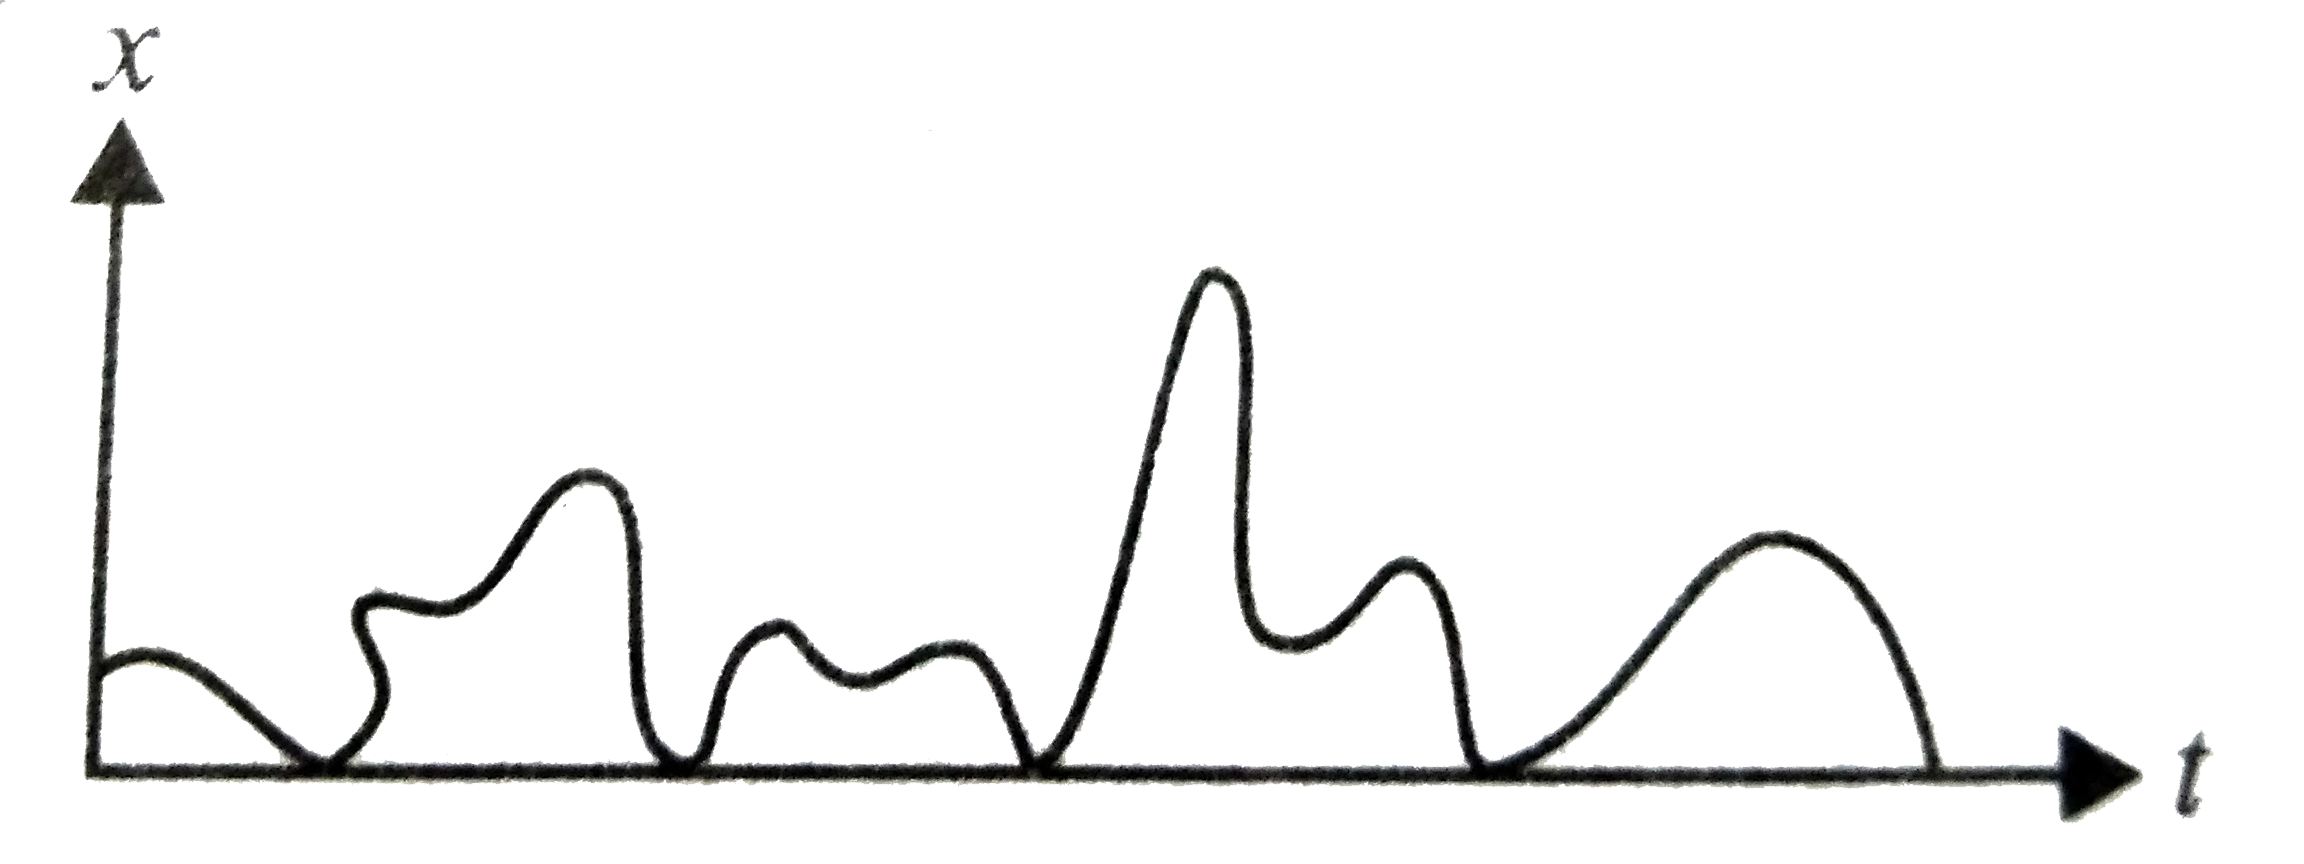 C
C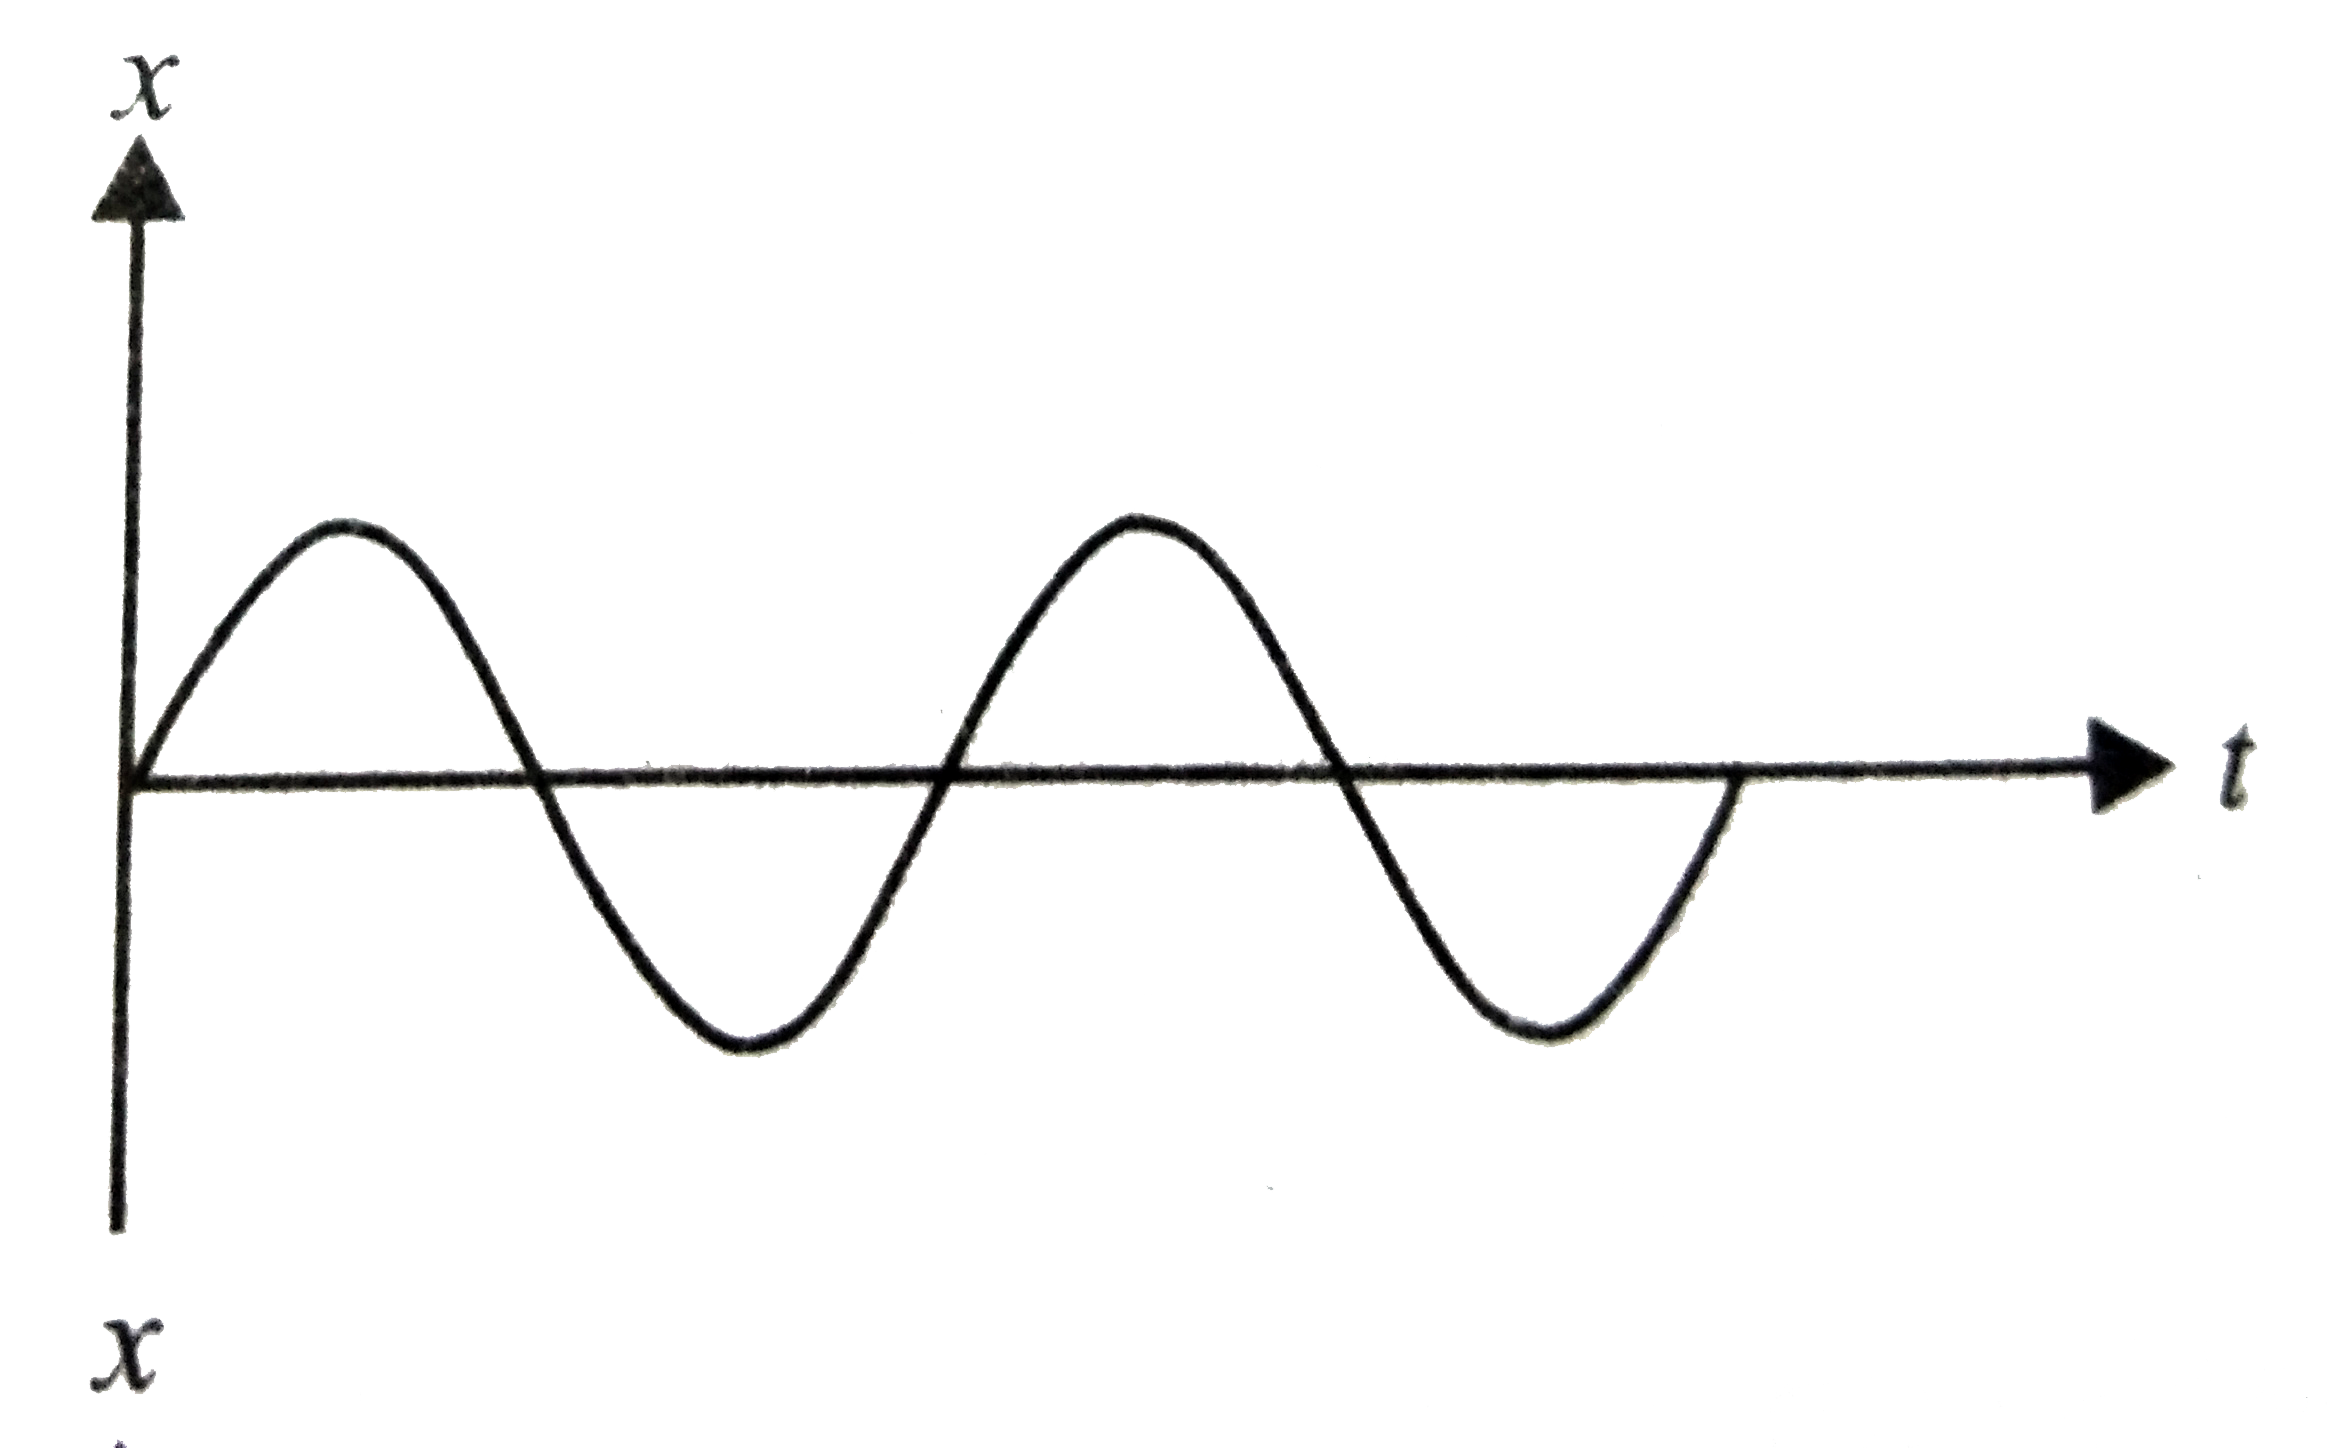 D
D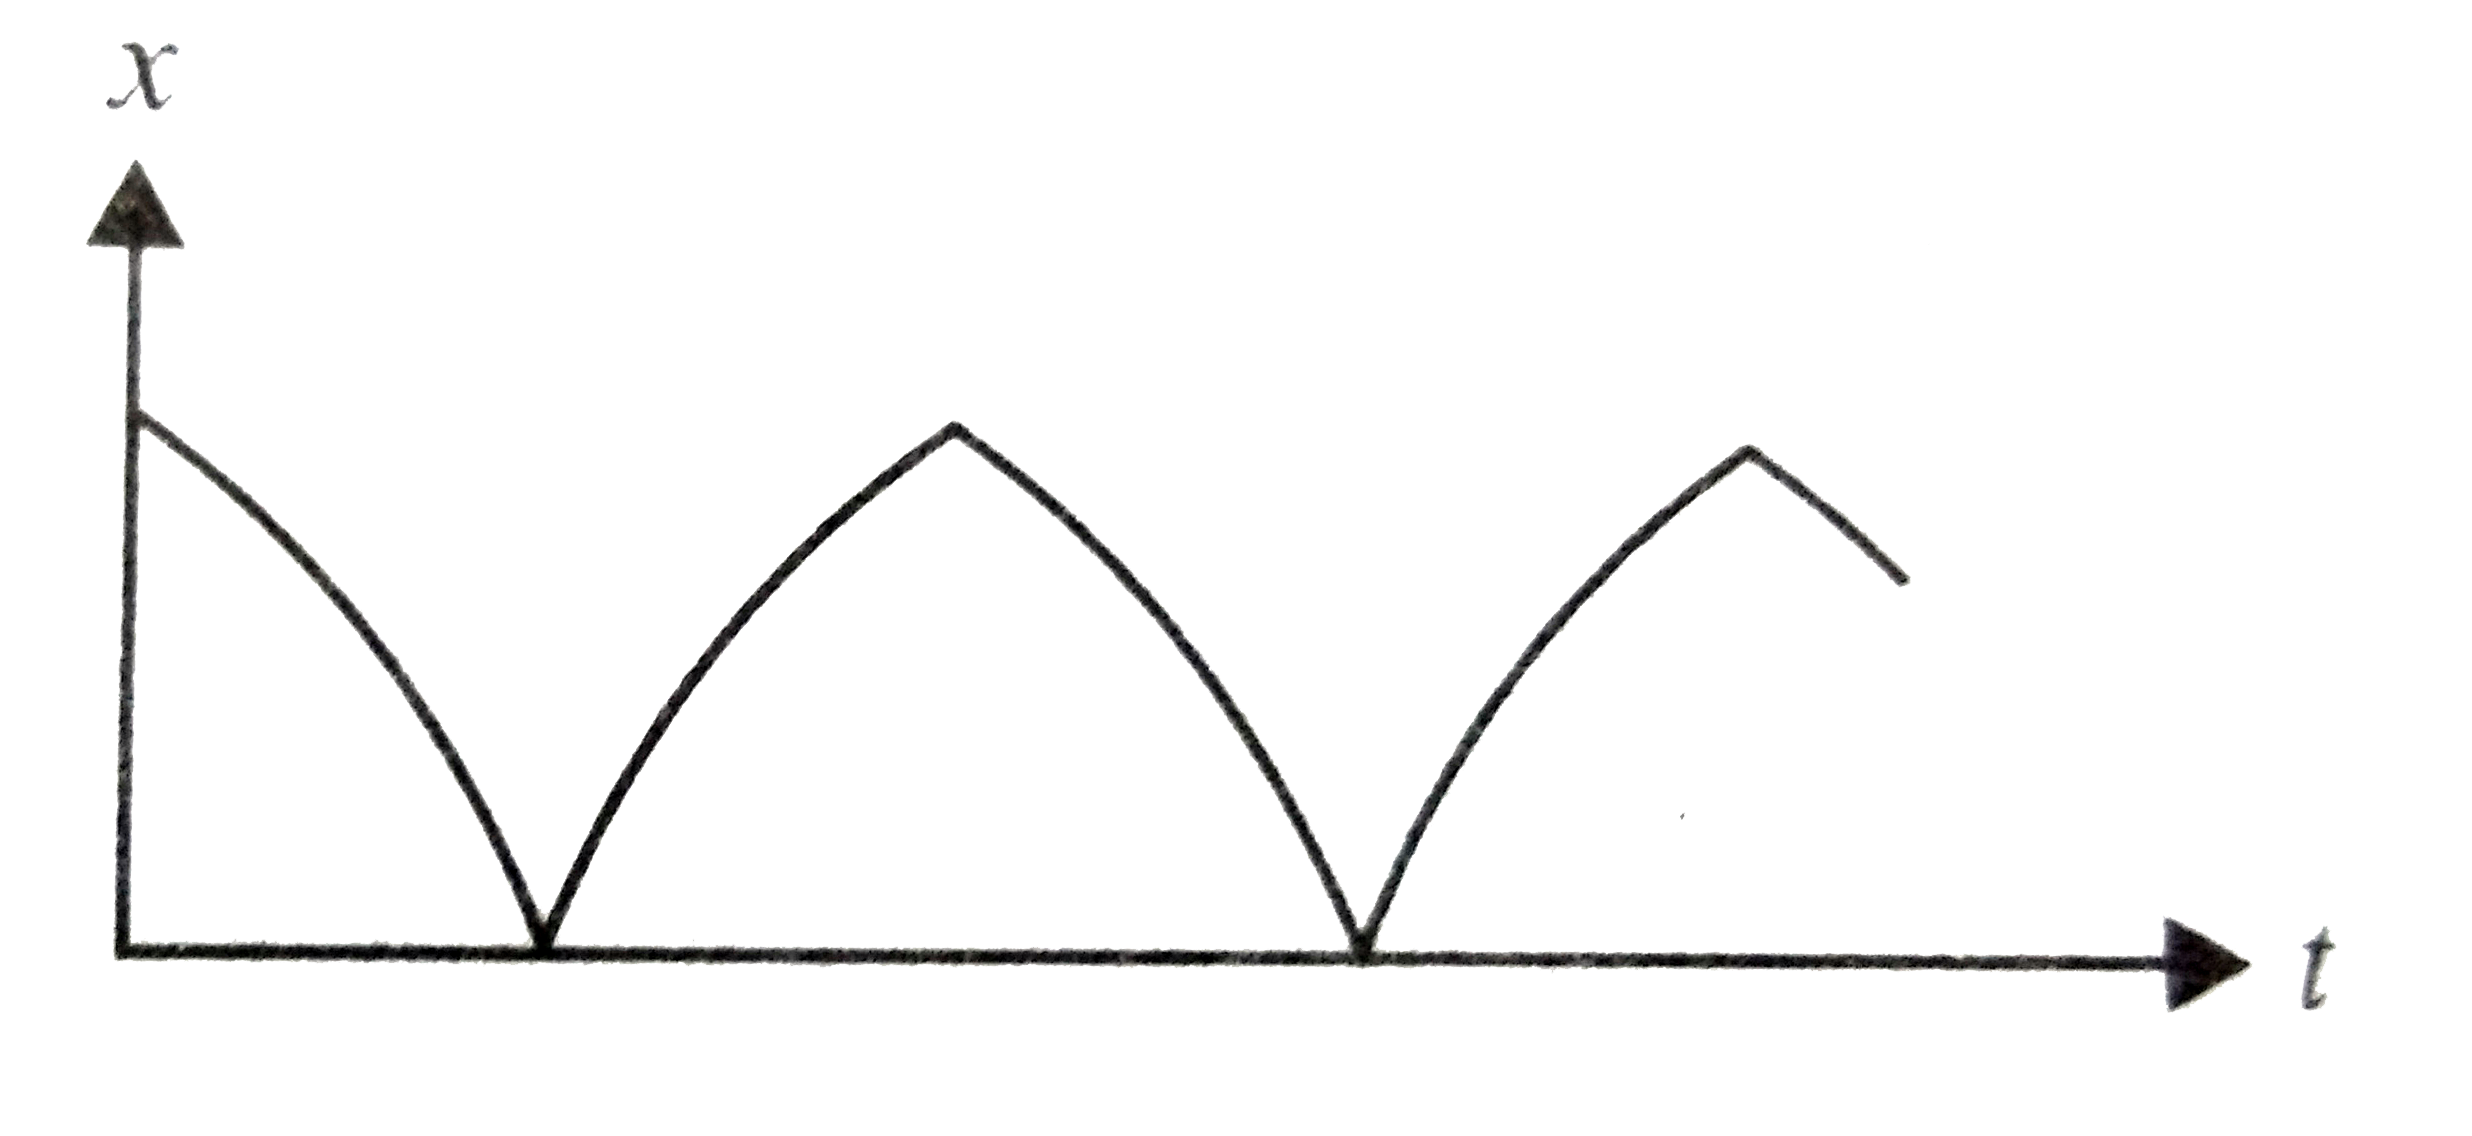
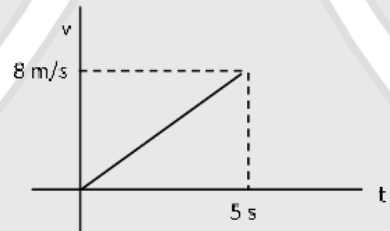
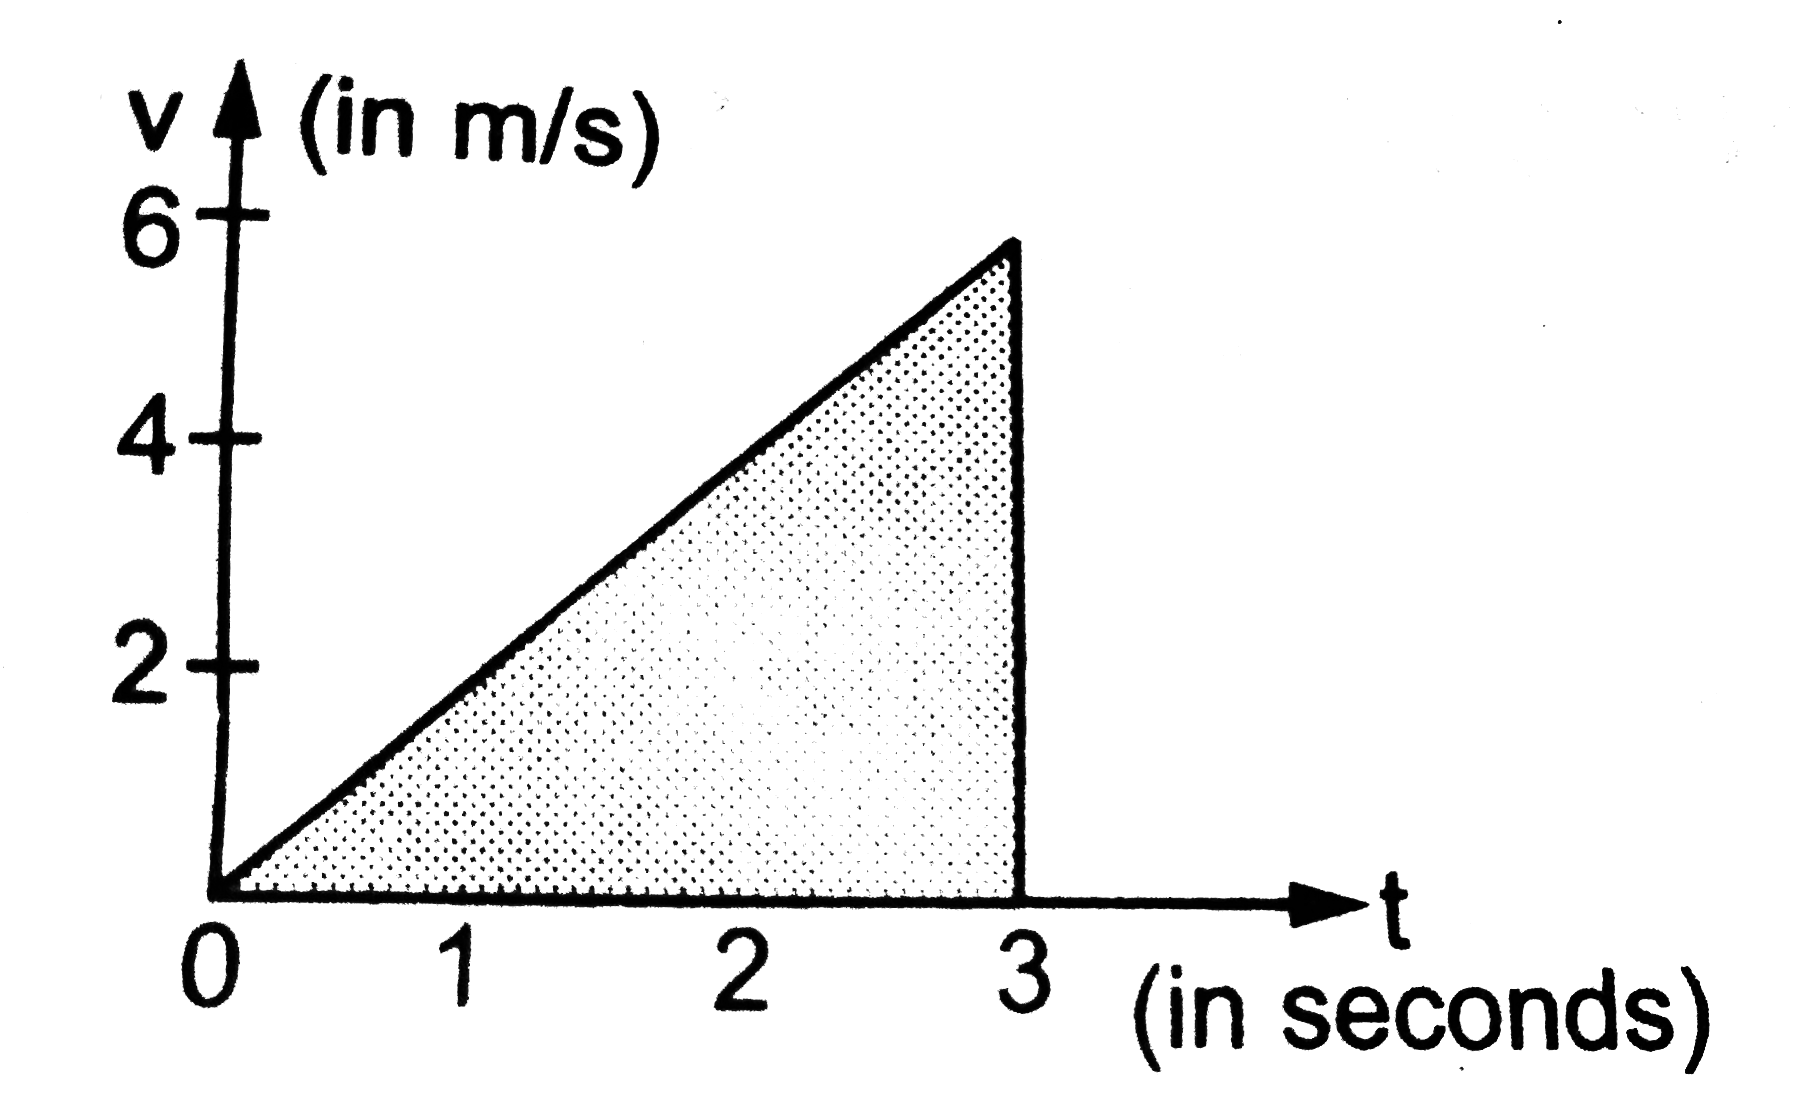
Figure shows the speed versus time graph for a particle. Find the distance travelled by the particle during the time t=0 to t=3s.
View SolutionThe speed of a car as a function of time is shown in figure.
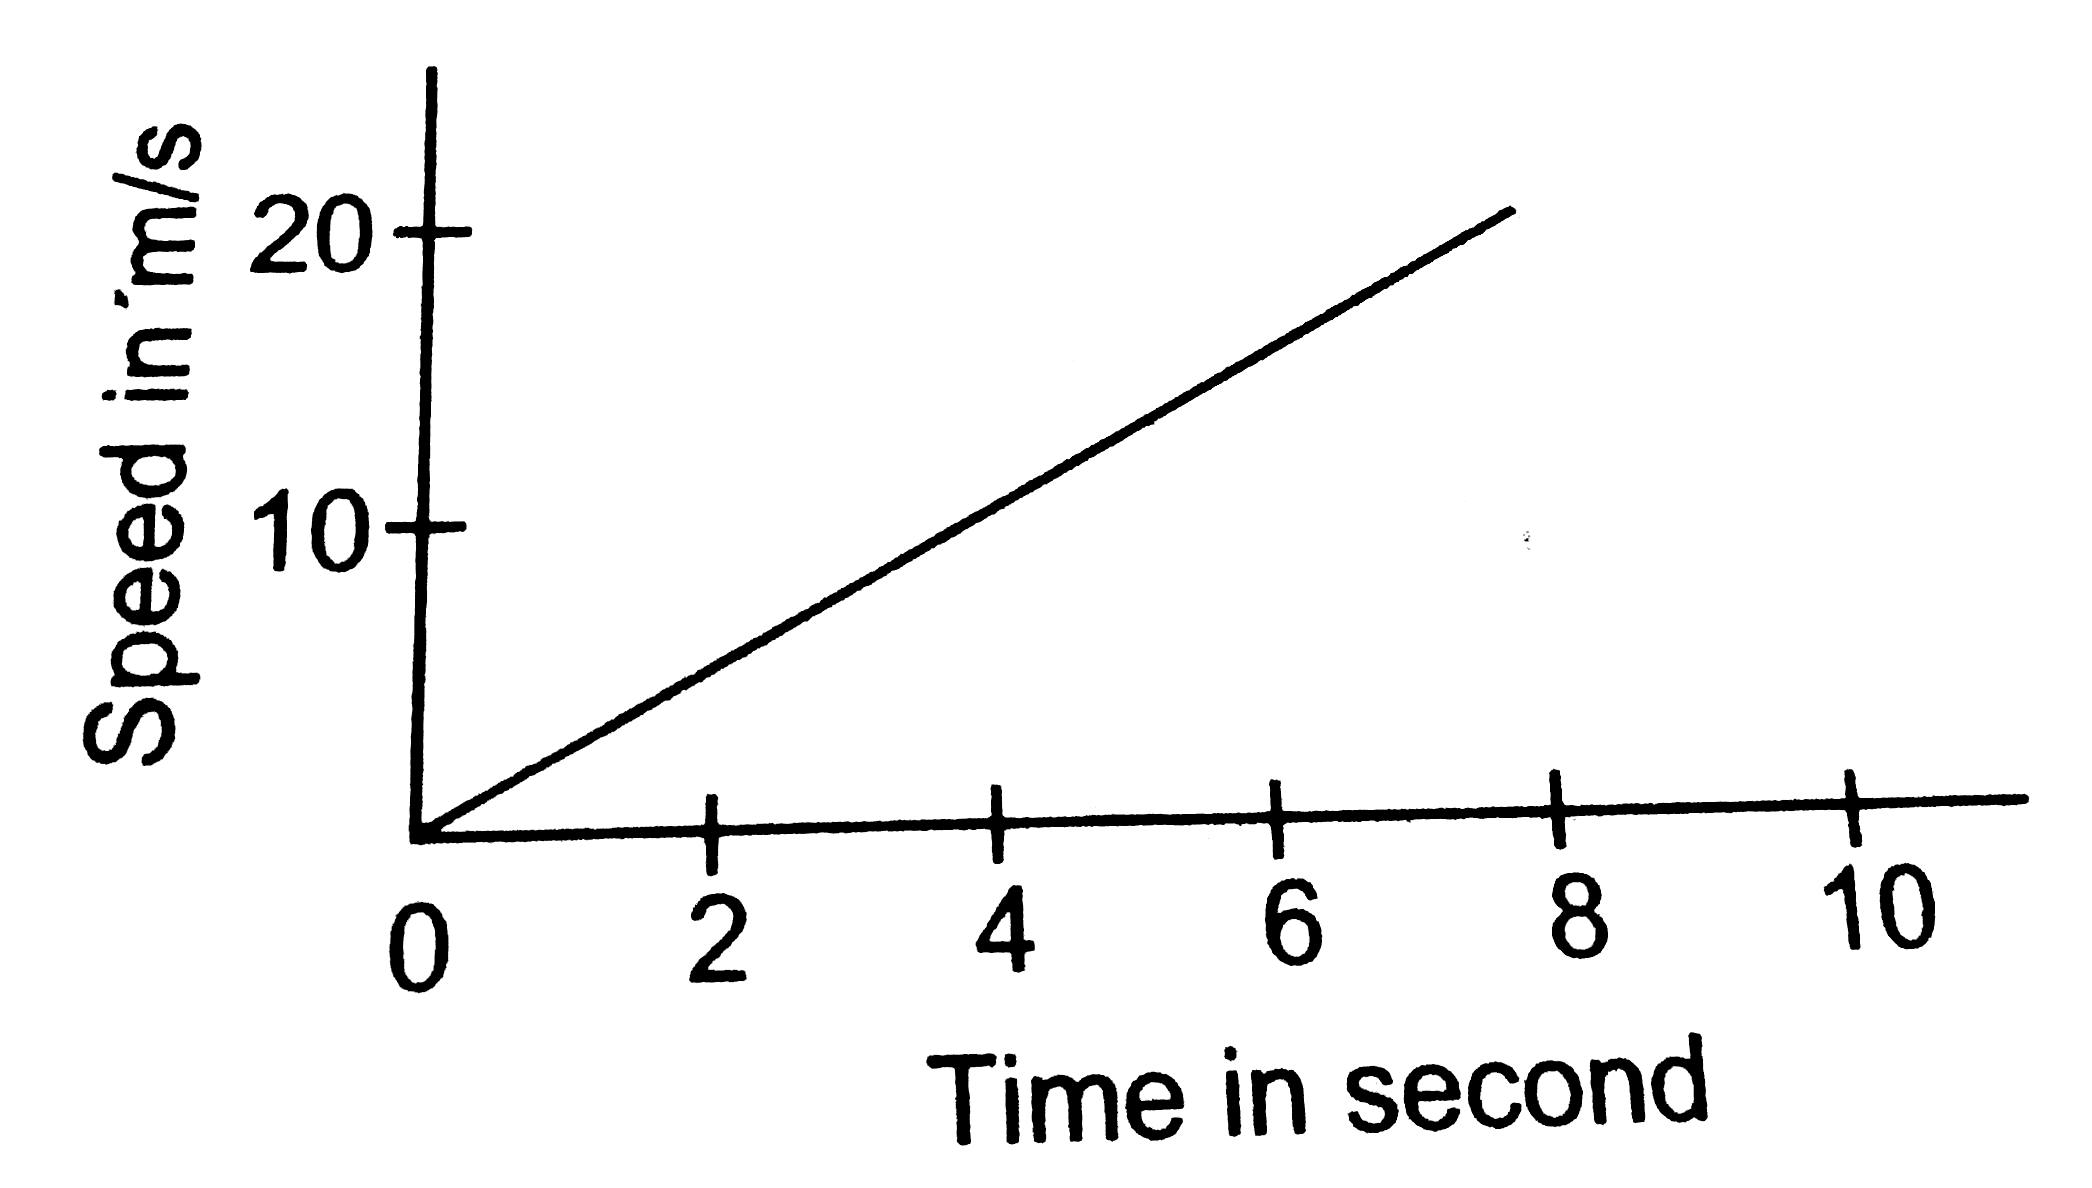
Find the distance travelled by the car in 8 seconds and its acceleration.
View SolutionThe diameter of a wheel of a car is 63 cm. Find the distance travelled by the car during the period, the wheel makes 1000 revolutions.
View SolutionA car travels for 20 min with a constant speed of 54 km h−1 Find the distance travelled by the car.
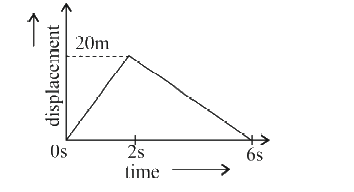
View SolutionFor the displacement-time graph shown in figure, the ratio of the magnitudes of the speeds during the first two second and the next four second is
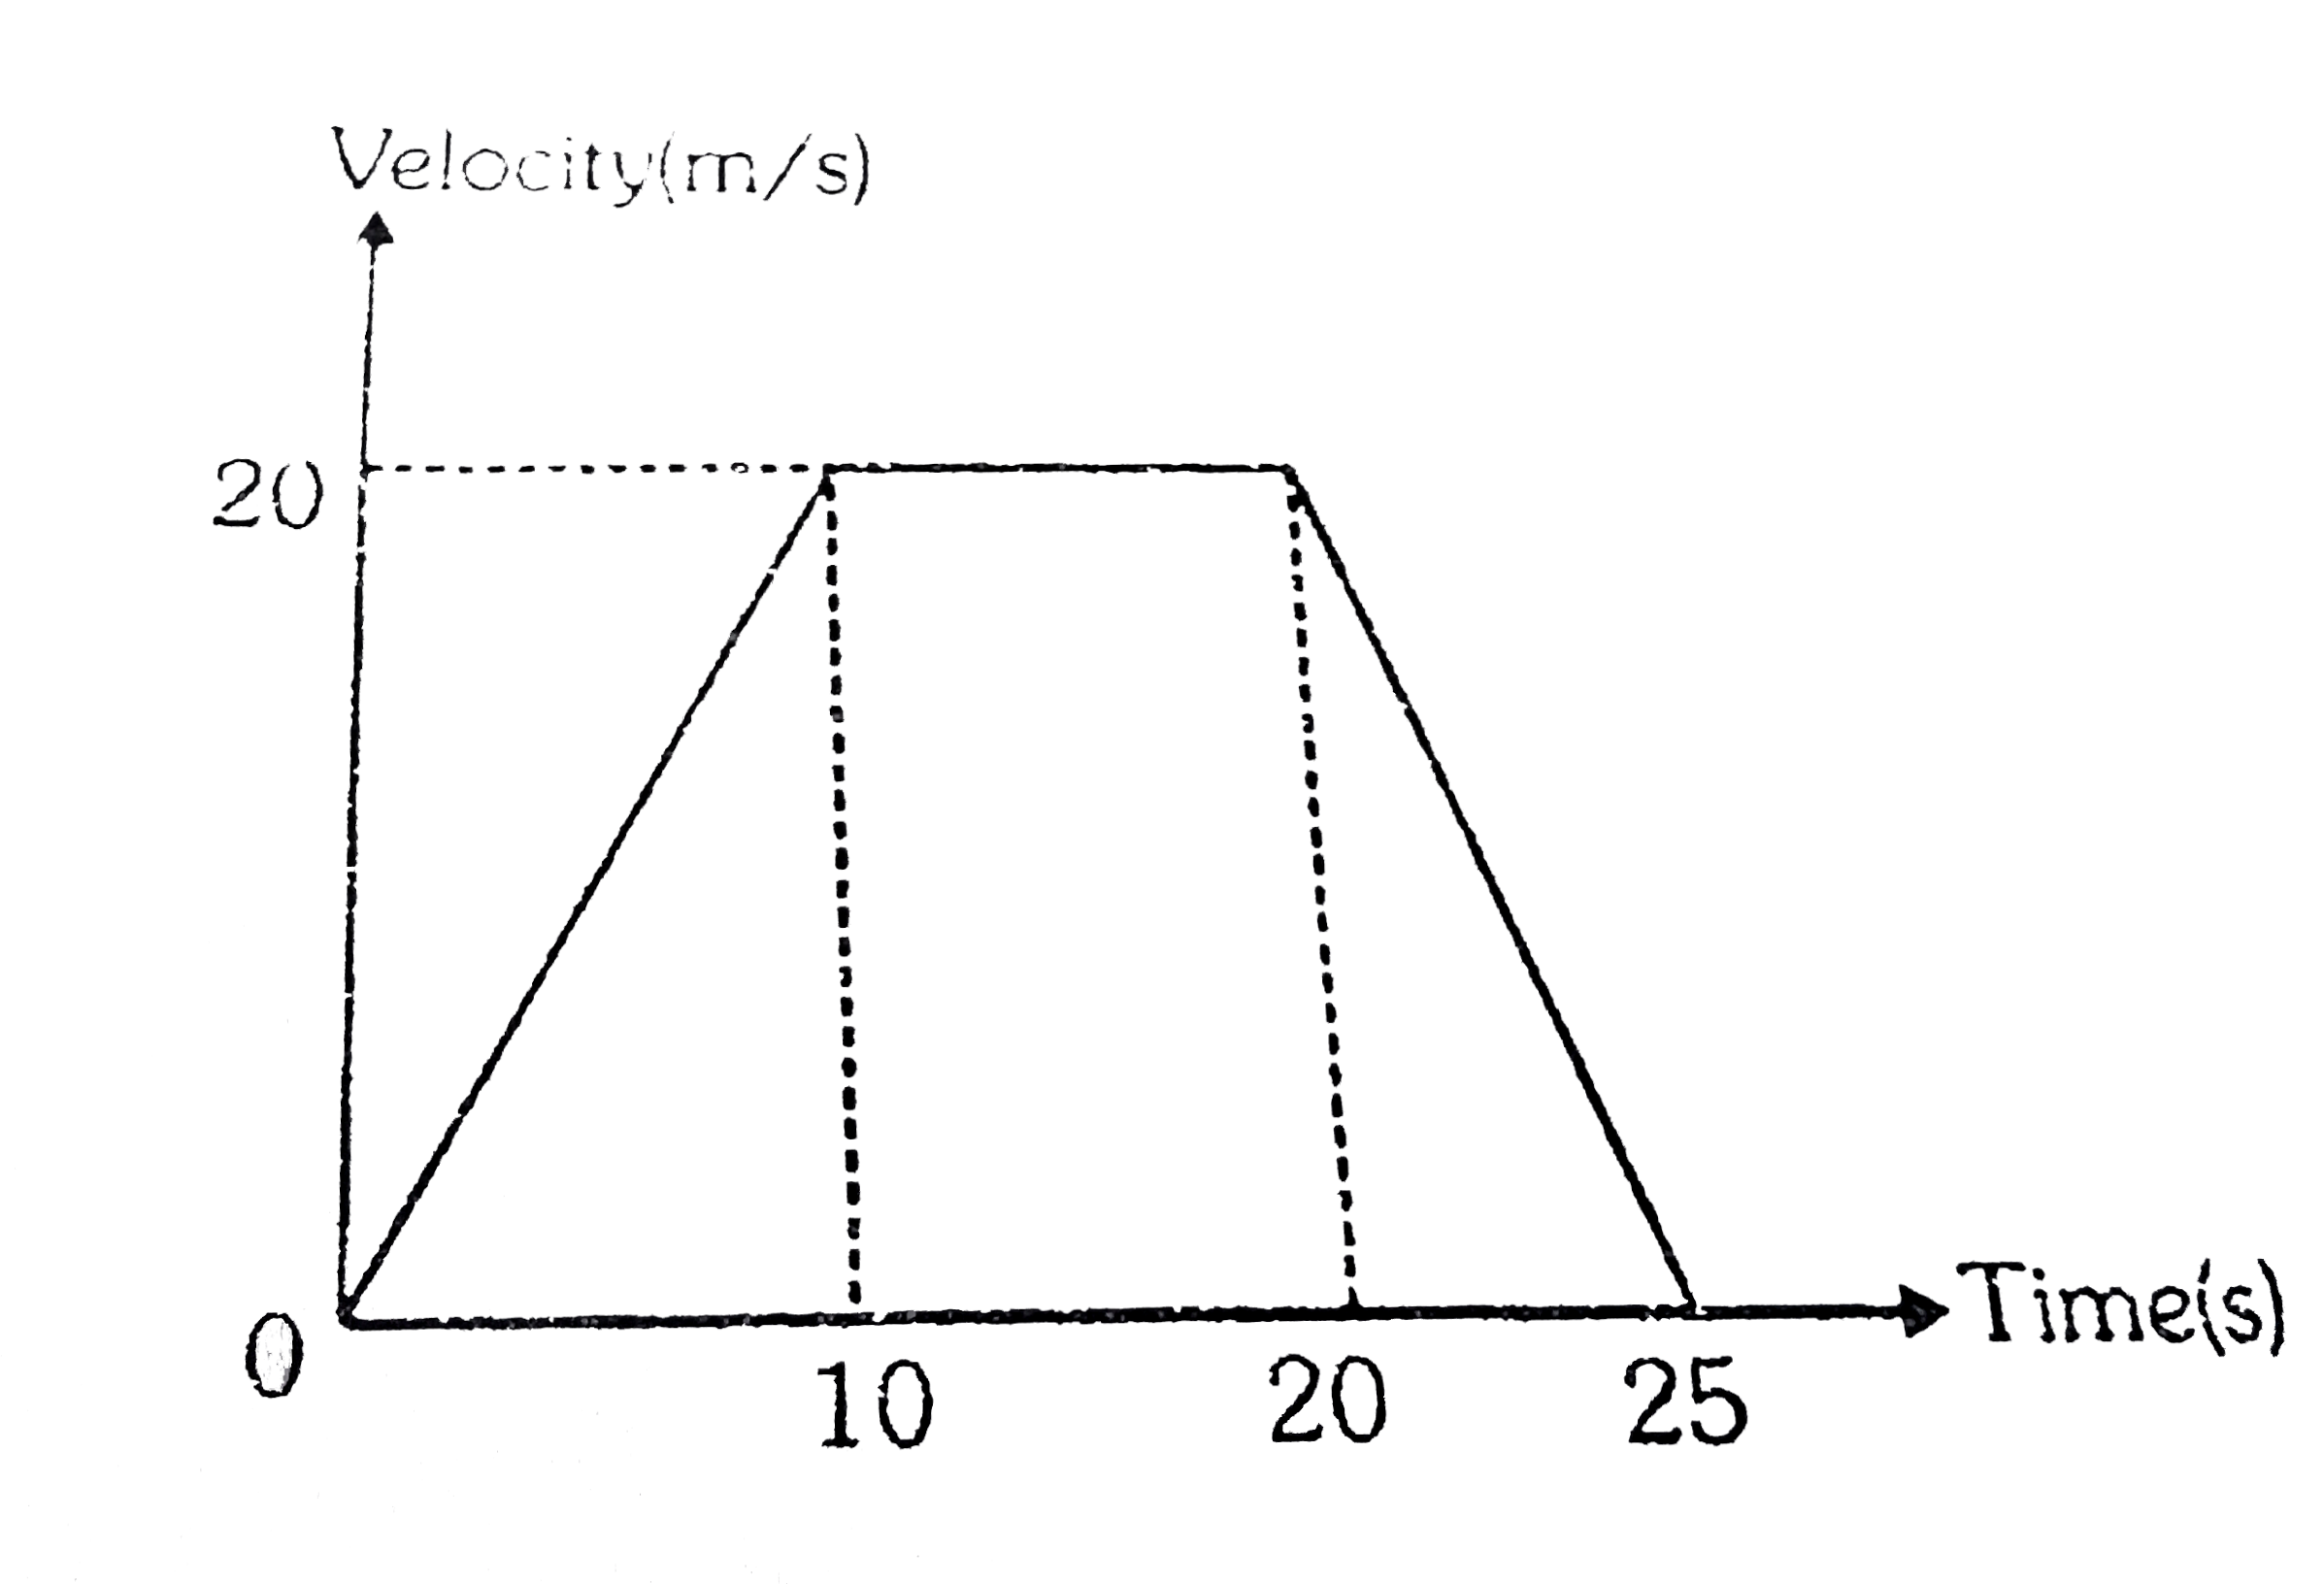
View SolutionThe velocity-time graph of a car moving along a straight road is shown in figure. The average velocity of the car is first 25 seconds is
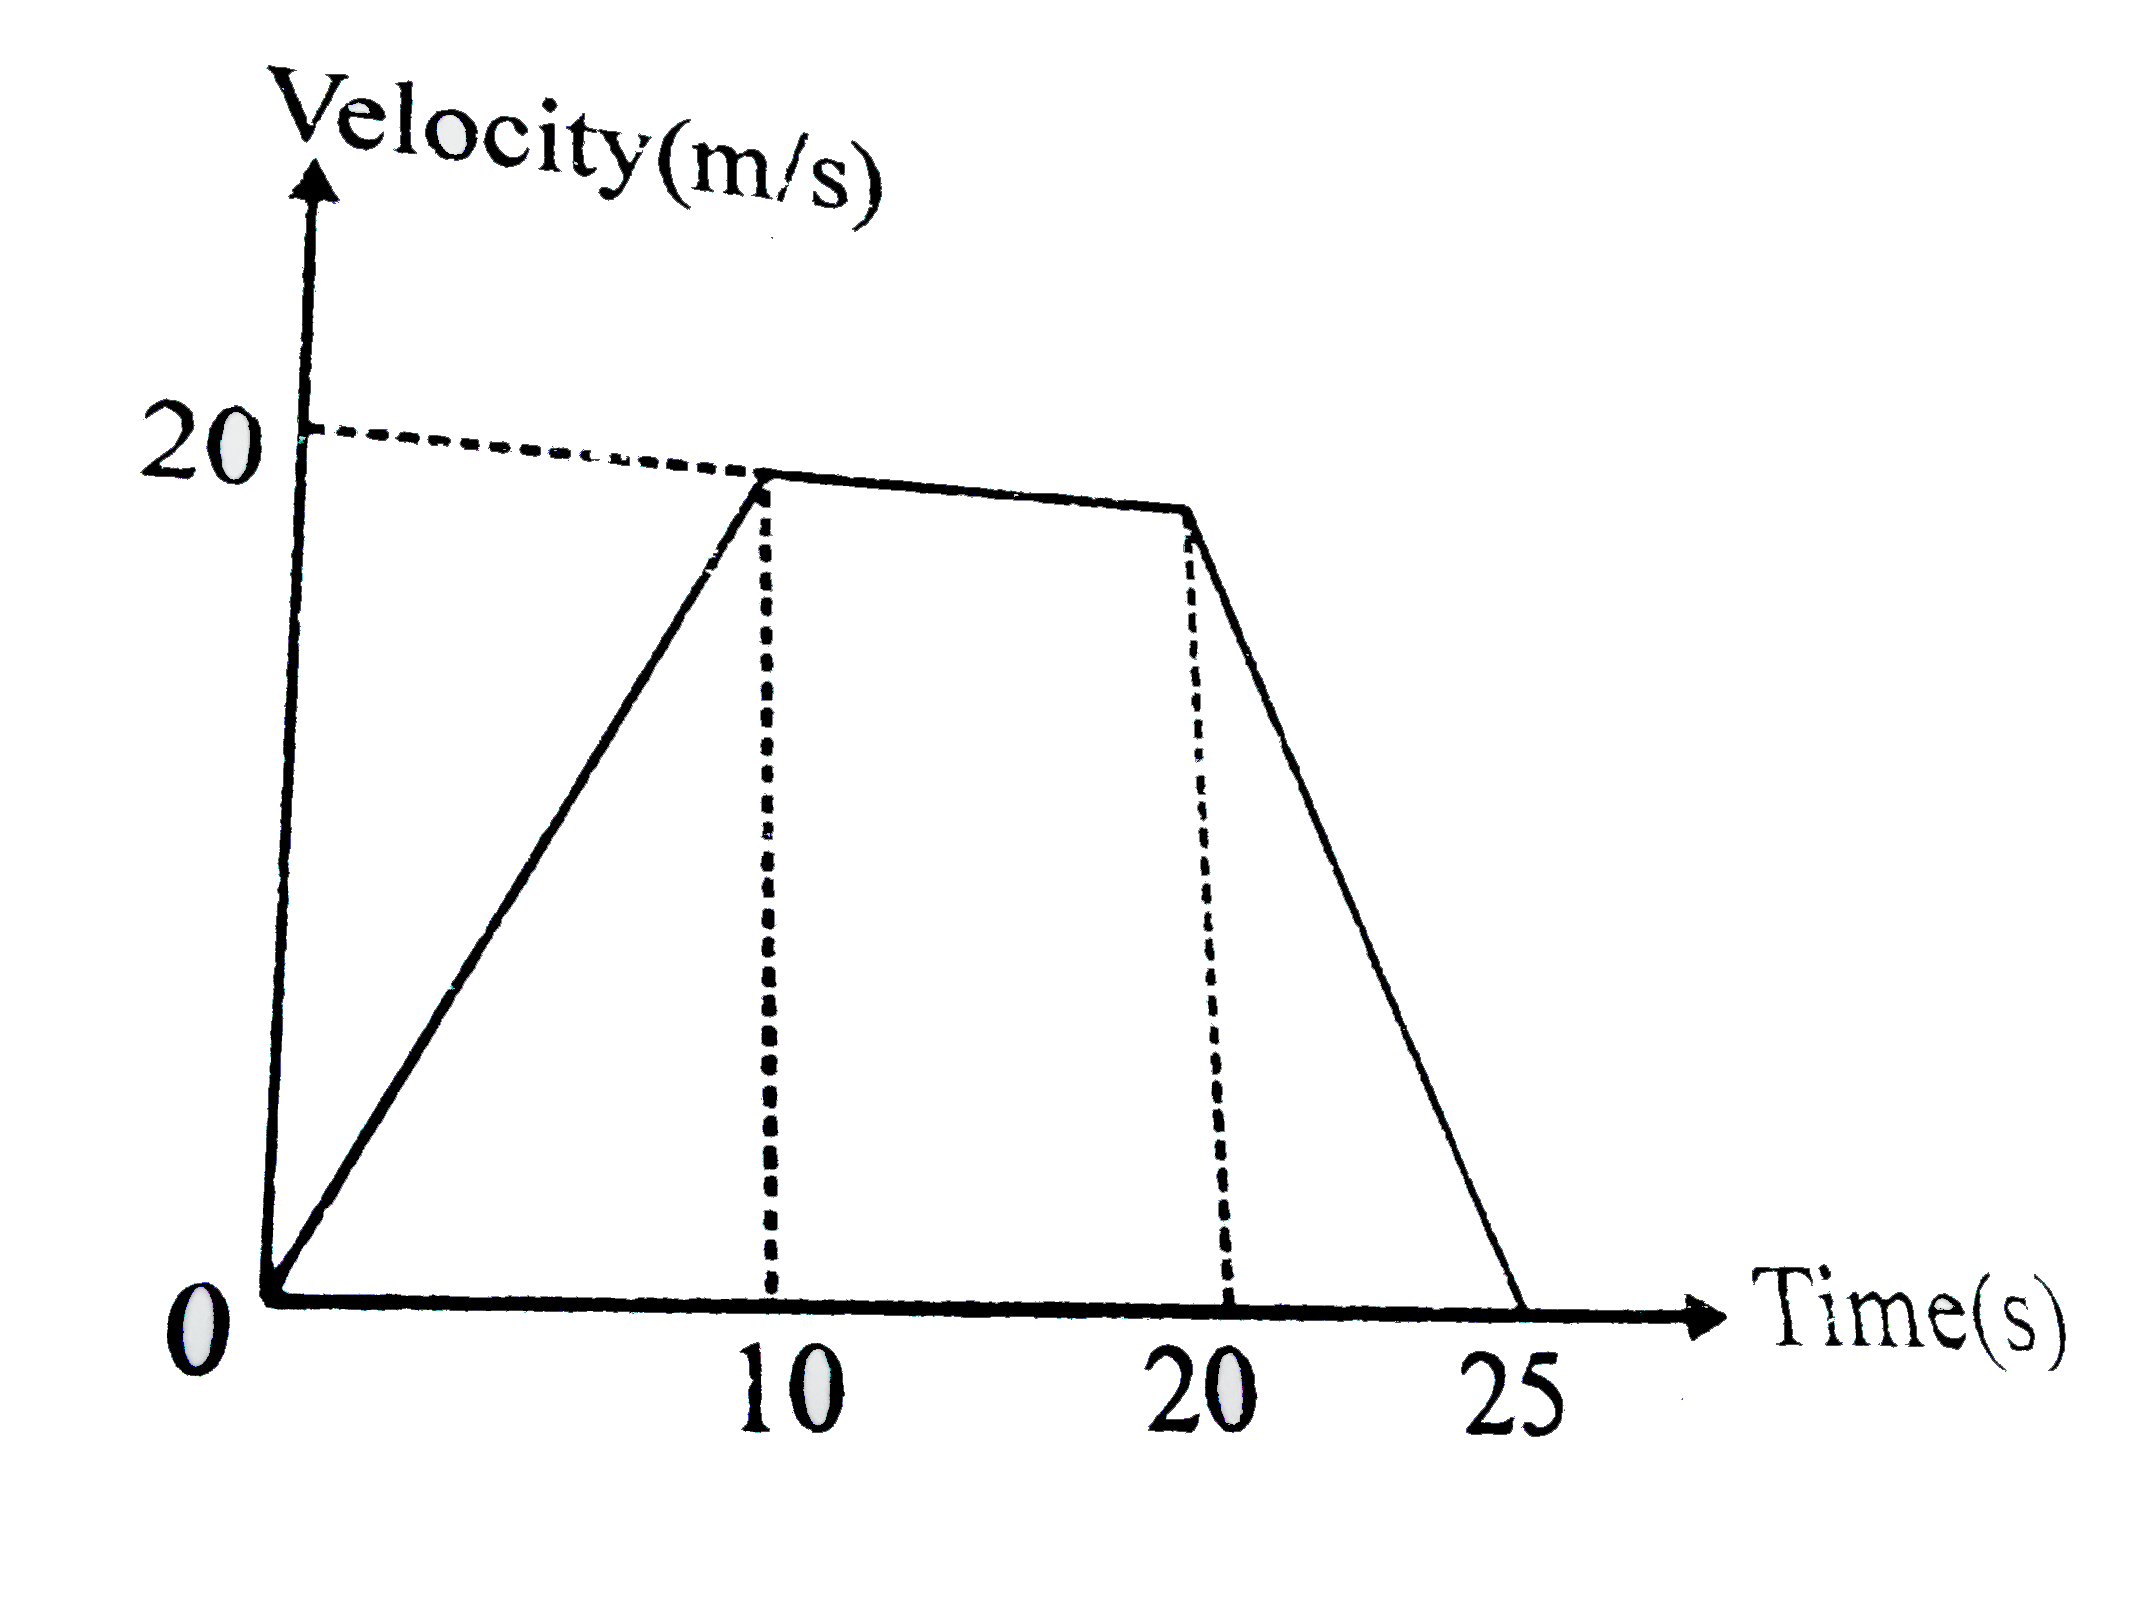
View SolutionThe velocity-time graph of a car moving along a straight road is shown in figure. The average velocity of the car in first 25 seconds is
View Solution

