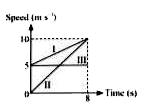
The speed-time graphs Speed (ms−1) for three moving vehicles I, II and Ill are shown here. If x,y and z are the distances travelled by I, II and III respectively in 8 s, then which of the following comparisons is correct?
x>y=z
x>y>z
x=y<z
x<y<z
The correct Answer is:A
The area under speed time graph, gives the distance travelled by the object.
For I, distancex=5(8)+12(8)5=60m
For II, distance y=12(8)(10)=40m
For III, distance z=5(8)=40m
Topper's Solved these Questions
- NSO QUESTION PAPER 2018- 19 SET - BBOOK - SCIENCE OLYMPIAD FOUNDATION CHAPTER - NSO QUESTION PAPER 2018- 19 SET - BEXERCISE - ACHIEVERS SECTION
2 Videos
- NSO QUESTION PAPER 2018- 19 SET - ABOOK - SCIENCE OLYMPIAD FOUNDATION CHAPTER - NSO QUESTION PAPER 2018- 19 SET - AEXERCISE - SCIENCE
9 Videos
- NSO QUESTION PAPER 2019-20 SET ABOOK - SCIENCE OLYMPIAD FOUNDATION CHAPTER - NSO QUESTION PAPER 2019-20 SET AEXERCISE - ACHIEVERS SECTION
2 Videos
Similar Questions
The distance- time graph for the motion of three vechicles,A , B and C are as shown in the figure , SA,SBndSC are the speeds, of A,B and C , respectively , compare the speeds of A, B and C.
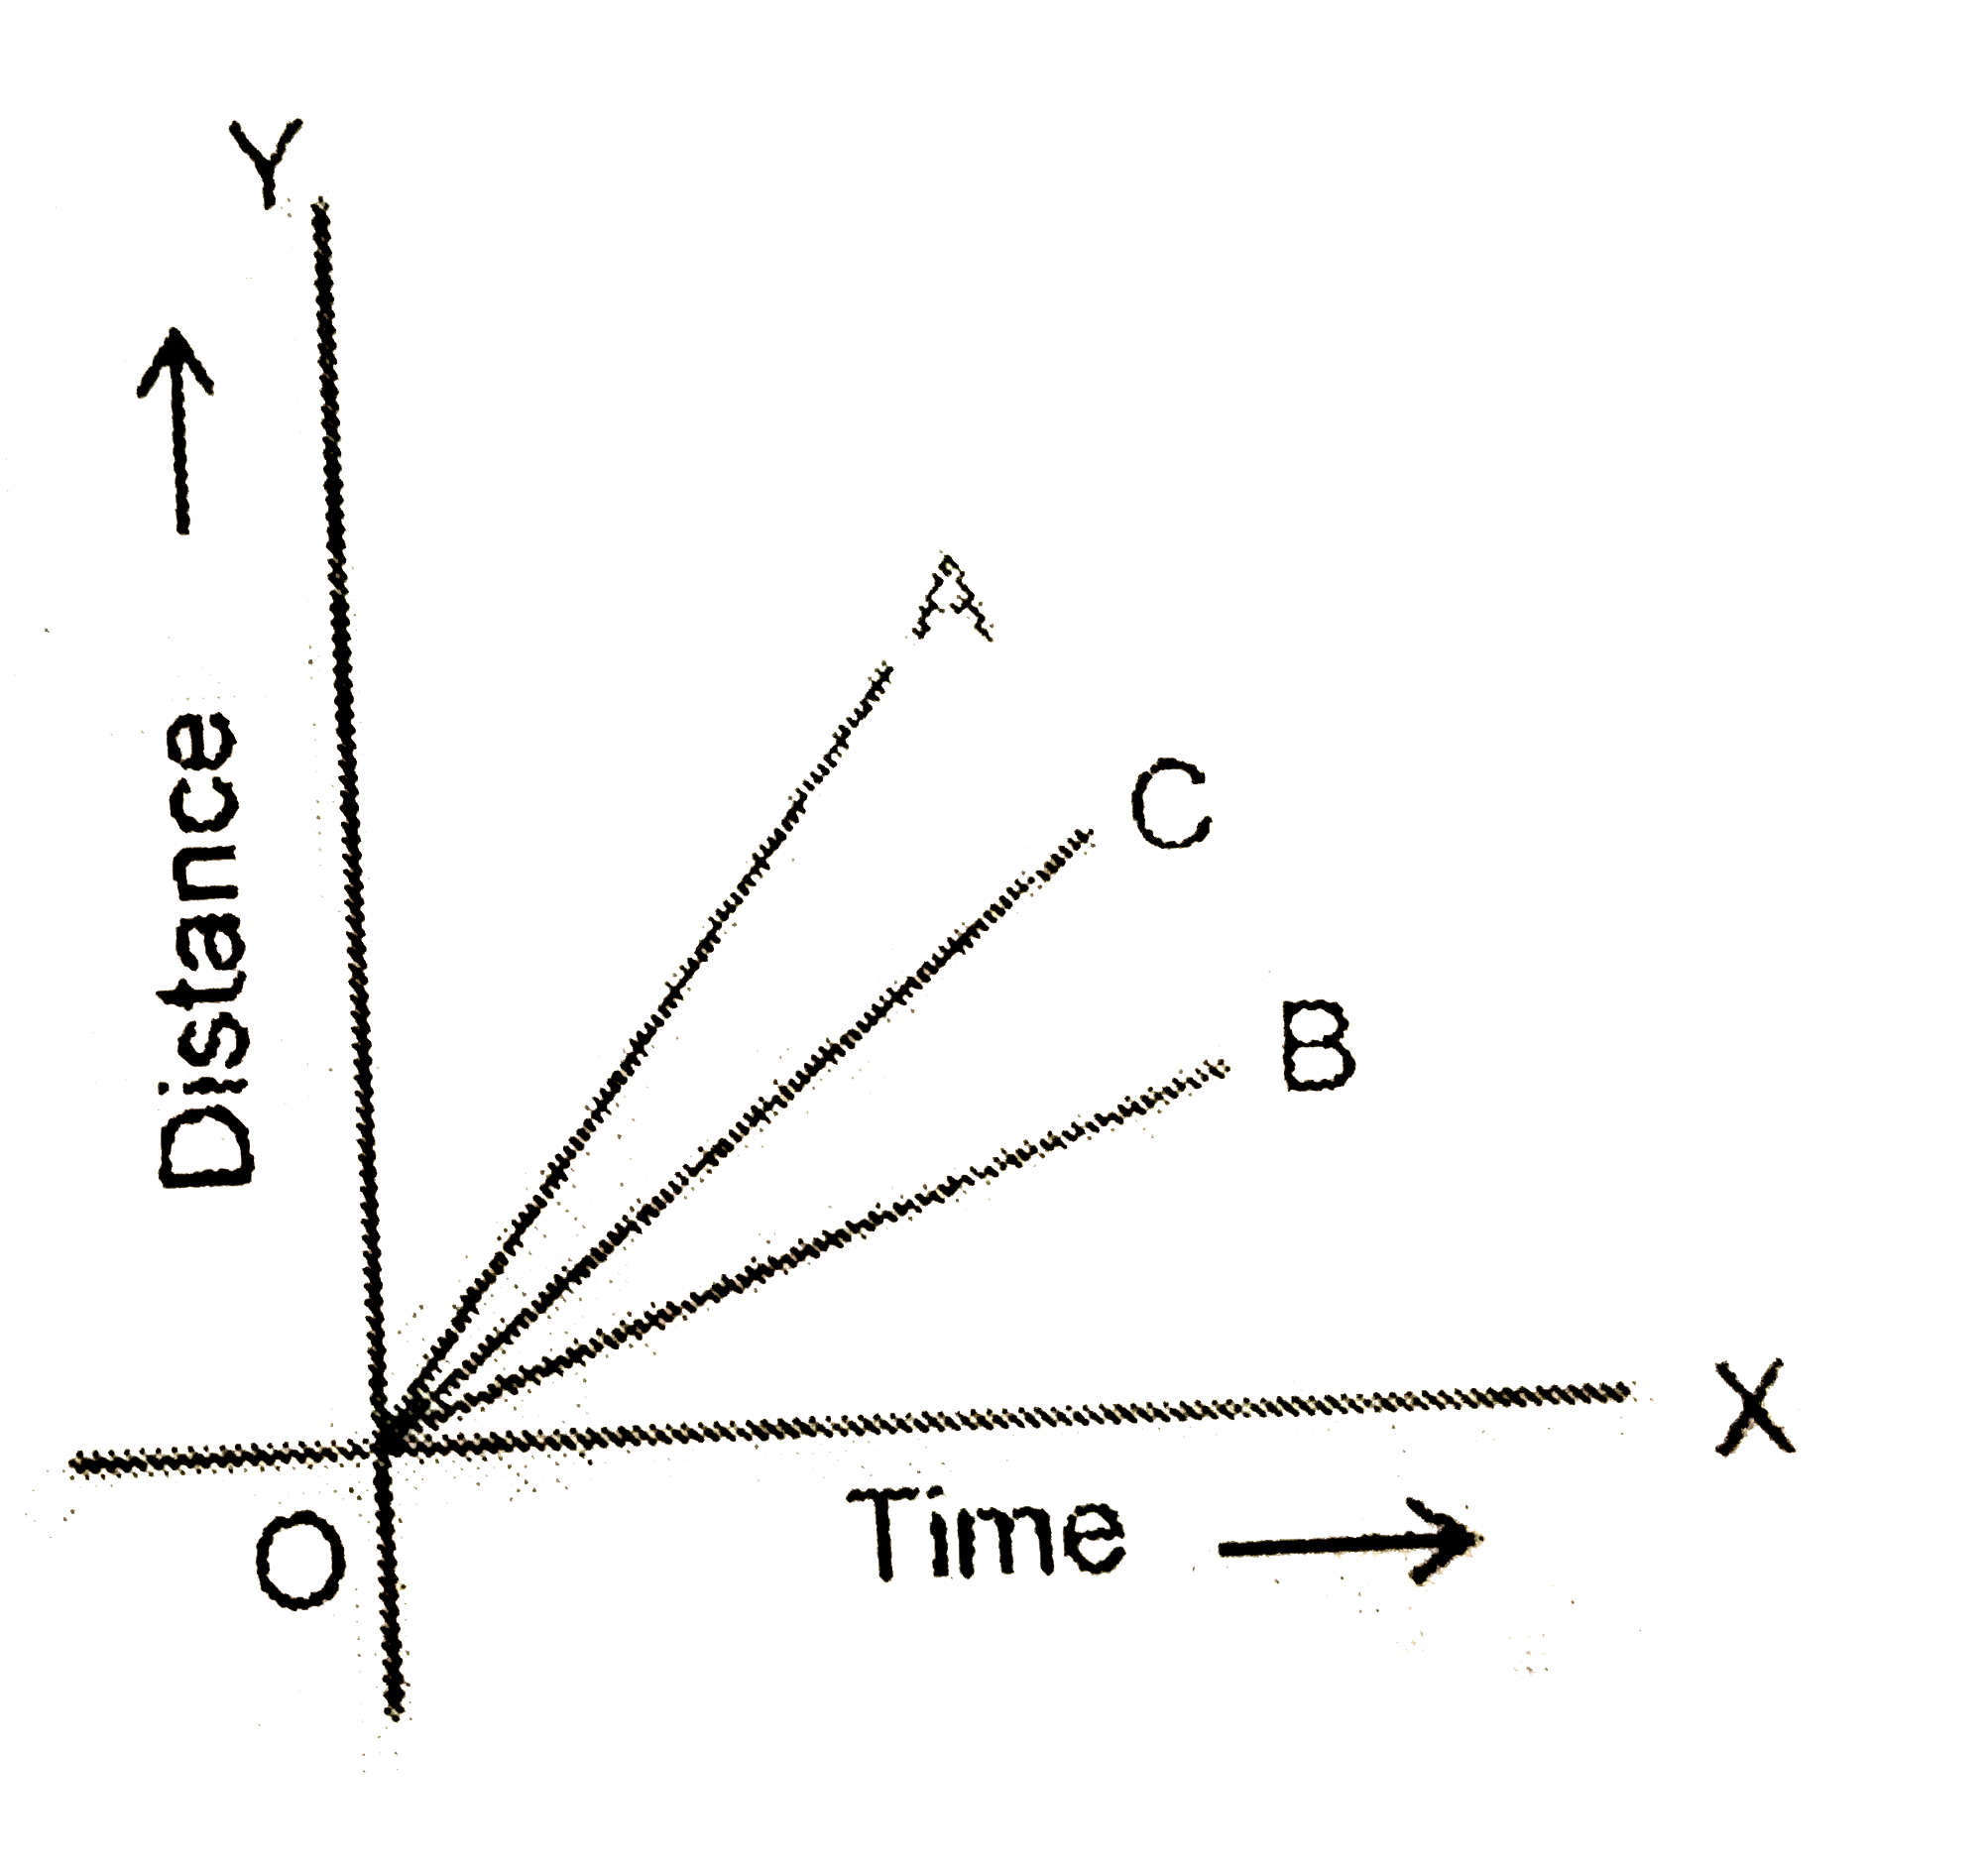
View SolutionThe distance- time graph for the motion of three vechicles,A , B and C are as shown in the figure , SA,SBndSC are the speeds, of A,B and C , respectively , compare the speeds of A, B and C.

View Solution
Knowledge Check
Which of the following compounds (s) has Z configuration?
I.
II.
III. AOnly IBOnly IICOnly IIIDI and III
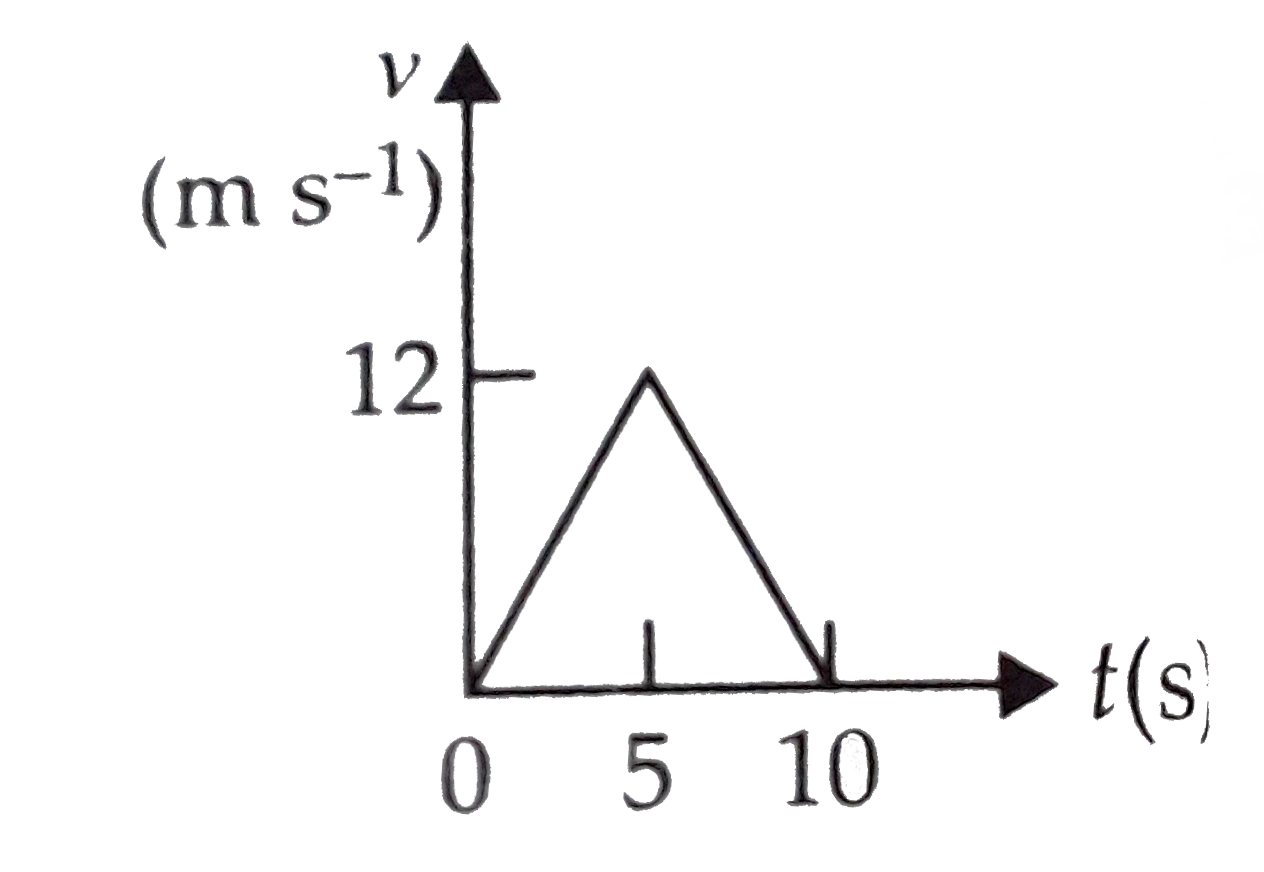
The speed-time graph of a particle moving along a fixed direction as shown in the figure. The distance traversed by the particle between t = 0 s to t = 10 s is
 A20 mB40 mC60 mD80 m
The speed-time graph of a particle moving along a fixed direction as shown in the figure. The distance travelled by the particle between t = 0 s to t = 10 s is
 A20 mB40 mC60 mD80 m
Which of the following organisms follow the graphs I, II and III respectively ?
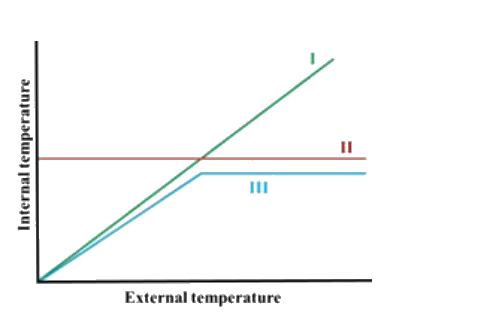
View SolutionWhich of the following organisms follow the graphs I, II and III respectively ?

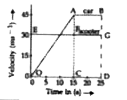
View SolutionThe velocity-time graphs of a car and a scooter are shown in the figure. (i) The difference between the distance travelled by the car and the scooter in 15 s and (ii) the time at which the car will catch up with the scooter are, respectively.
View SolutionGiven below as Figure 13.8 is the distance-time graph of the motion an object.
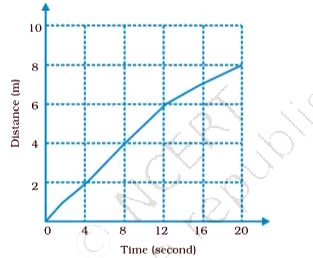
(i) What will be the position of the object at 20s?
(ii) What will be the distance travelled by the object in 12s?
(iii) What is the average speed of the object?
View SolutionA student appears for tests I. II and III. The student is considered successful if he passes in test I. II or I. III or all the three. The probabilities of the student passing in test I. II and III are m. n and 12 respectively. If the probability of the student to be successful is 12 then which one of the following is correct ?
View Solution
