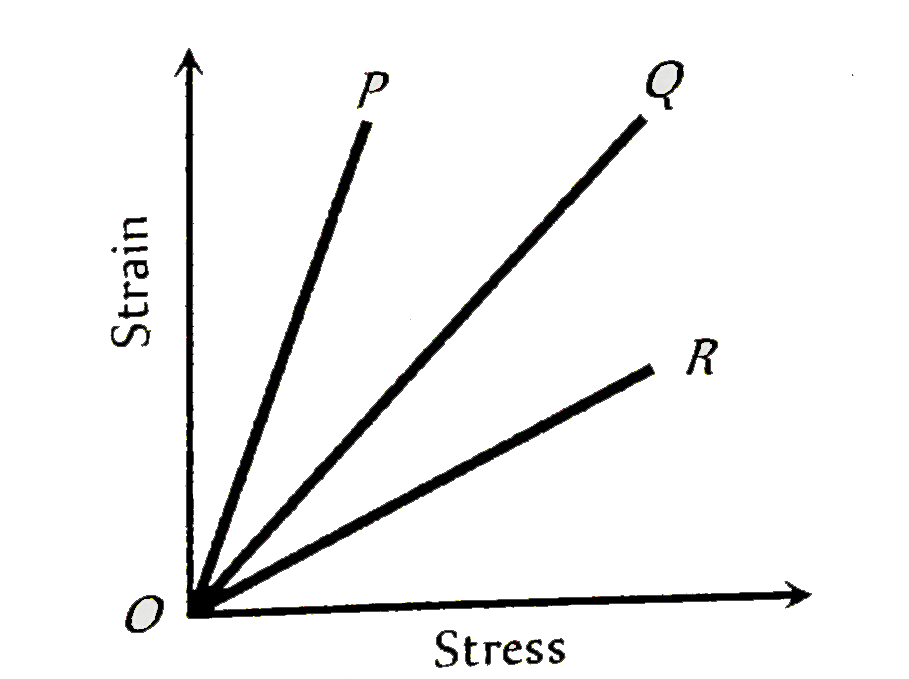
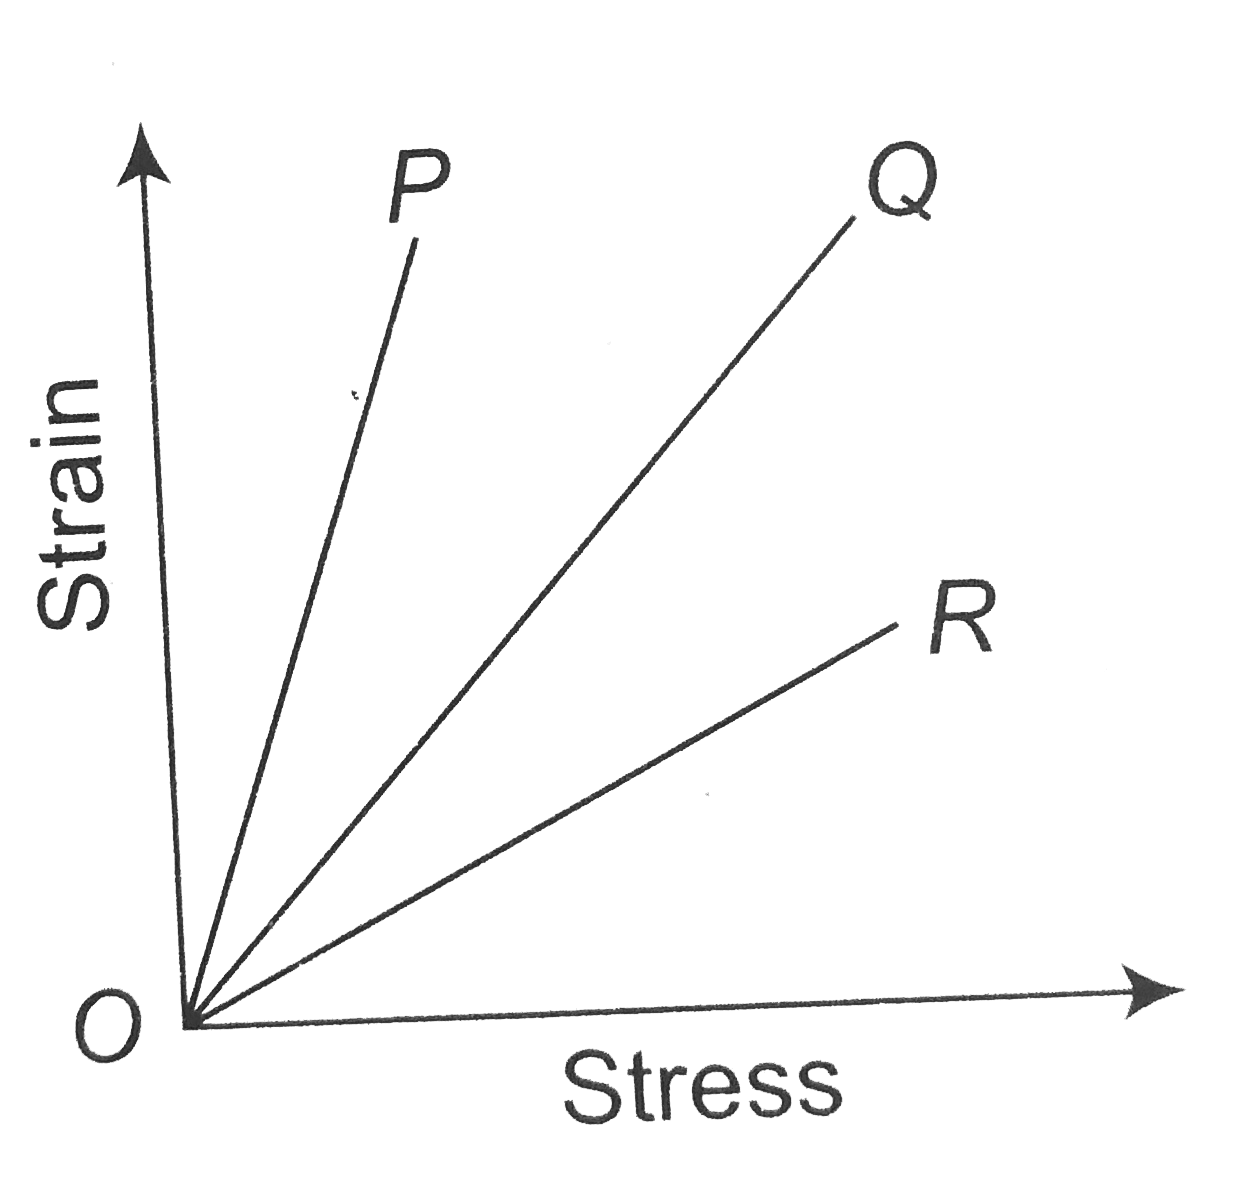
The stain-stress curves of three wires of different material are showm in the figure P,Q,R are the elastic limits of the wires, the figure shows that
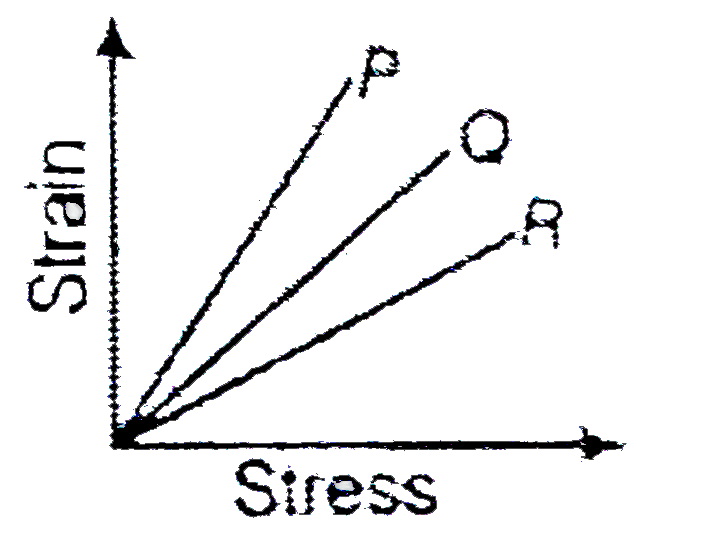
elasticity of wire P is maximum
elasitcity of wire R is maximum
tensile strenght of R is maximum
None the above
The correct Answer is:B
(b)As stress is shown on x-axis and strain on y-axis.
So, we can say that y=cotθ=1tanθ=1slope
So, elasticity of wire P is minimum and R is maximum.
Topper's Solved these Questions
Similar Questions
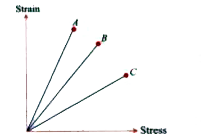
Stress - strain graph of three different are as shown. A,B and C are the Young's modulus of the wires. Which of the following statement is correct ?
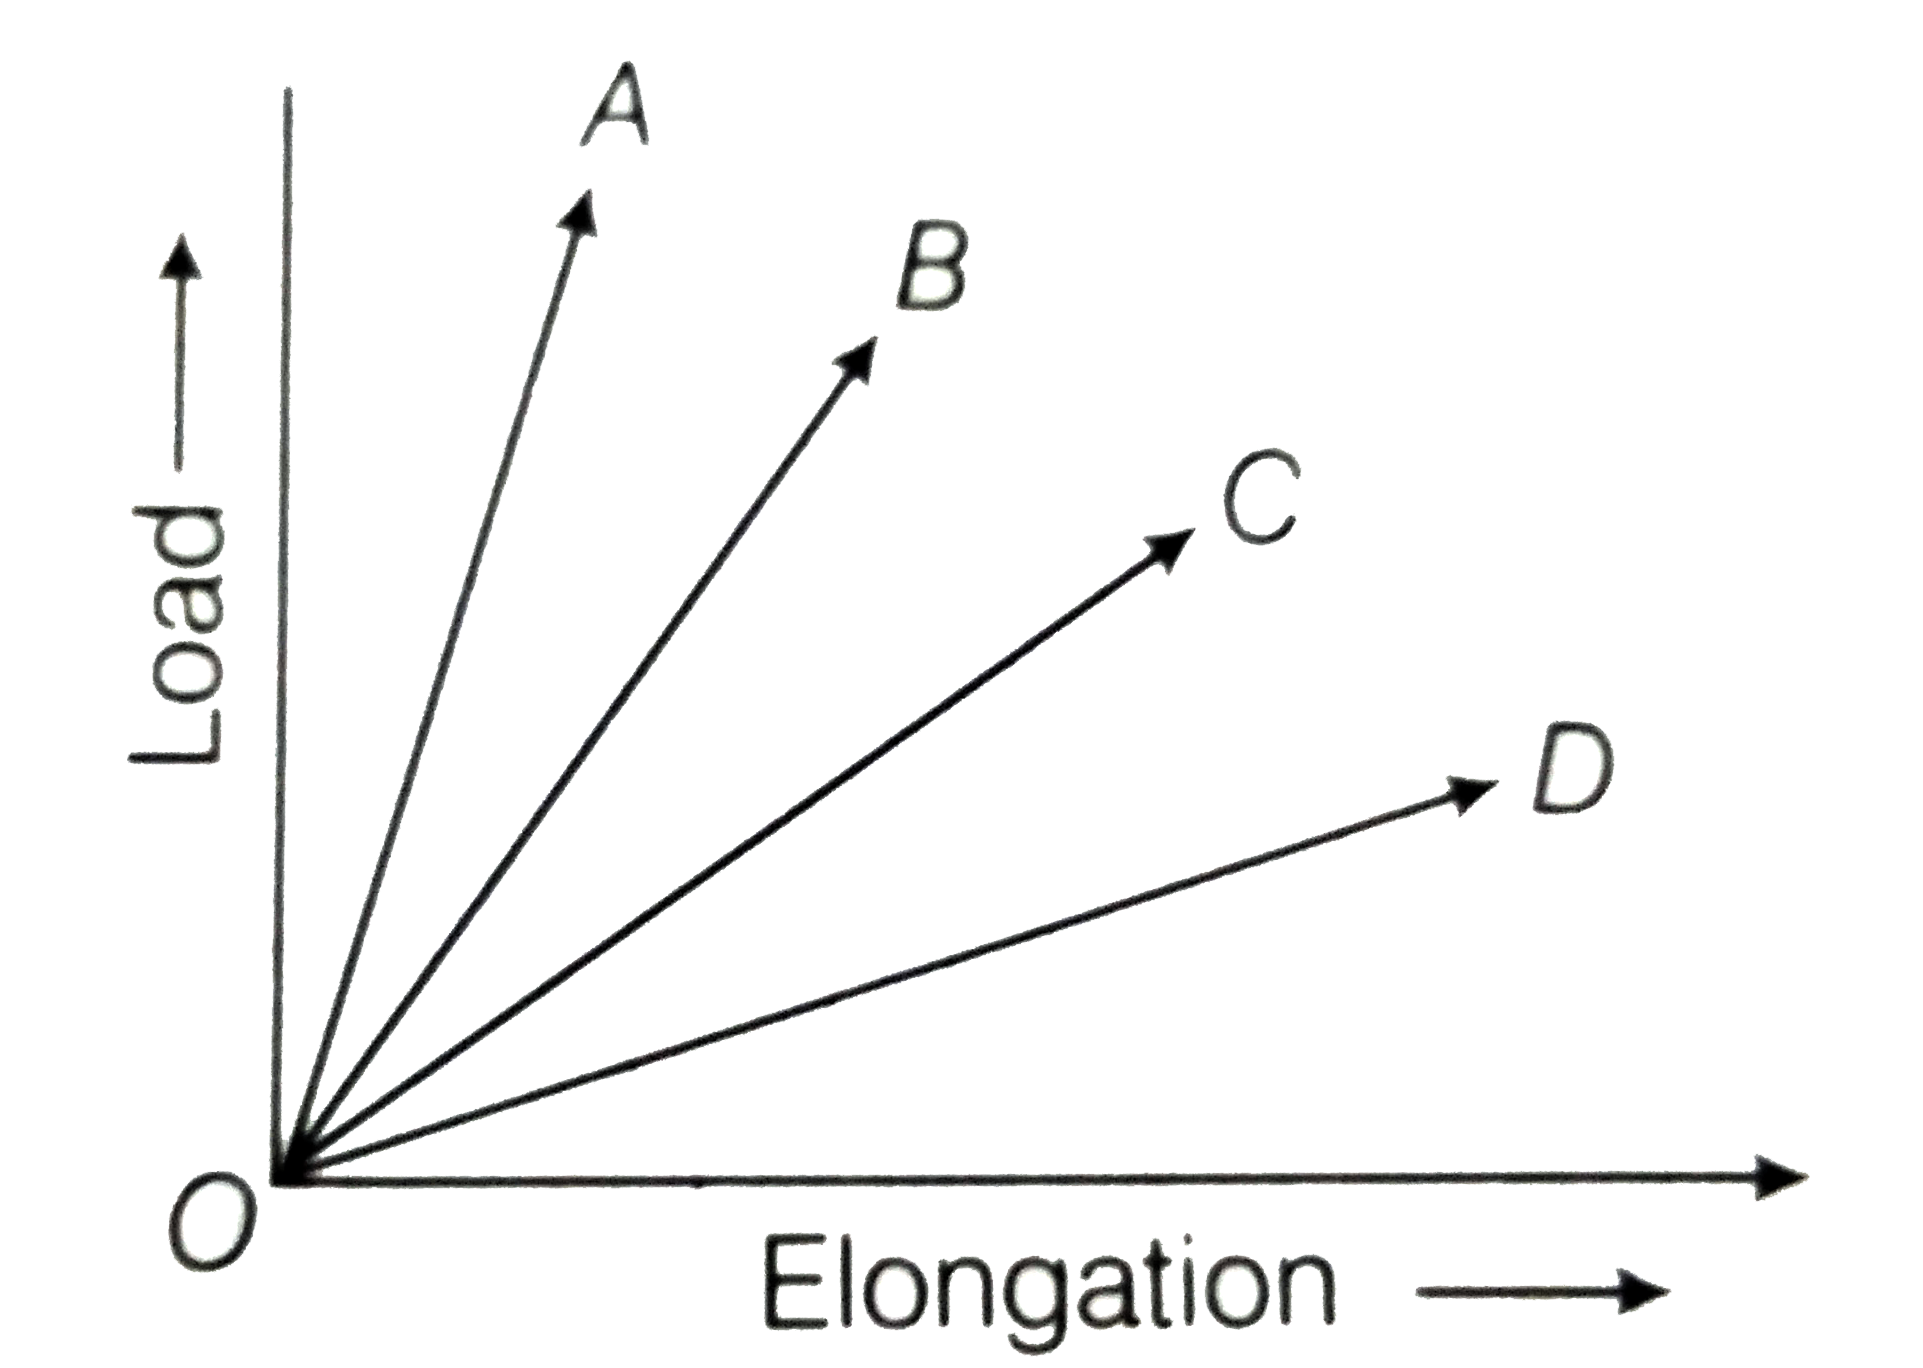
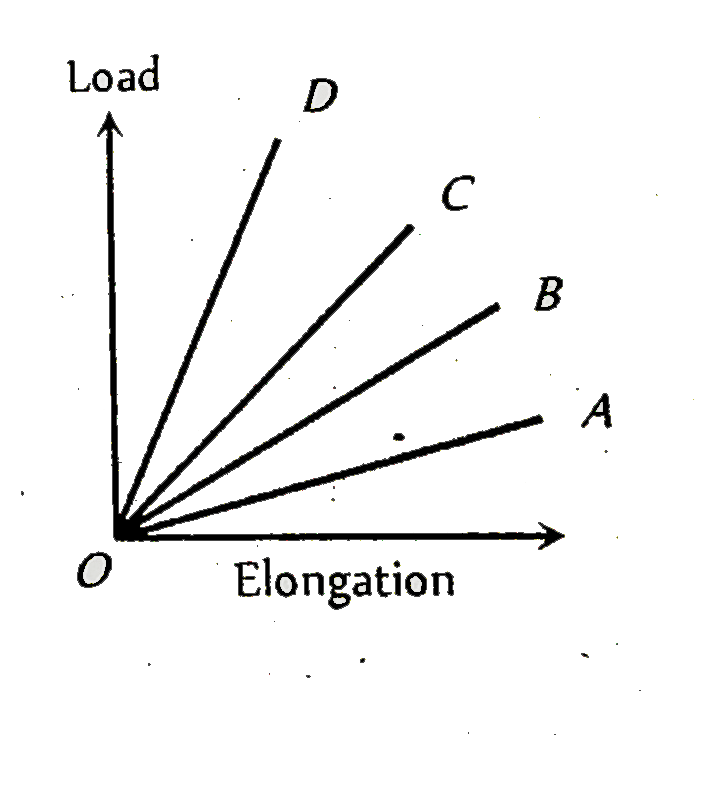
View SolutionThe load versus elongation graph of four wires of same length and the same material as shown in the figure. The thinest wire is represented by the line
View Solution
Knowledge Check
The strain-stress curves of three wires of different materials ar shown in the figure P,Q and R are the elastic limits of the wires. The figure shows that :
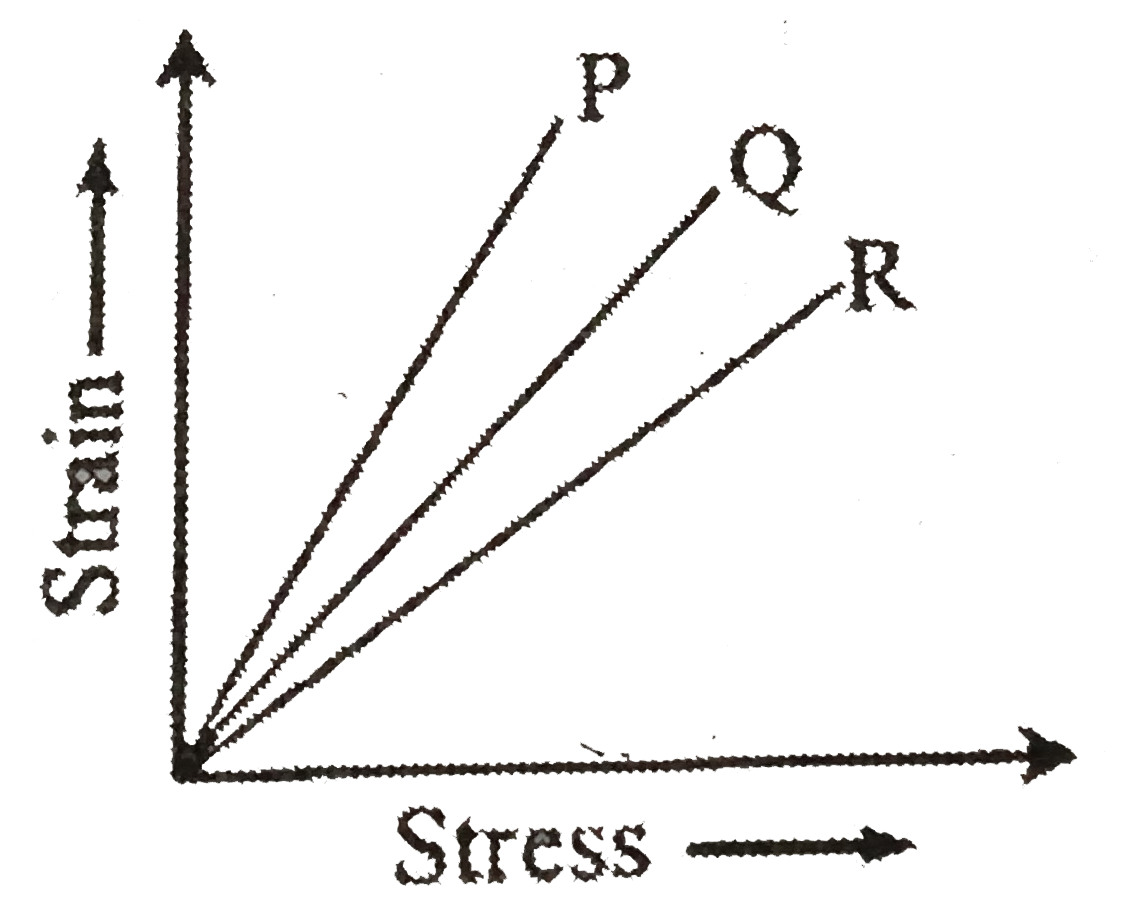 Aelasticity of wire P is maximumBelasticity of wire Q is maximumCtensile strength of R is maximumDnone of the above
The strain-stress curves of three wire of different materials are shown in the figure. P,Q and R are the elastic limits of the wires. The figures shows that
 AElasticity of wire P is maximumBElastiity of wire Q is maximumCTensile strength of R is maximumDNone of the above is true
The strain stress curves of three wires of different materials are shown in the figure. P, Q and R are the elastic limits of the wires. The figure shown thatAElasticity of wire P is maximumBElasticity of wire Q is maximumCTensile strength of R is maximumDNone of the above is true.
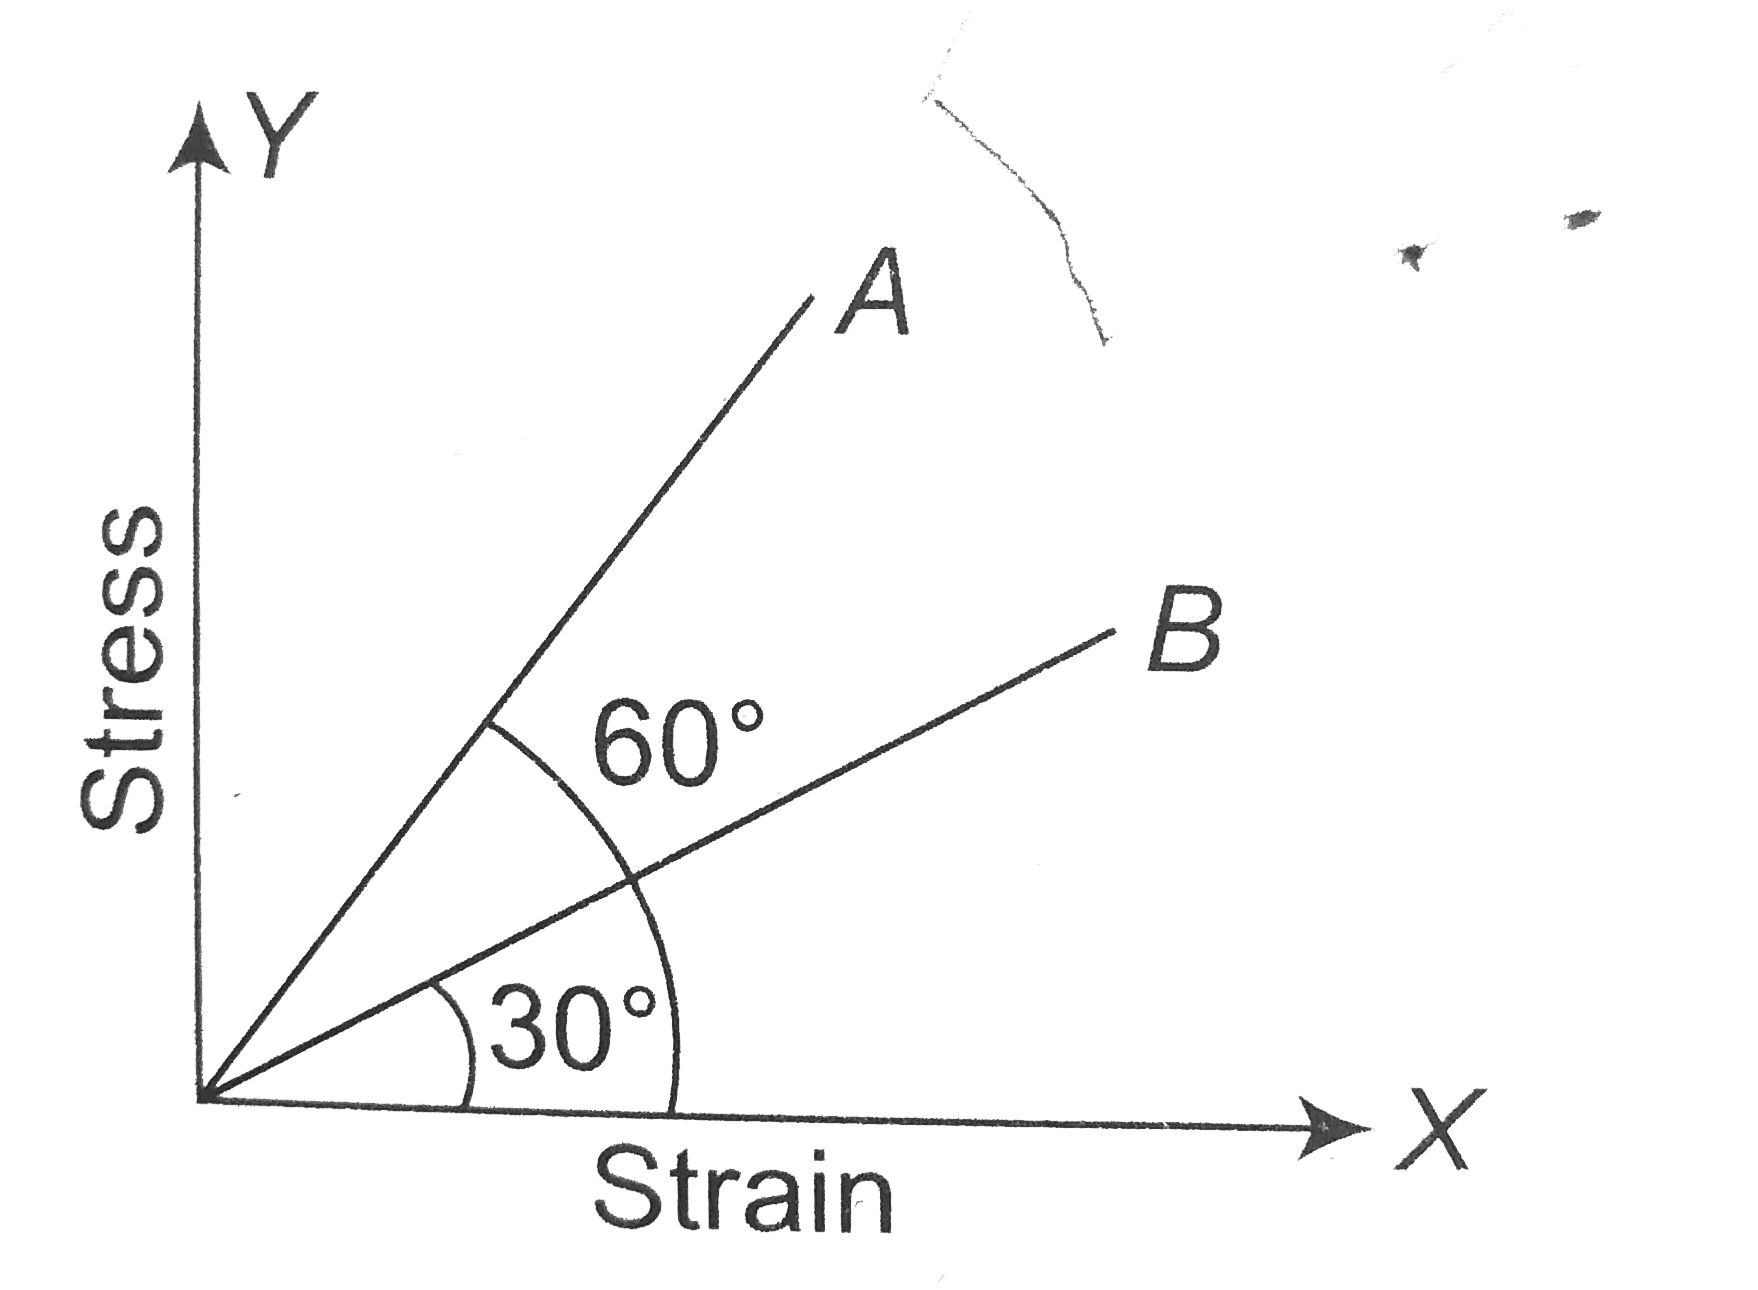
The stress versus strain graphs for wires of two materials A and B are as shown in the figure. If YA and YB are the Young's moduli of the materials then
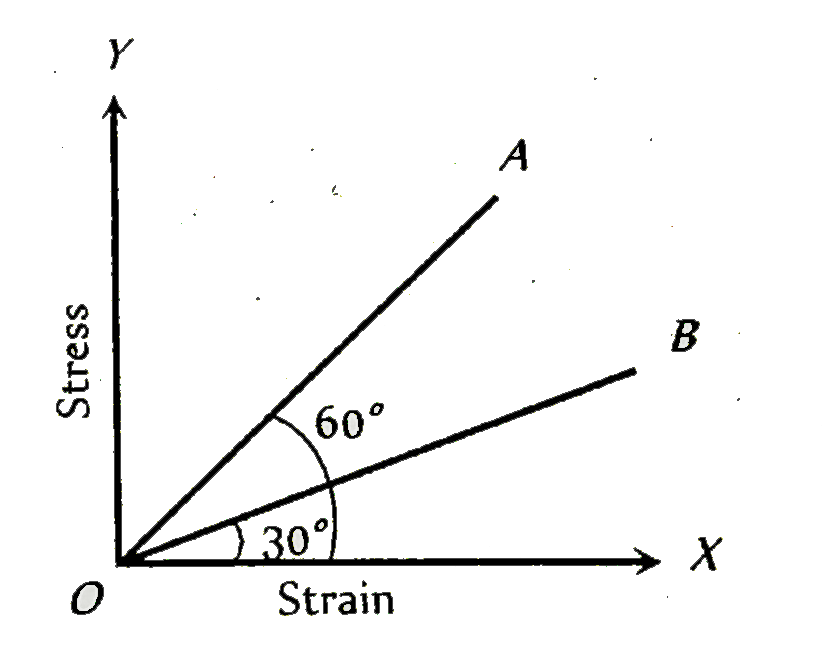
View SolutionThe stress versus strain graphs for wires of two materials A and B are as shown in the figure. If YAandYB are the younng's moduli of the materials, then
View SolutionAssertion Upto elastic limit of a stress-strain curve, the steel wire tends to regain its original shape when stress is removed.
Reason Within elastic limit, the wire follows Hooke's law.
View SolutionThe load versus elongation graph for four wires of the same material is shown in the figure. The thickest wire is represented by
View SolutionThe breaking stress for a wire of radius r of given material is F N/m2. The breaking stress for the wire of same material of radius 2r is:
View Solution
