The stopping potential as a function of frequency of incident radiation is plotted for two different photoelectric surfaces A and B . The graphs as shown in figure shows that , the work function of A is
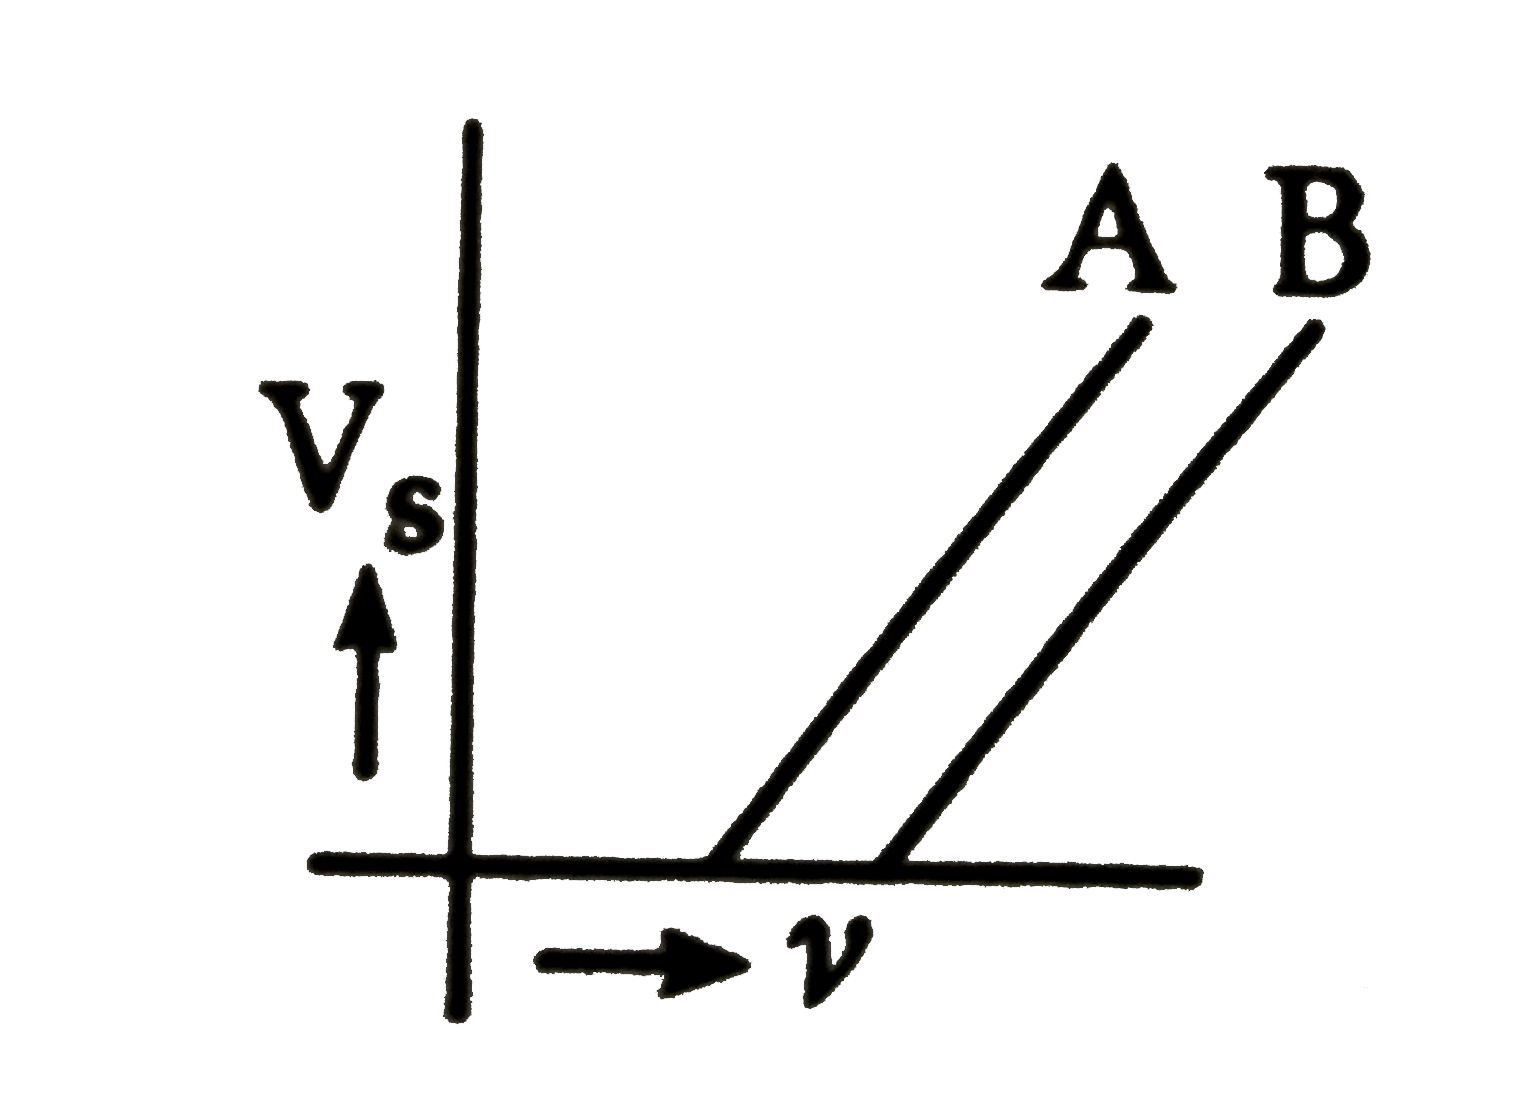
greater than that of B
smaller than that of B
same as that of B
no comparison be made from given graphs
The correct Answer is:B
Step by step video & image solution for The stopping potential as a function of frequency of incident radiation is plotted for two different photoelectric surfaces A and B . The graphs as shown in figure shows that , the work function of A is by Physics experts to help you in doubts & scoring excellent marks in Class 12 exams.
Updated on:21/07/2023Topper's Solved these Questions
Similar Questions
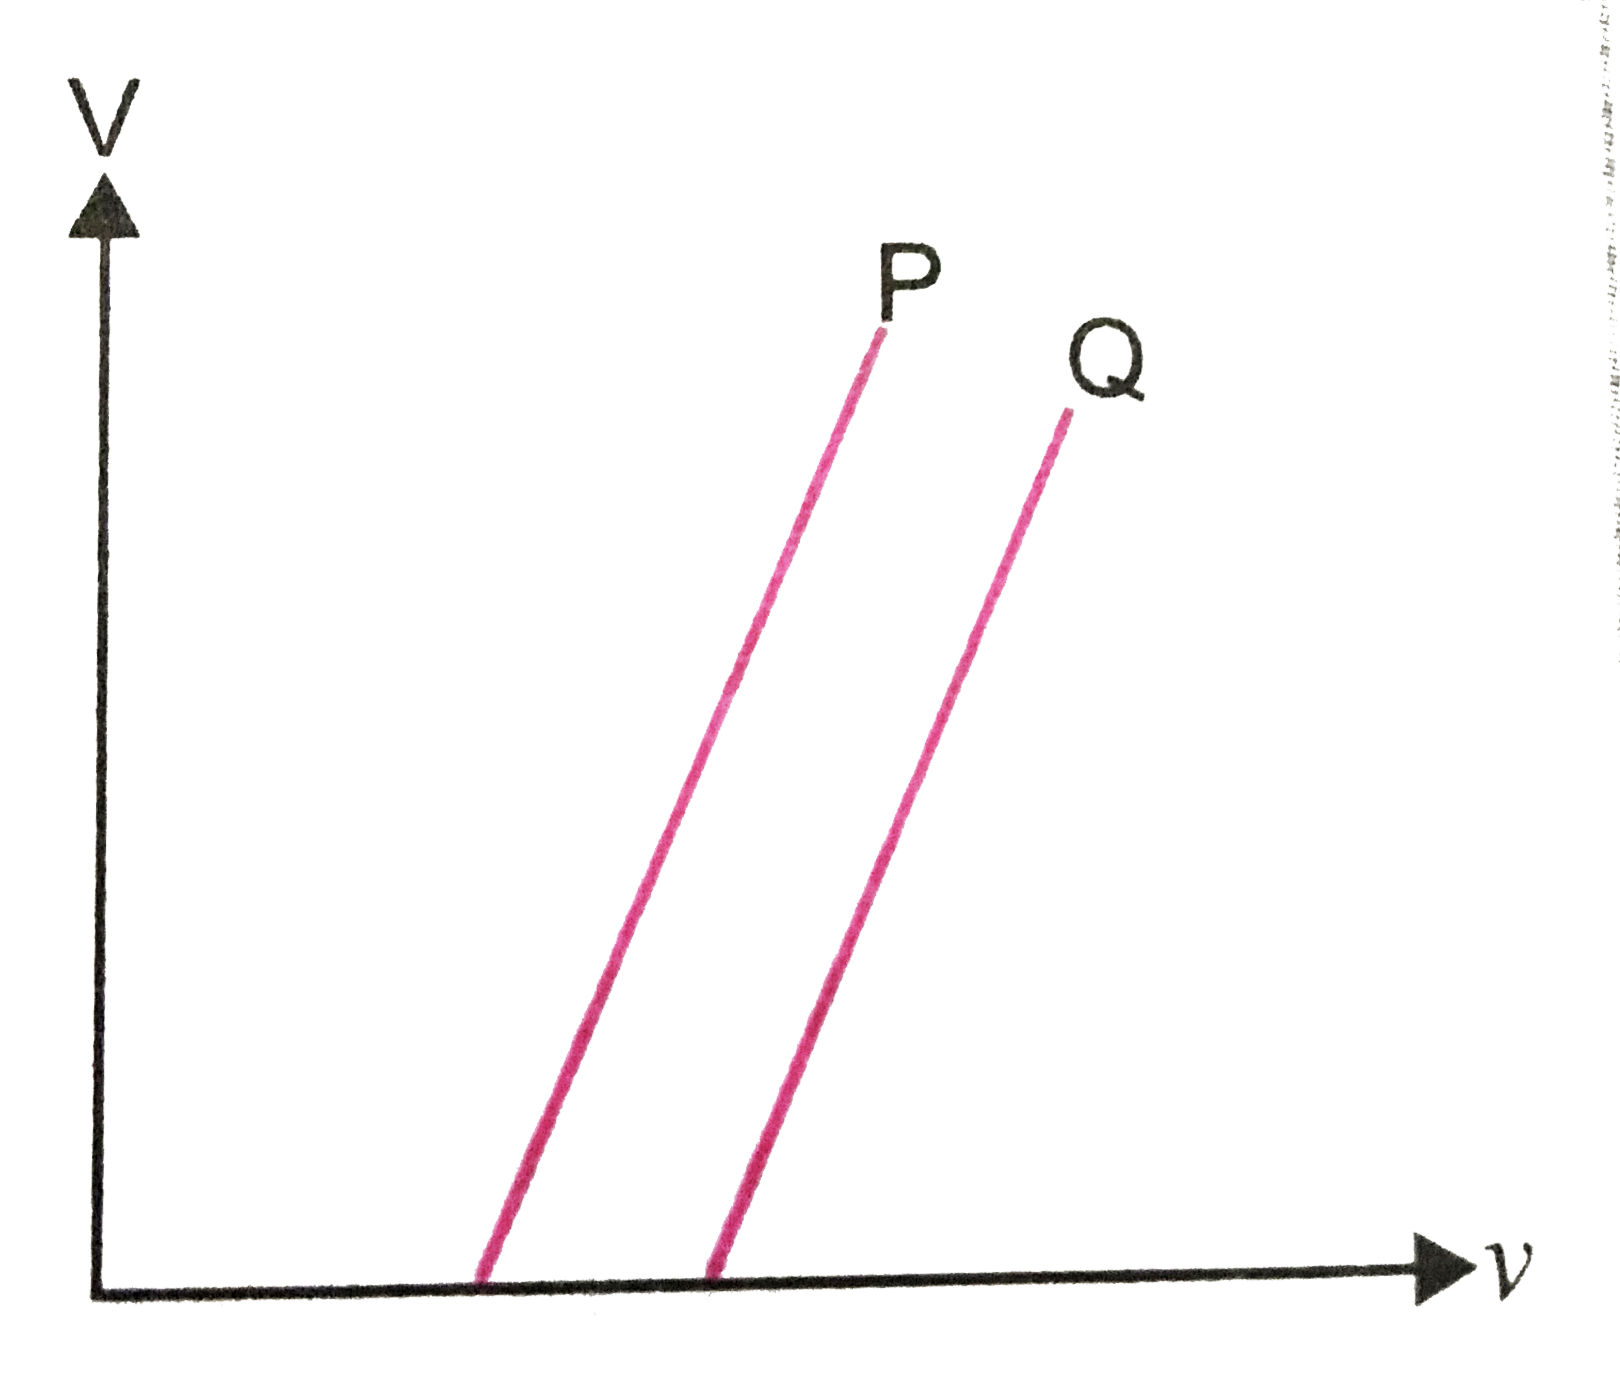
In a photoelectric effect experiment, the graph between the stopping potential (V) and frequency (v) of the incident radiations on two different metal plates P and Q are shown in plates, P and Q has greater value of work function ? (ii) What does the slope of the lines depict?
View SolutionWhat is the effect of decrease in frequency of incident radiation on the stopping potential in photoelectric emission?
View Solution
Knowledge Check
The stopping potential as a function of the frequency of the incident radiation is plotted for two different photoelectric surfaces A and B . The graphs show that work function of A is
 AGreater than that of BBSmaller than that of BCSame as that of BDNo comparison can be done from given graphs
The stopping potential as a function of the frequency of the incident radiation is plotted for two different photoelectric surfaces A and B . The graphs show that work function of A is
 AGreater than that of BBSmaller than that of BCEqual to that of BDNo inference can be drawn about their work functions from the given graphs
The emission of electrons from a metal surface exposed rto light radaition of appropriate wavelength is called photoelectroic effect .The emmited electron are called photo=-weklectron work function of threshold energy may be defined as the minimum amount of energy required to ejercted electron from a most surface .According to Einstein
Maximum kinetic energy of ejected electron = Aborbed energy - Work function
12mv2max=h(v)−h(vn)=hv[1λ−01λn]
Where vn and λ0 are thereshold frequency and threshold wavelength respectively
Sopping potential : it is the miximum potential at which the photoelectric current becomes zero if V0 is the stopping potential eV0=h(v−v0)
The stopping potential as a function on electron frtequency is plotted for two photoelectric surface A abd B The graph show that the work function of A is
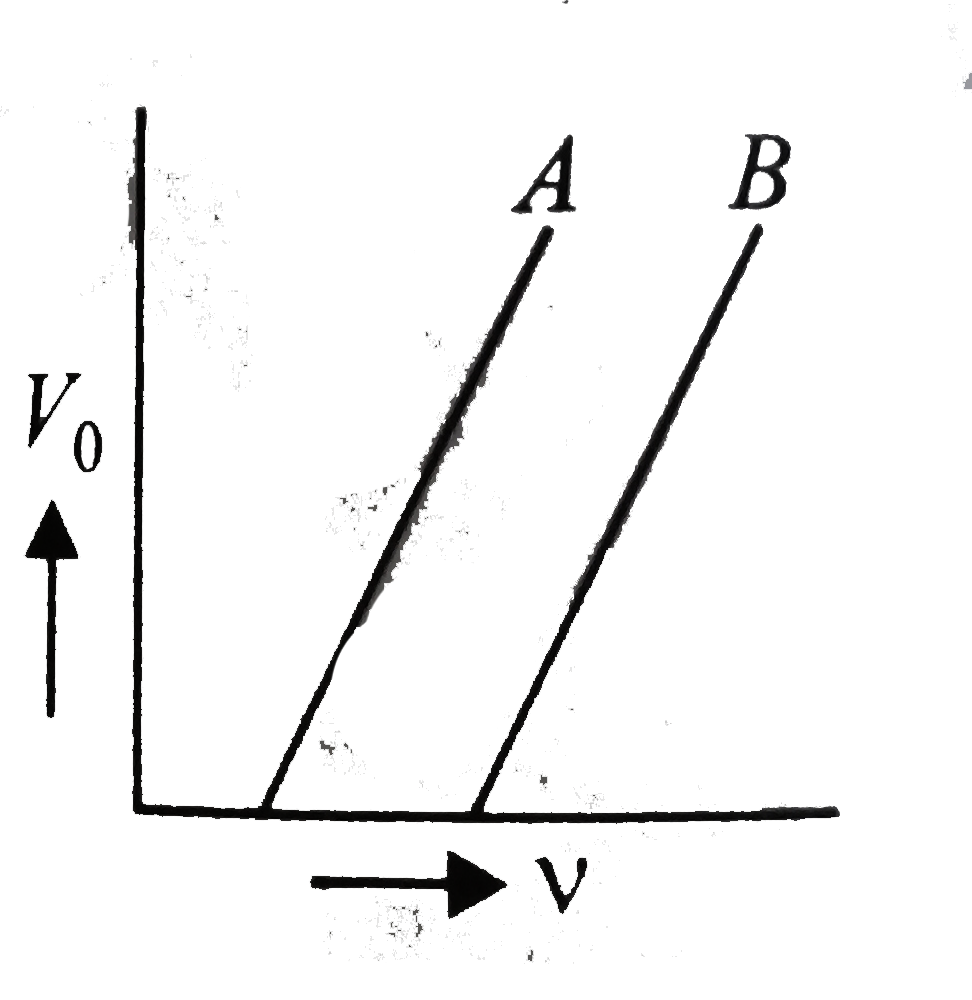 AGreater than that of BBSmaller than that of BCSame as that of BDSuch that no comparison can be done from given graph
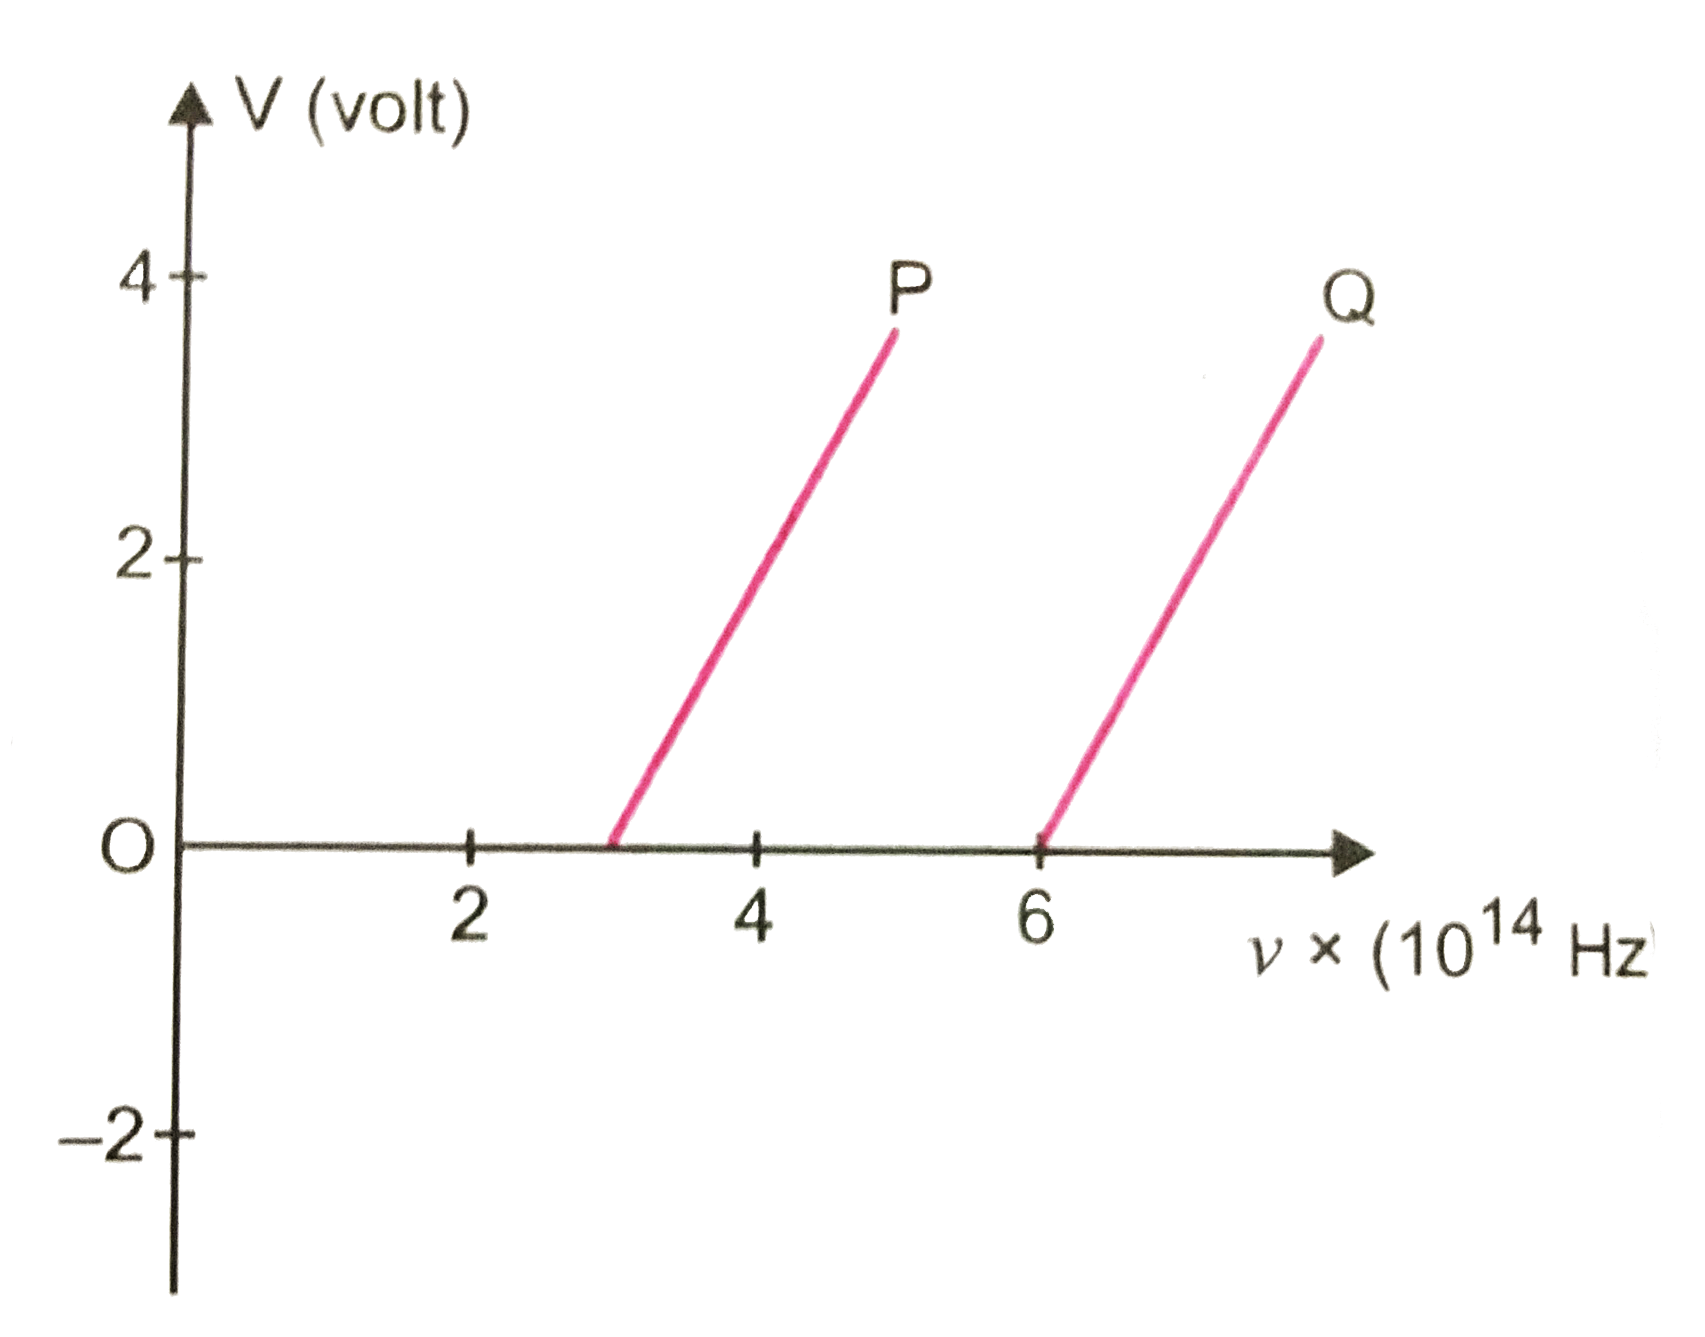
In the study of a photoelectric effect the graph between the stopping potential V and frequency v of the incident radiation on two different metals P and Q is shown in fig.
(i) which one of two metals have higher threshold frequency
(ii) Determine the work function of the metal which has greater value
(iii) Find the maximum kinetic energy of electron emitted by light of frequency 8×10¹⁴Hz for this metal.
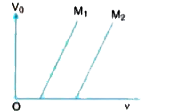
View SolutionThe variation of the stopping potential (V0) with the frequency (v) of the light incident on two different photosensitive surfaces M1andM2 is shown in the figure. Identify the surfaces which has greater value of the work function.
View SolutionIn an experiment on photoelectric effect, a student plots stopping potential V0 against reciprocal of the wavelength λ of the incident light for two different metals A and B. These are shown in the figure
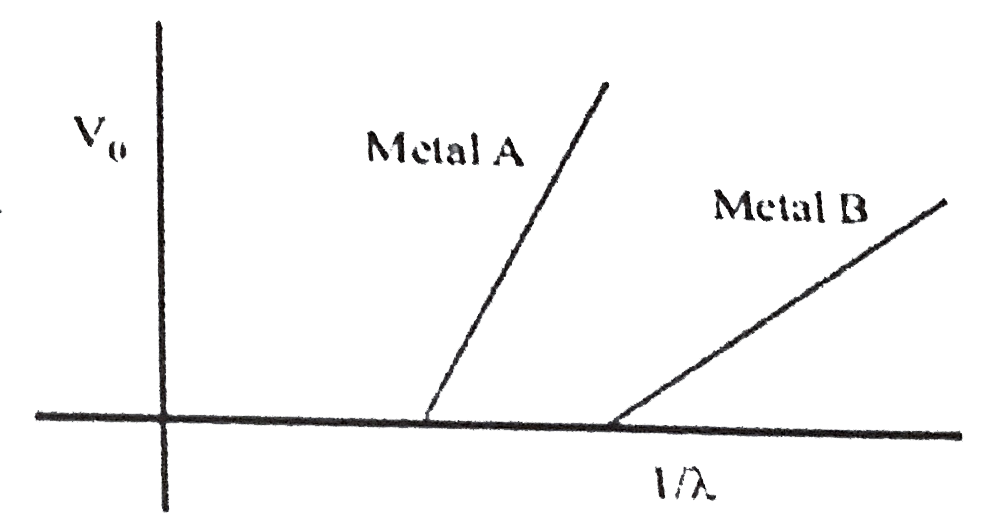
Looking at the graphs, you can most appropriately say that :
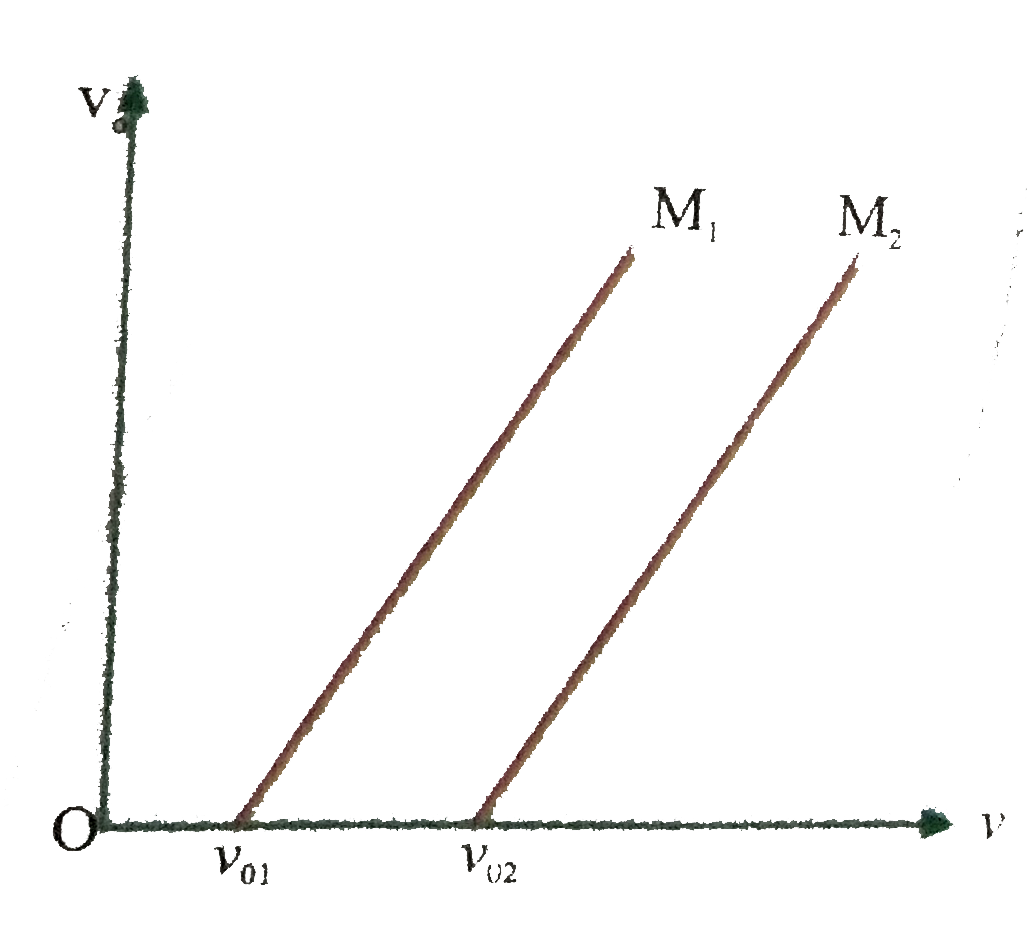
View SolutionFigure show the variation of the stopping potential (V0) with the frequency (v) of the incident radiations for two different photosensitive matererial M1 and M2 What are the values of work functions for M1 and M2 respectively
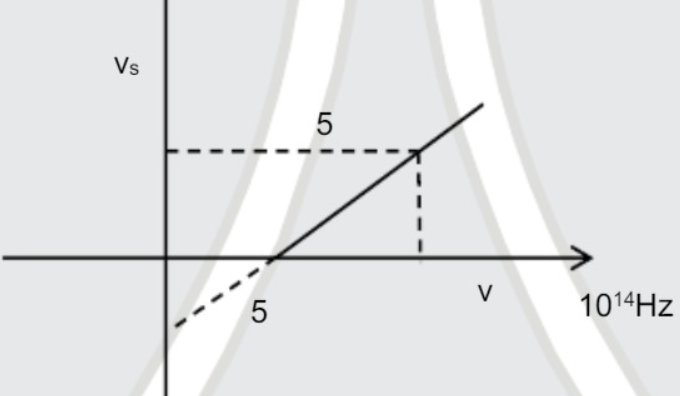
View SolutionGraph between stopping potential and frequency of light as shown find the work function
View Solution
