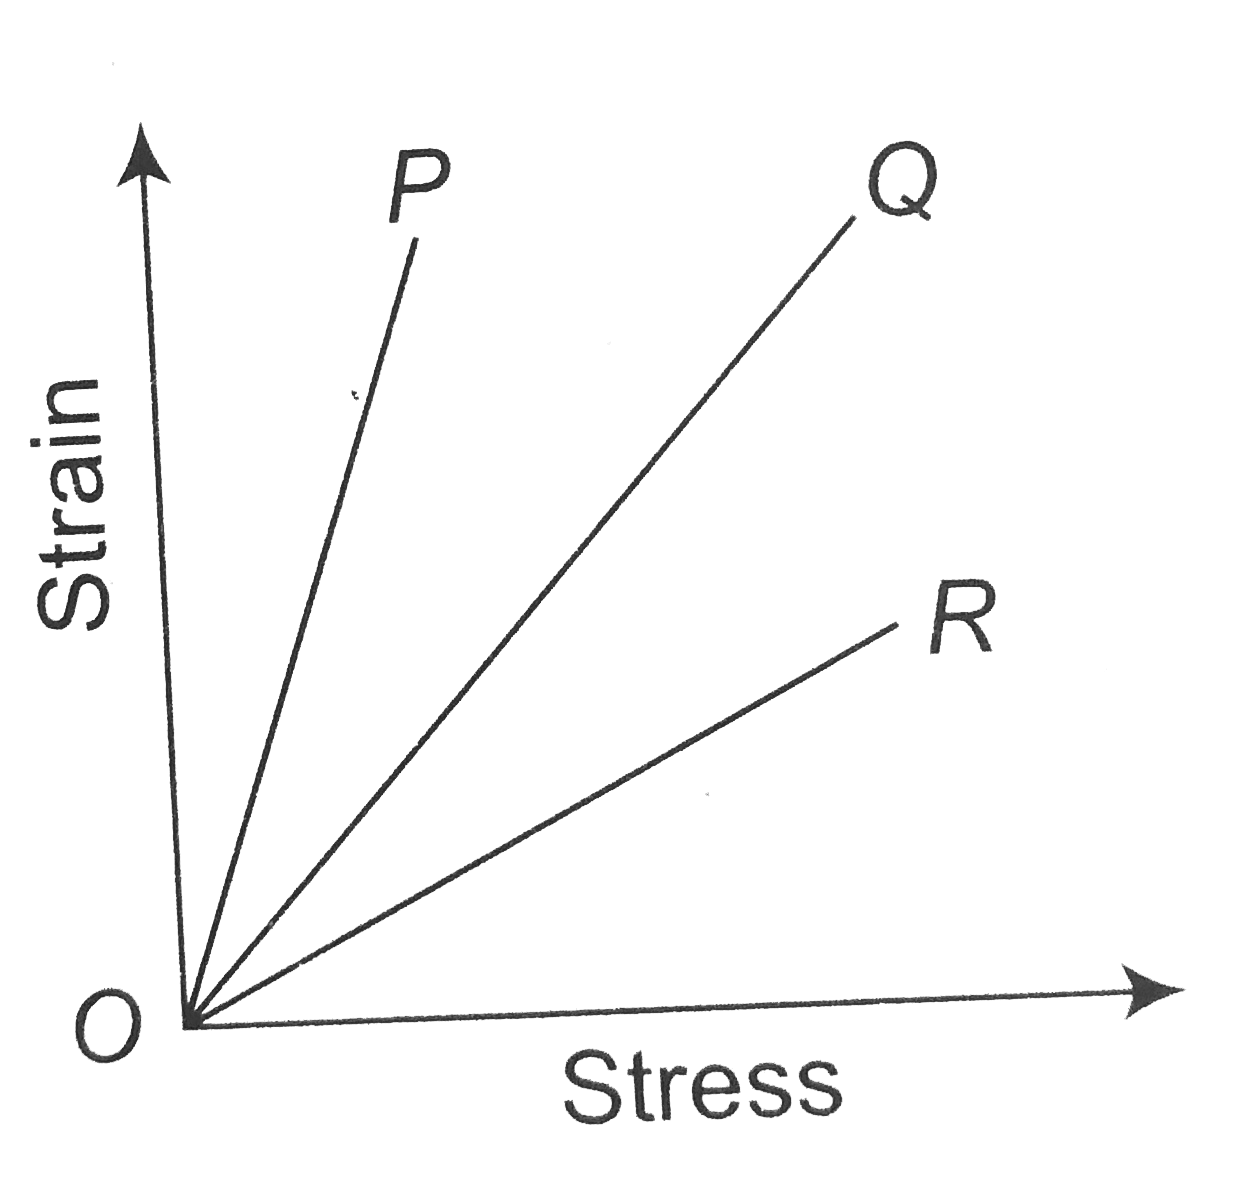
The strain stress curves of three wires of different materials are shown in the figure. P, Q and R are the elastic limits of the wires. The figure shown that
The correct Answer is:D
(d) As stress is shown on X-axis and strain on Y-axis.
So, we can say that Y=cotθ=1tanθ=1slope
So, elasticity of wire P is minimum and of wire R is maximum.
Topper's Solved these Questions
- ELASTICITYBOOK - DC PANDEY ENGLISHCHAPTER - ELASTICITYEXERCISE - Match the columns
4 Videos
- ELASTICITYBOOK - DC PANDEY ENGLISHCHAPTER - ELASTICITYEXERCISE - Medical entrances s gallery
21 Videos
- ELASTICITYBOOK - DC PANDEY ENGLISHCHAPTER - ELASTICITYEXERCISE - Check point 12.3
15 Videos
- CURRENT ELECTRICITYBOOK - DC PANDEY ENGLISHCHAPTER - CURRENT ELECTRICITYEXERCISE - All Questions
469 Videos
- ELECTROSTATICSBOOK - DC PANDEY ENGLISHCHAPTER - ELECTROSTATICSEXERCISE - Integer
17 Videos
Similar Questions
The stress versus strain graphs for wires of two materials A and B are as shown in the figure. If YAandYB are the younng's moduli of the materials, then
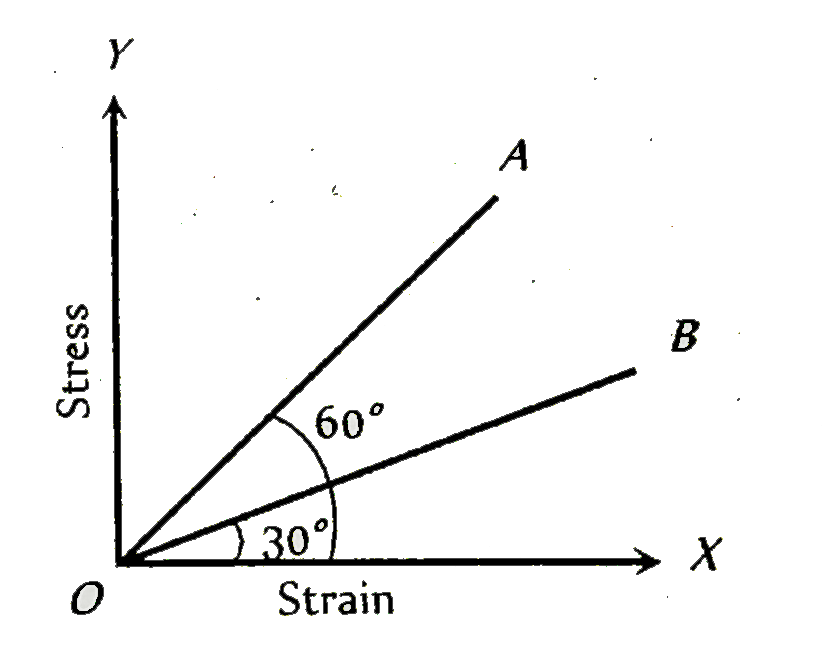
View SolutionThe stress versus strain graphs for wires of two materials A and B are as shown in the figure. If YAandYB are the younng's moduli of the materials, then

View Solution
Knowledge Check
A wire is placed between the poles of twofixed bar magnets as shown in the figure. A small current in the wire is into the plane of the paper. The direction of the magnetic force on the wire is
 A↑B↓C→D←
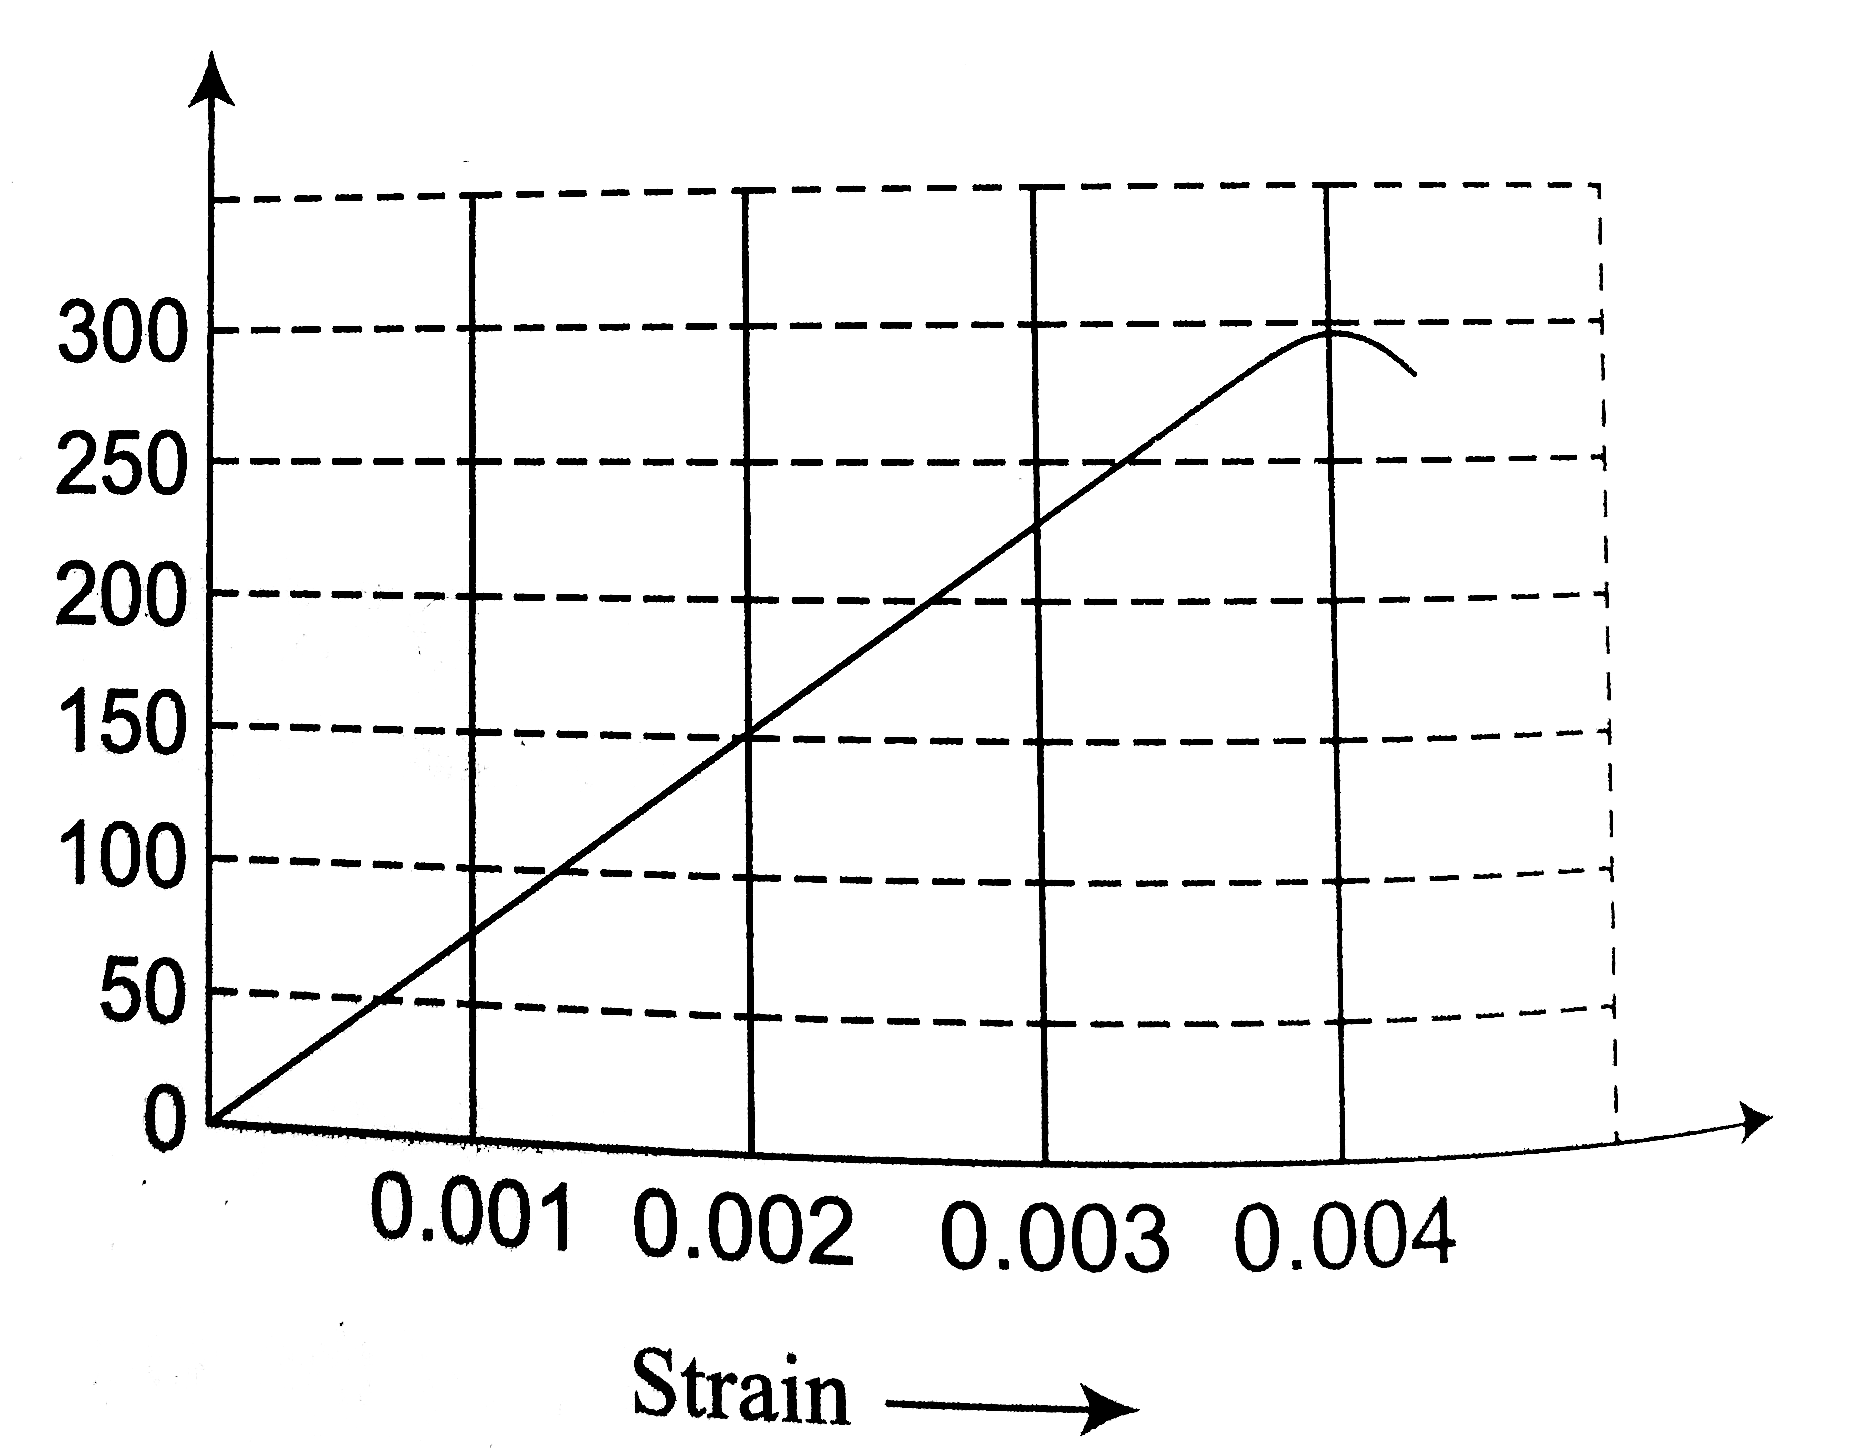
Figure shows the strain stress curve for a given material. The Young's modulus of the material isA5×109Nm−2B5×1010Nm−2C7.5×109Nm−2D7.5×1010Nm−2
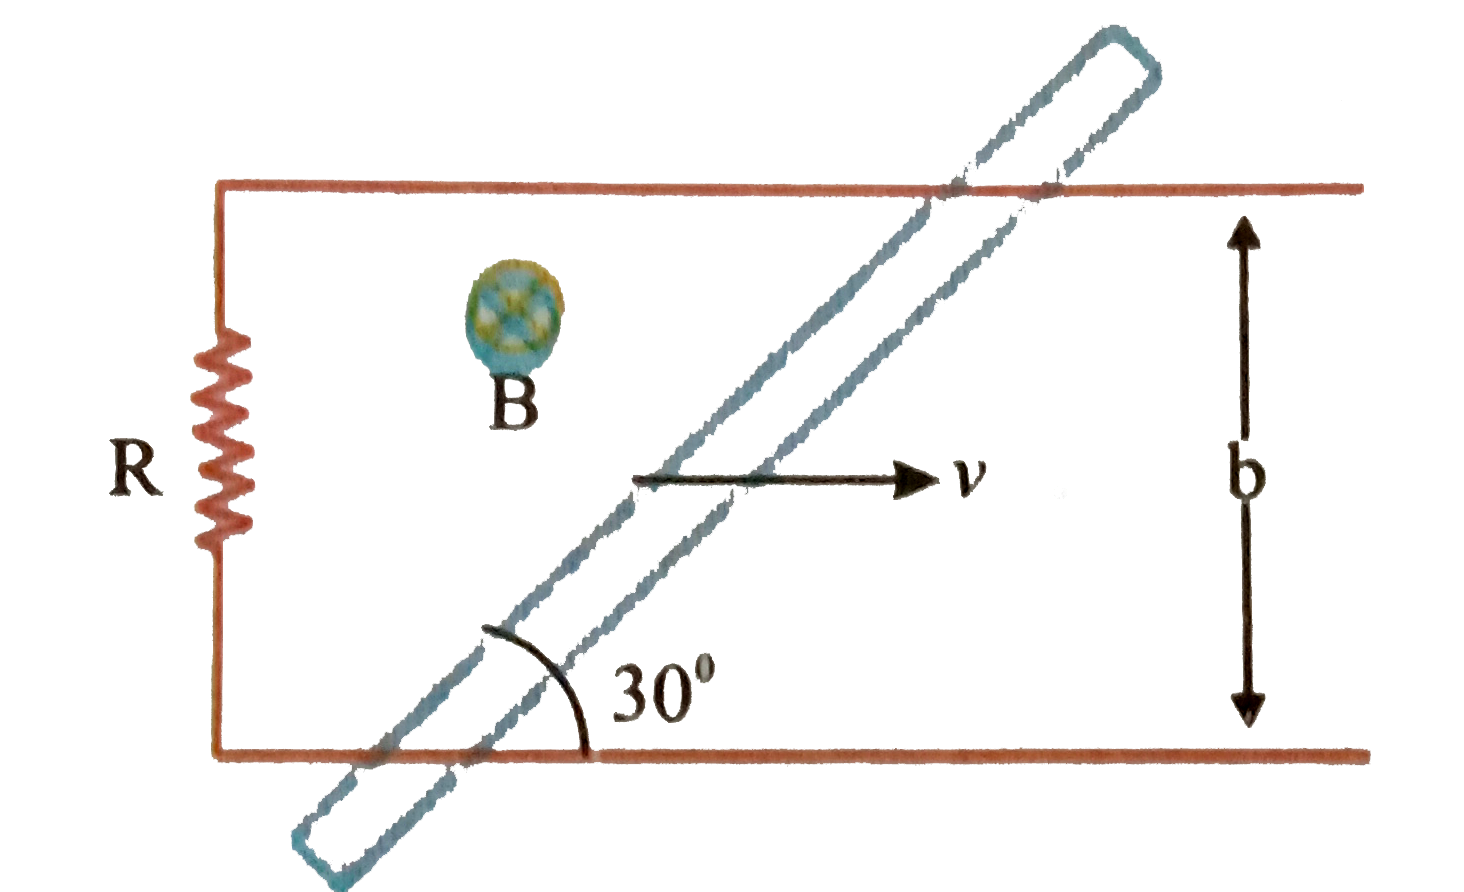
A wire is sliding as shown in Figure. The angle between the acceleration and the velocity of the wire is
View SolutionIf linear charge density of a wire as shown in the figure is λ
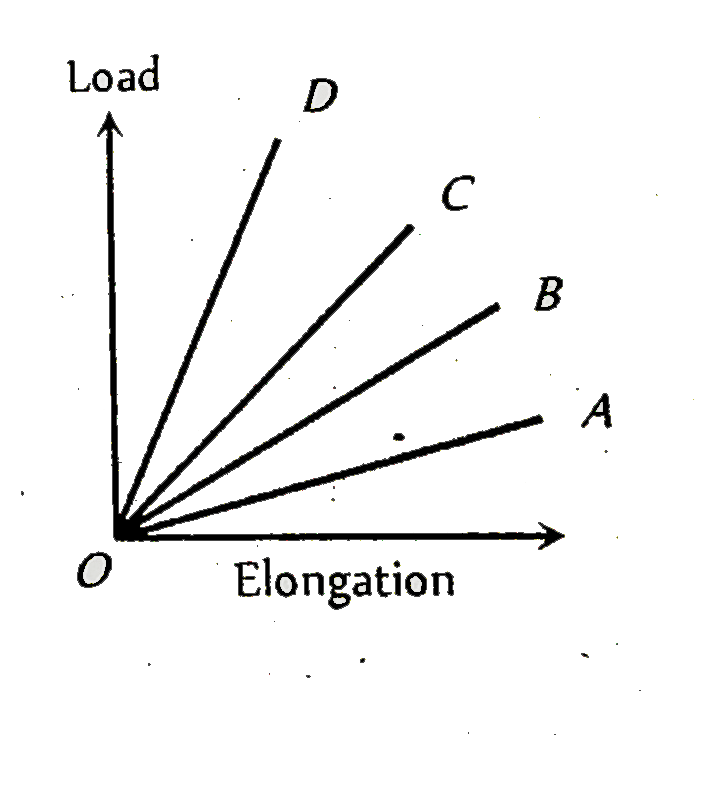
View SolutionThe load versus elongation graph for four wires of the same material is shown in the figure. The thickest wire is represented by
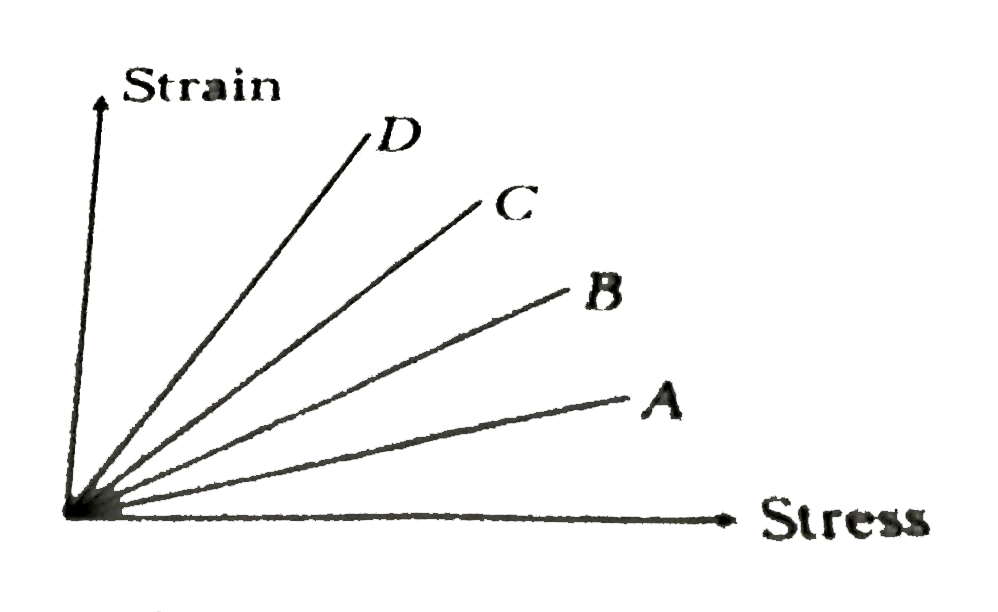
View SolutionStress-strain curve for four metals are shown in figure. The maximum Young's modulus of elasticity is for metal
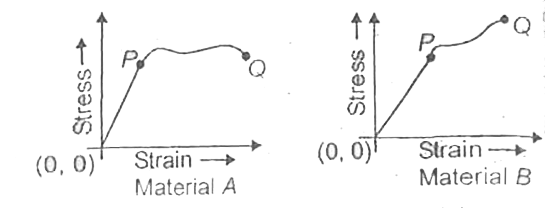
View SolutionThe stress-strain graphs for two materials A and are shown in figure. The graphs are drawn to the same scale. Select the correct statement
View SolutionA point mass m is suspended usin two wires of different material as shown in the figure. If corss-section of wire-1 and sore-2 are 3mm2and√3mm2 respectively, which of the following is correct?

View Solution
