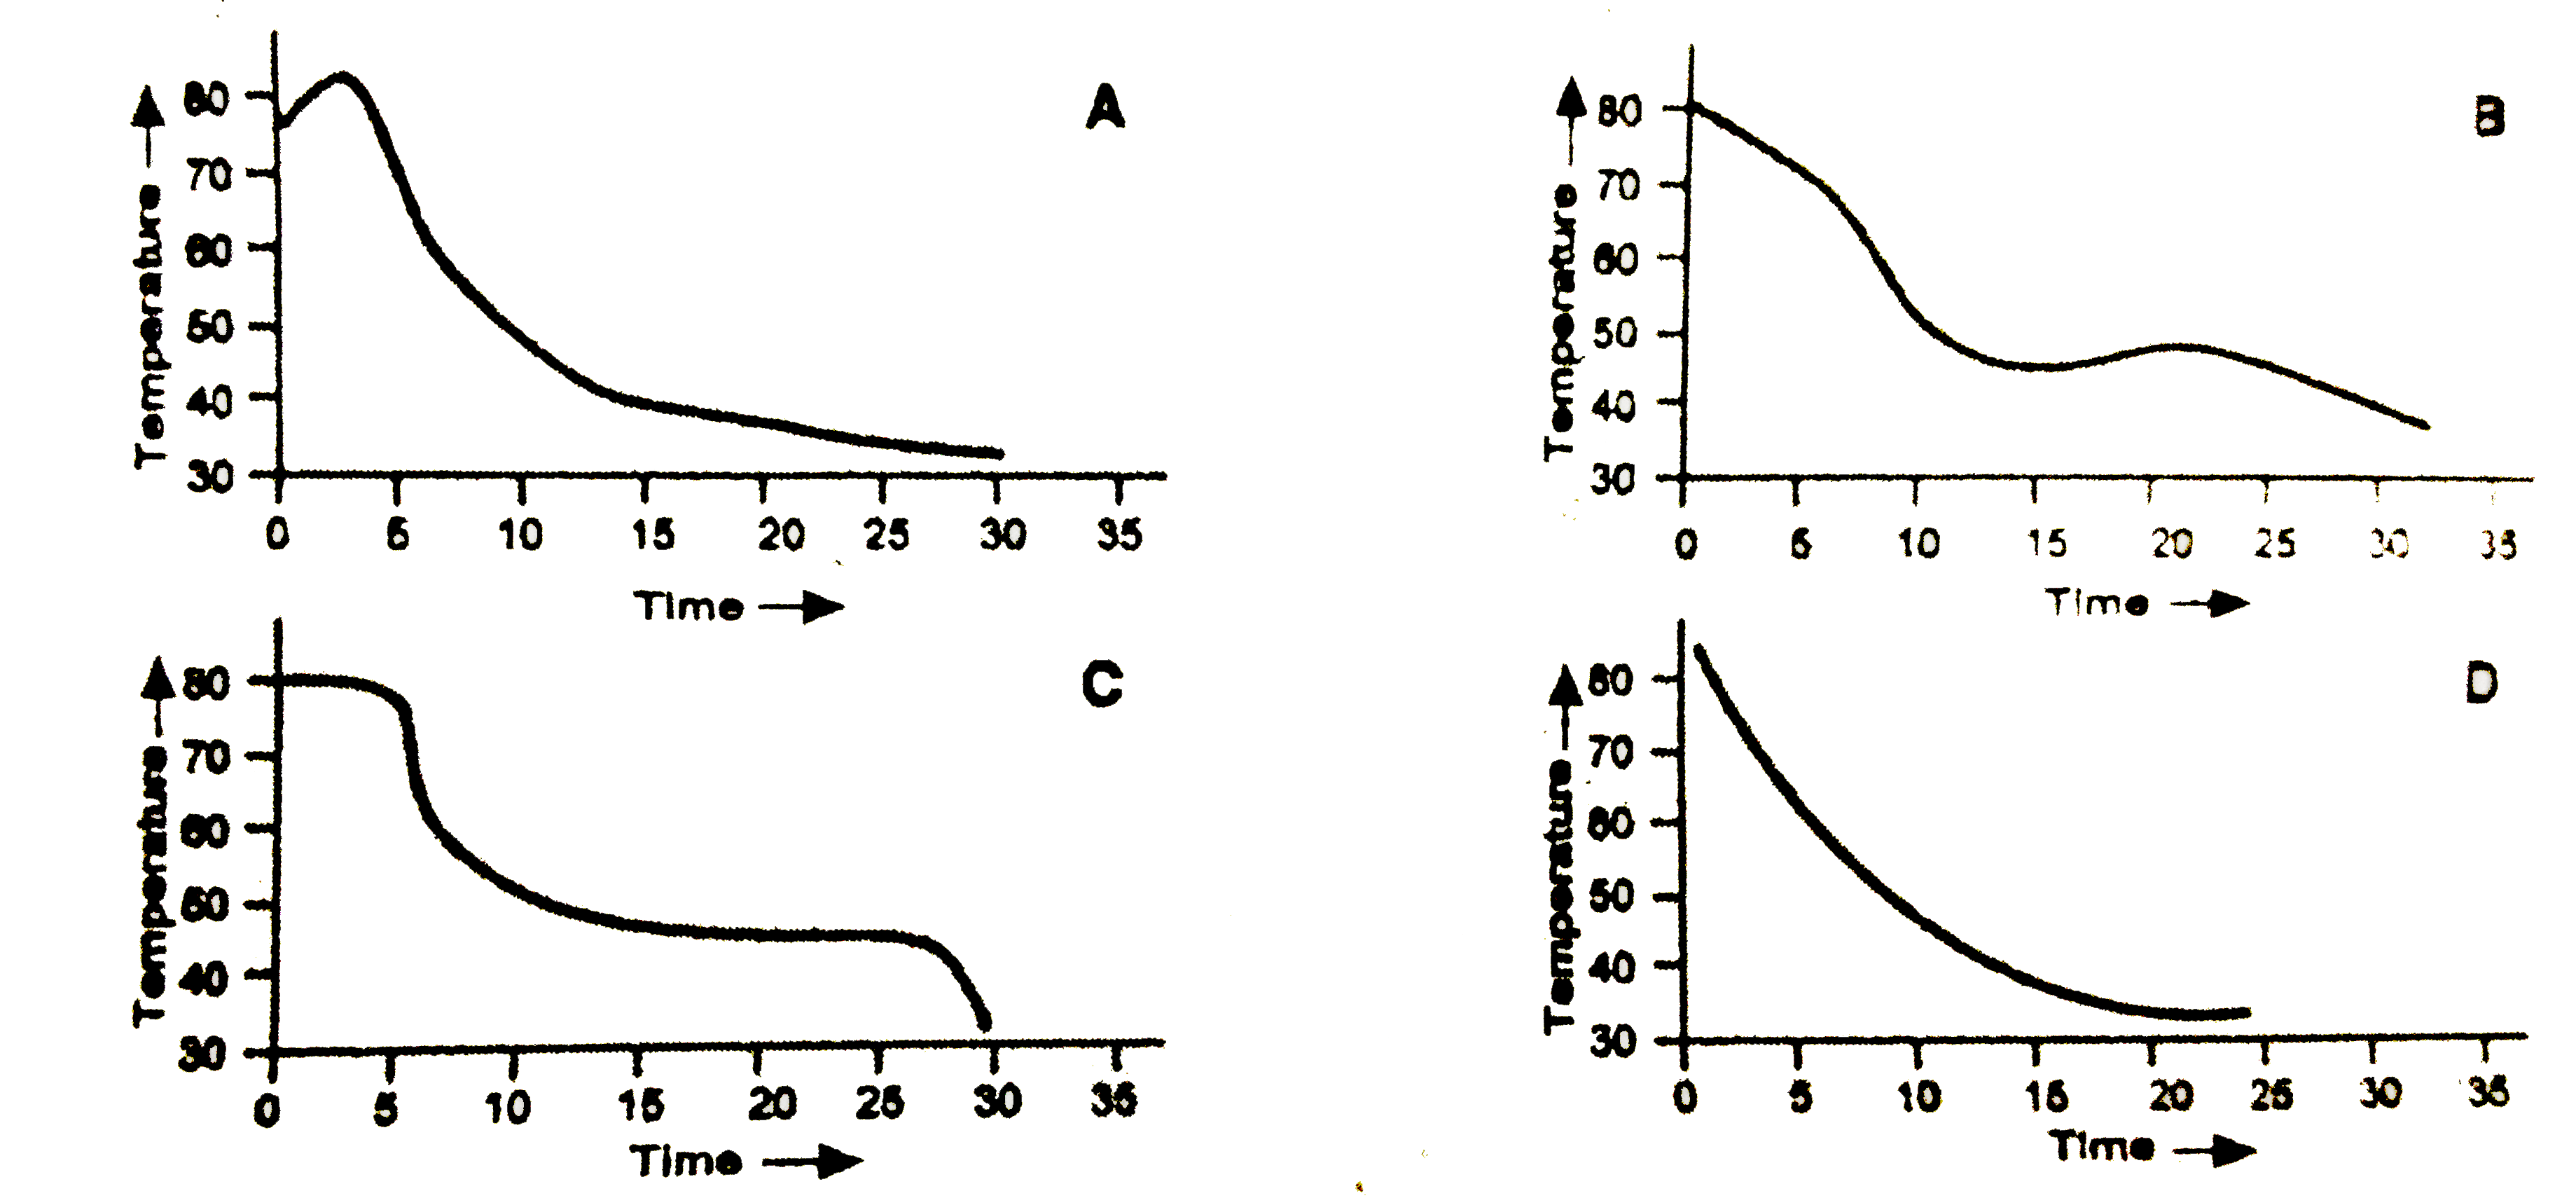
The temperature-time graphs obtained in Newton's cooling experiment is
A
a straight line with positive slope
B
a straight line with negative slope
C
a curve with positive slope
D
a curve with negative
Text Solution
The correct Answer is:D
|
Topper's Solved these Questions
- KINETIC THEORY OF GASES & RADIATION BOOK - NIKITA PUBLICATIONCHAPTER - KINETIC THEORY OF GASES & RADIATION EXERCISE - MCQs (Question Given in MHT-CET)
79 Videos
- KINETIC THEORY OF GASES & RADIATION BOOK - NIKITA PUBLICATIONCHAPTER - KINETIC THEORY OF GASES & RADIATION EXERCISE - MCQs (Stefans Law of Black Body Radiation)
52 Videos
- INTERFERENCE AND DIFFRACTIONBOOK - NIKITA PUBLICATIONCHAPTER - INTERFERENCE AND DIFFRACTIONEXERCISE - MULTPLE CHOICE QUESTIONS
333 Videos
- MAGNETIC EFFECT OF ELECTRIC CURRENTBOOK - NIKITA PUBLICATIONCHAPTER - MAGNETIC EFFECT OF ELECTRIC CURRENTEXERCISE - MCQs (Sensitivity and accuracy of M.C.G.)
1 Videos
Similar Questions
Knowledge Check
Following are the temperature - time graphs obtained by 4 students in this experiment which one is likely to be correct ?
A B
B C
C D
D
The temperature-time graph obtained when hot water is allowed to cool resembles the graph given in one of the following figures. The correct figure is:
 AABBCCDD
The unit of Newton's cooling constant is
Acals×∘CBcal / sCcal∘CDcal×s×∘C
The unit of Newton's cooling constant is
View SolutionNewton's law of cooling refers to
View SolutionWhile doing an experiment on plotting the temperaure-time graph of hot water as it cools, we can get a good graph:
View SolutionNewton's law of cooling is relevant with
View SolutionNewton's law of cooling is relevant with
View Solution
