The two ends of a uniform conductor are joined to a cell of e.m.f. E and some internal resistance. Starting from the midpoint P of the conductor, we move in the direction of current and return to P. The potential V at every point on the path is plotted against the distance covered (x). which of the following graphs best represent the resulting curve ?
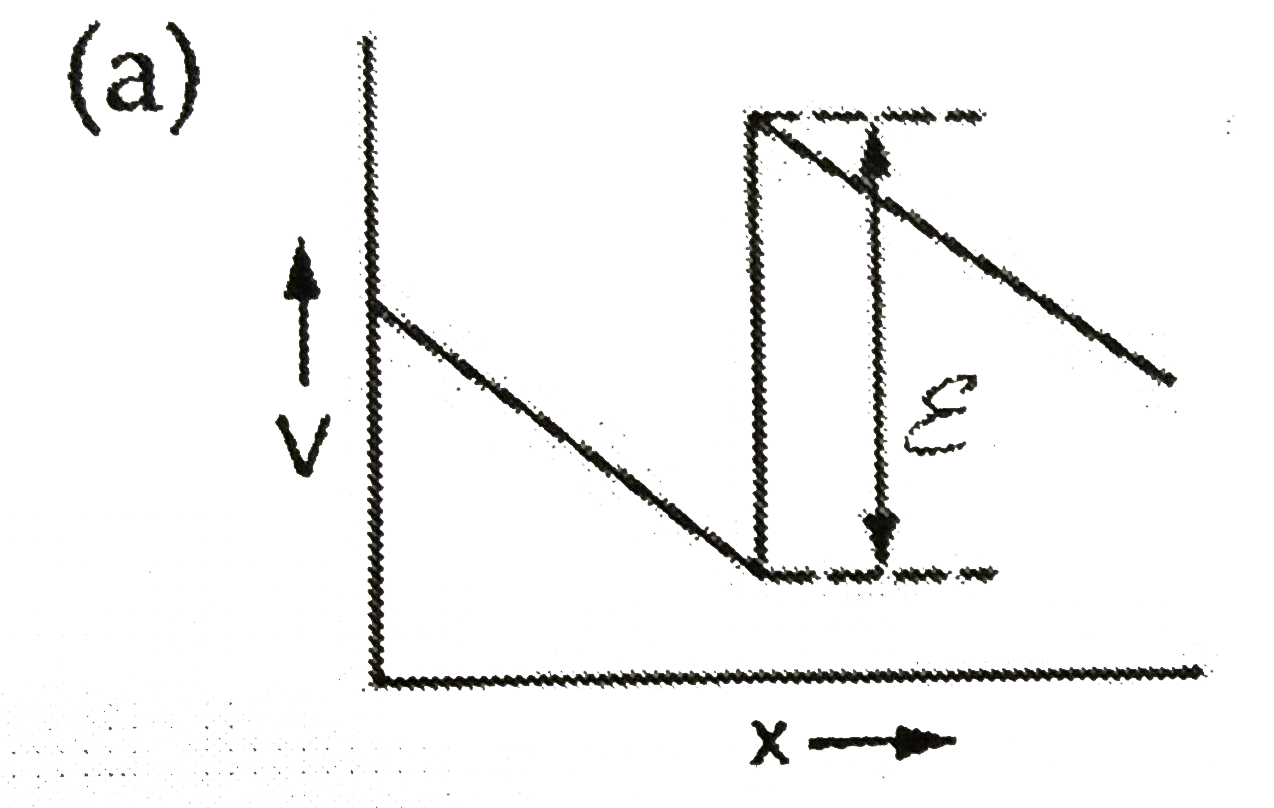
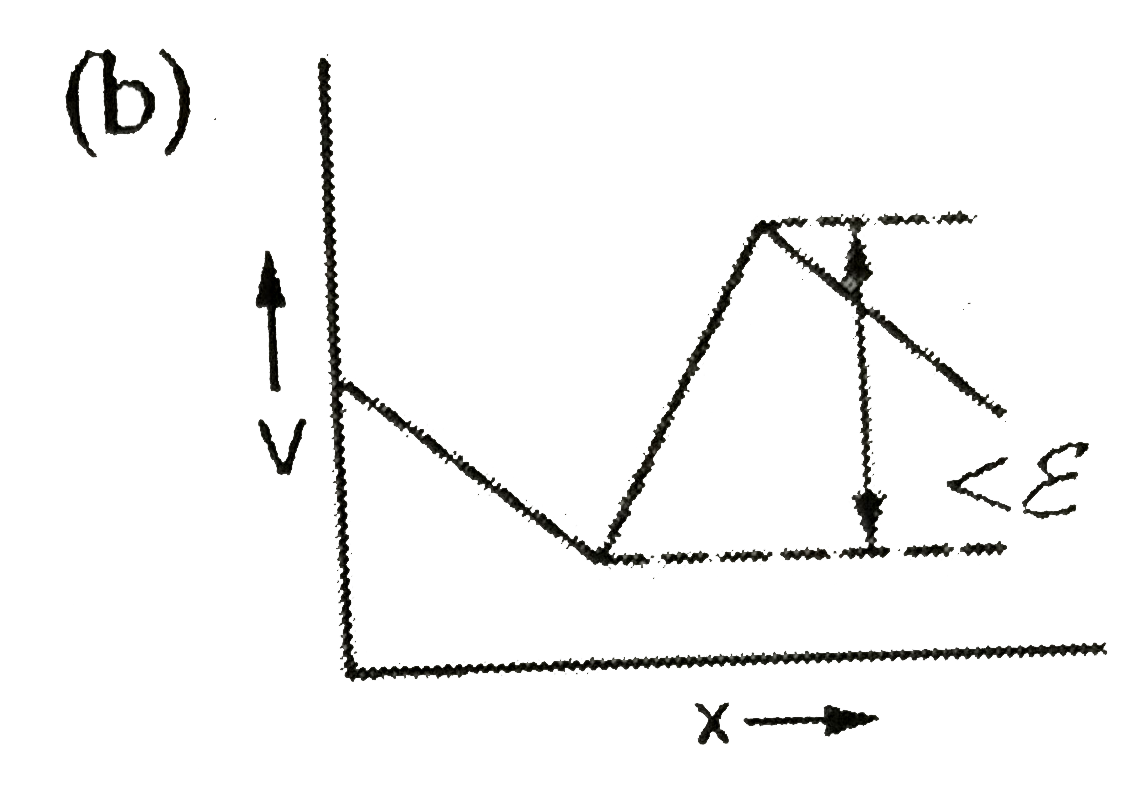
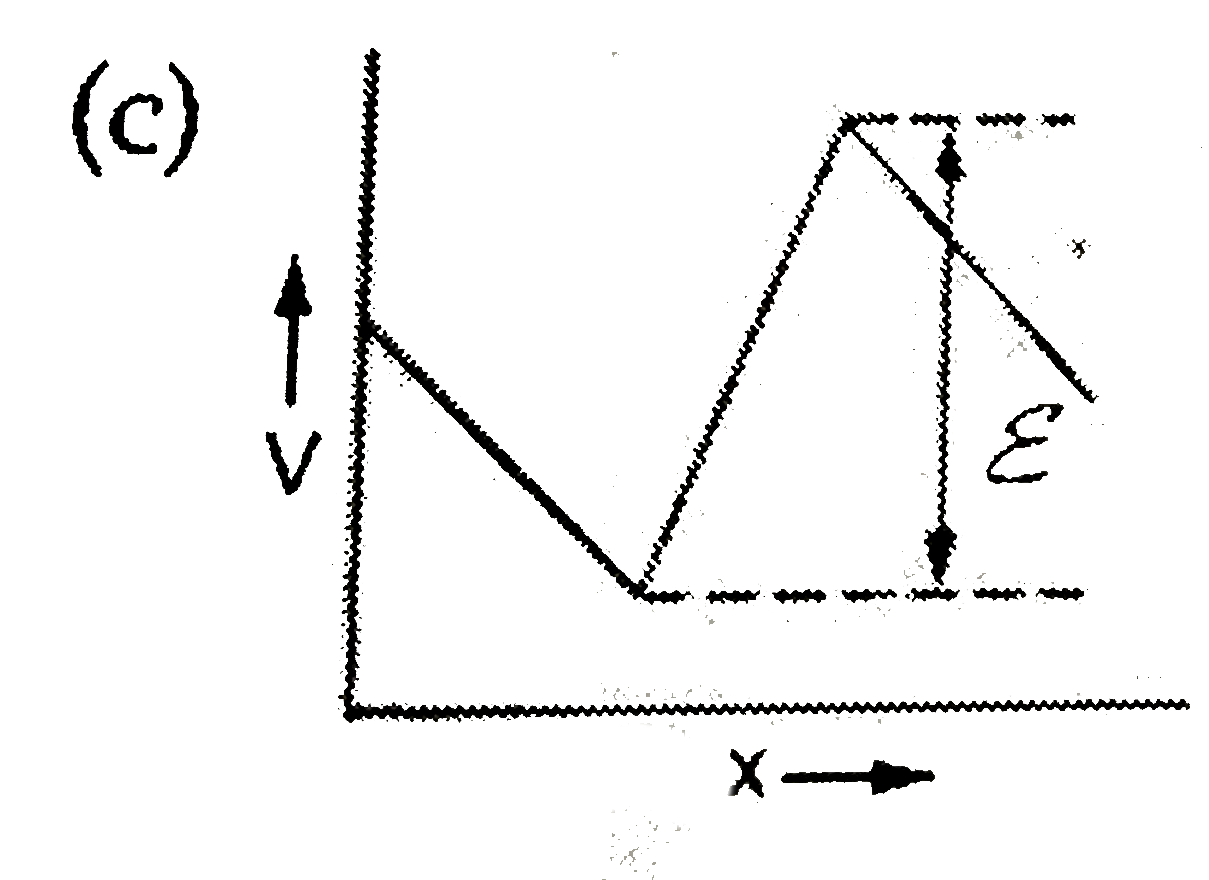
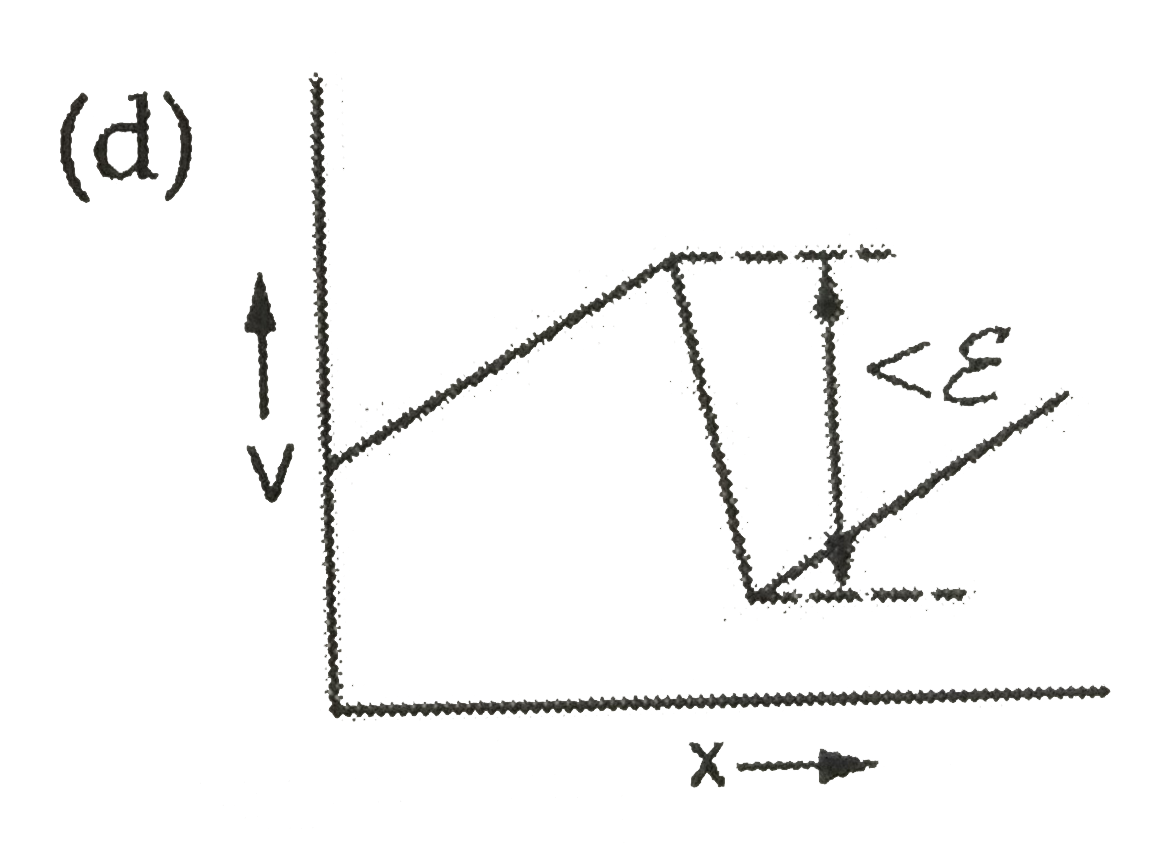
The correct Answer is:B
Step by step video, text & image solution for The two ends of a uniform conductor are joined to a cell of e.m.f. E and some internal resistance. Starting from the midpoint P of the conductor, we move in the direction of current and return to P. The potential V at every point on the path is plotted against the distance covered (x). which of the following graphs best represent the resulting curve ? by Physics experts to help you in doubts & scoring excellent marks in Class 12 exams.
Updated on:21/07/2023Topper's Solved these Questions
Similar Questions
A battery of e.m.f. 2 V and internal resistance 2Ω is connected to an external resistance 8Ω. If the length of the conductor is 4 m, then potential gradient between the two ends of the wire is
View SolutionA current of two amperes is flowing through a cell of e.m.f. 5 volts and internal resistance 0.5 ohm from negative to positive electrode. If the potential of negative electrode is 10 V , the potential of positive electrode will be
View Solution
Knowledge Check
A thin, straight conductor lies along the axis of a hollow conductor of radius R. The two carry equal currents in the same direction. The magnetic field B is plotted against the distance r from the axis. Which of the following best represents the resulting curve?
A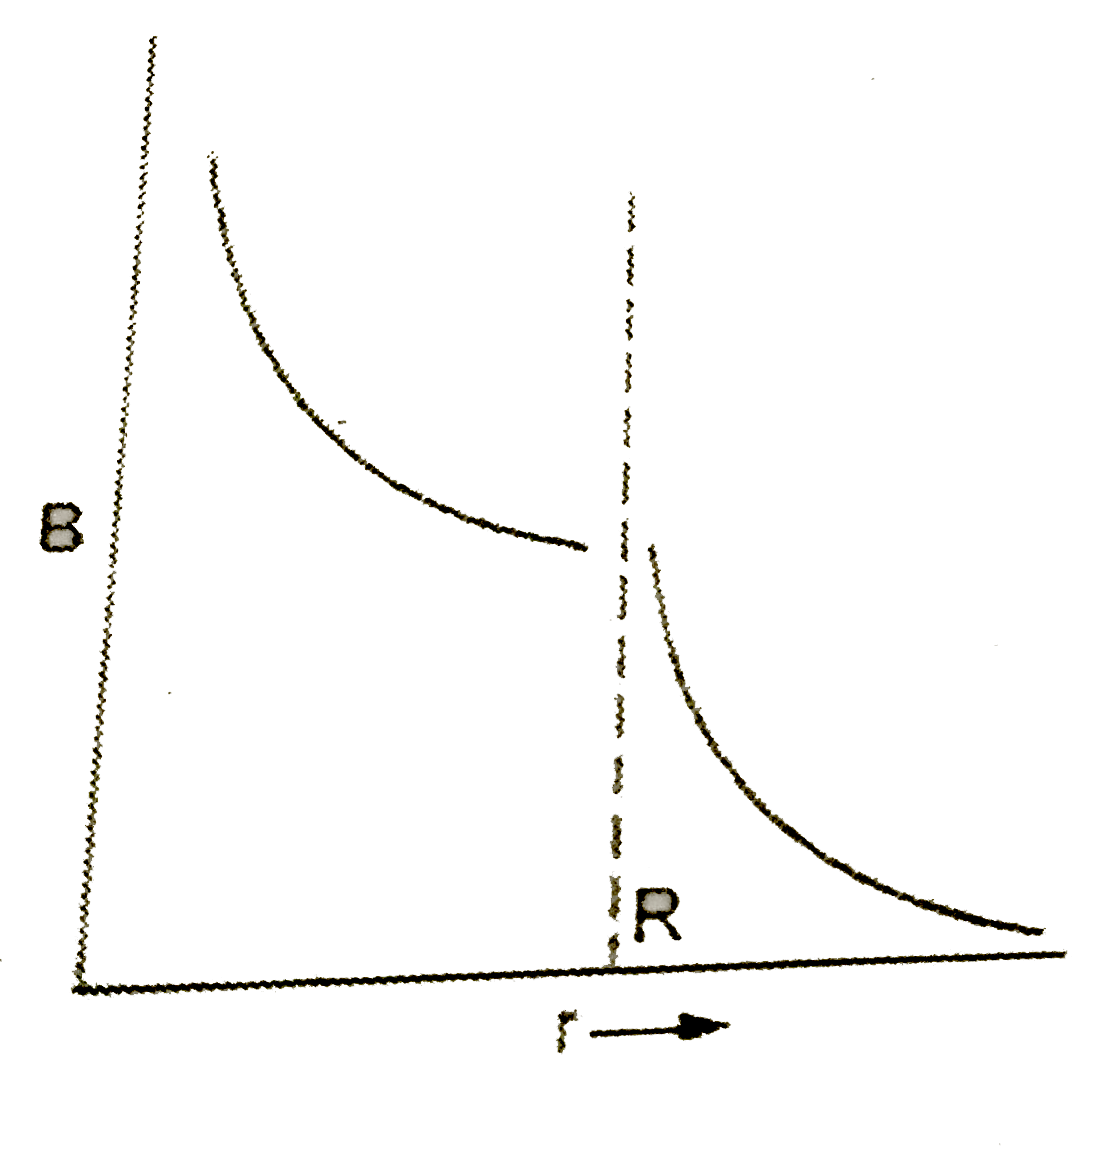 B
B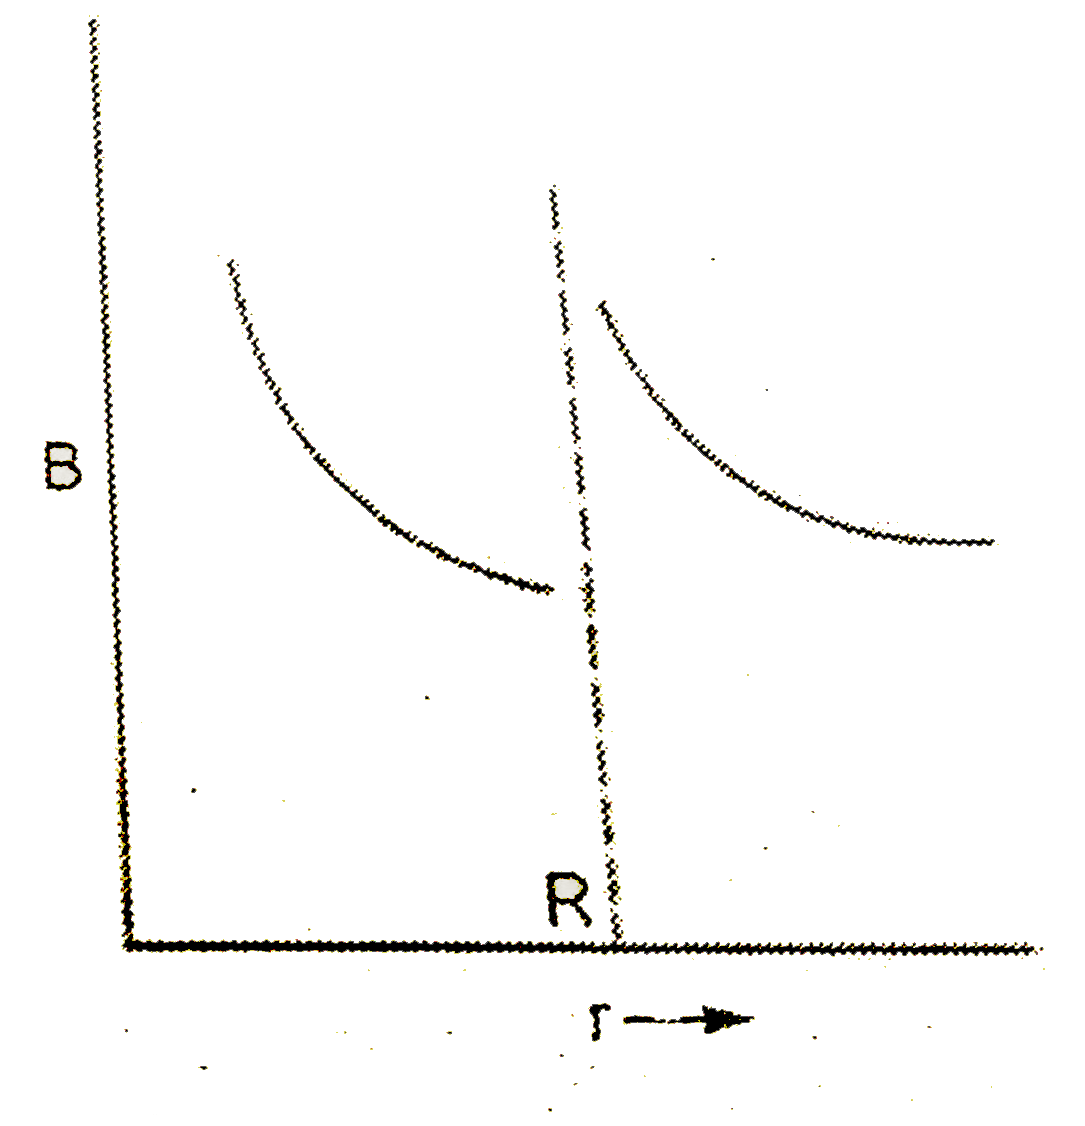 C
C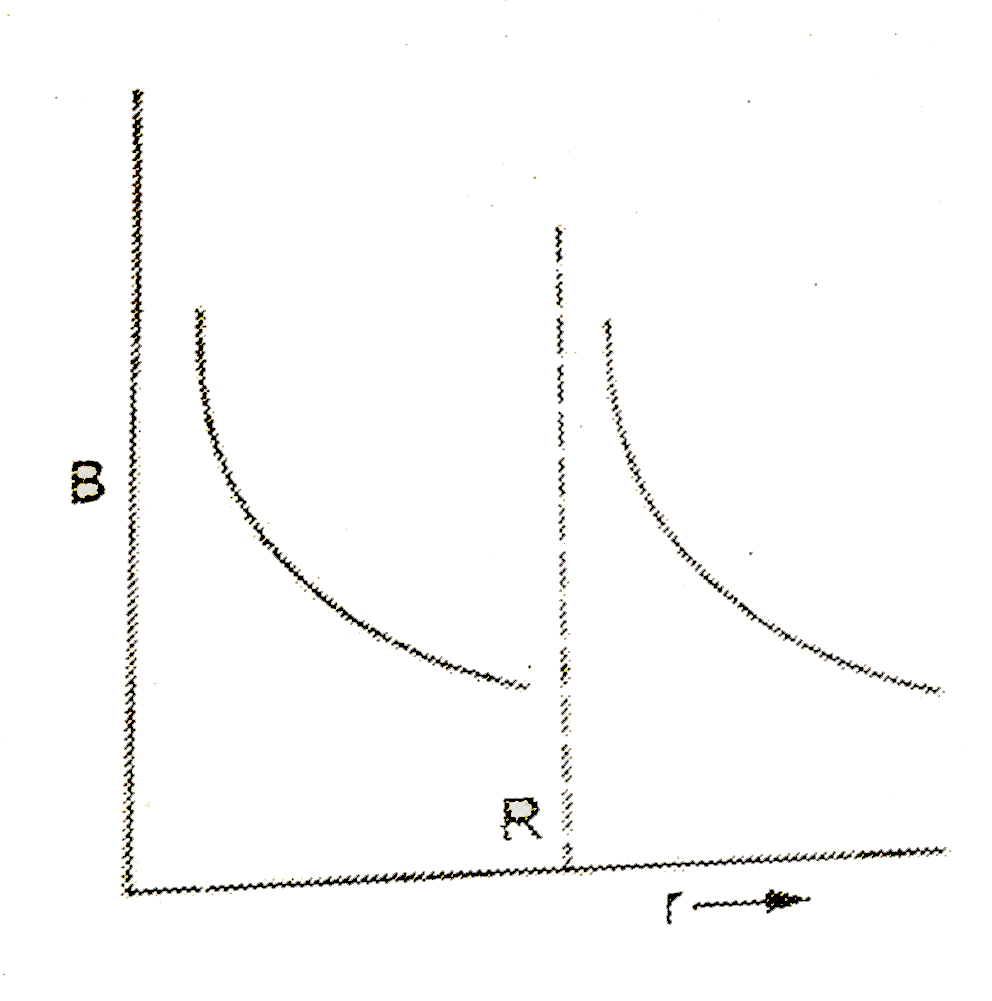 D
D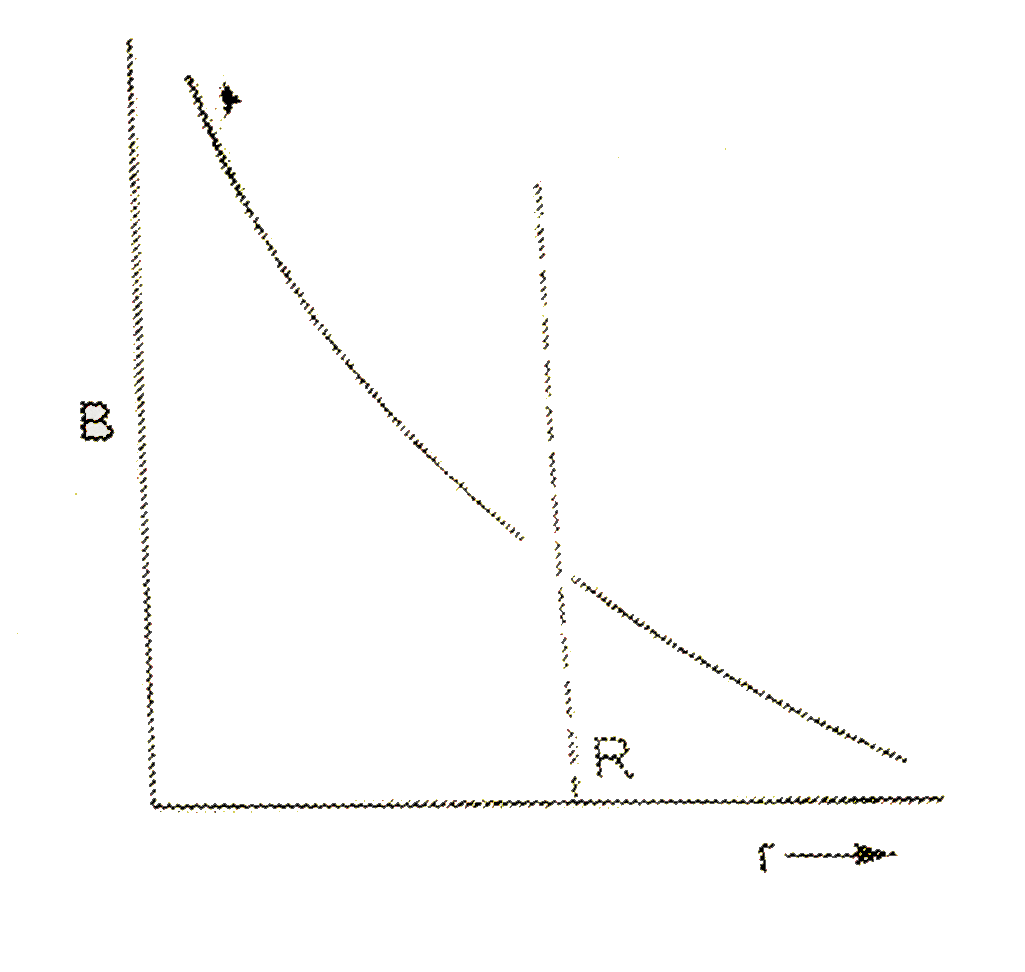
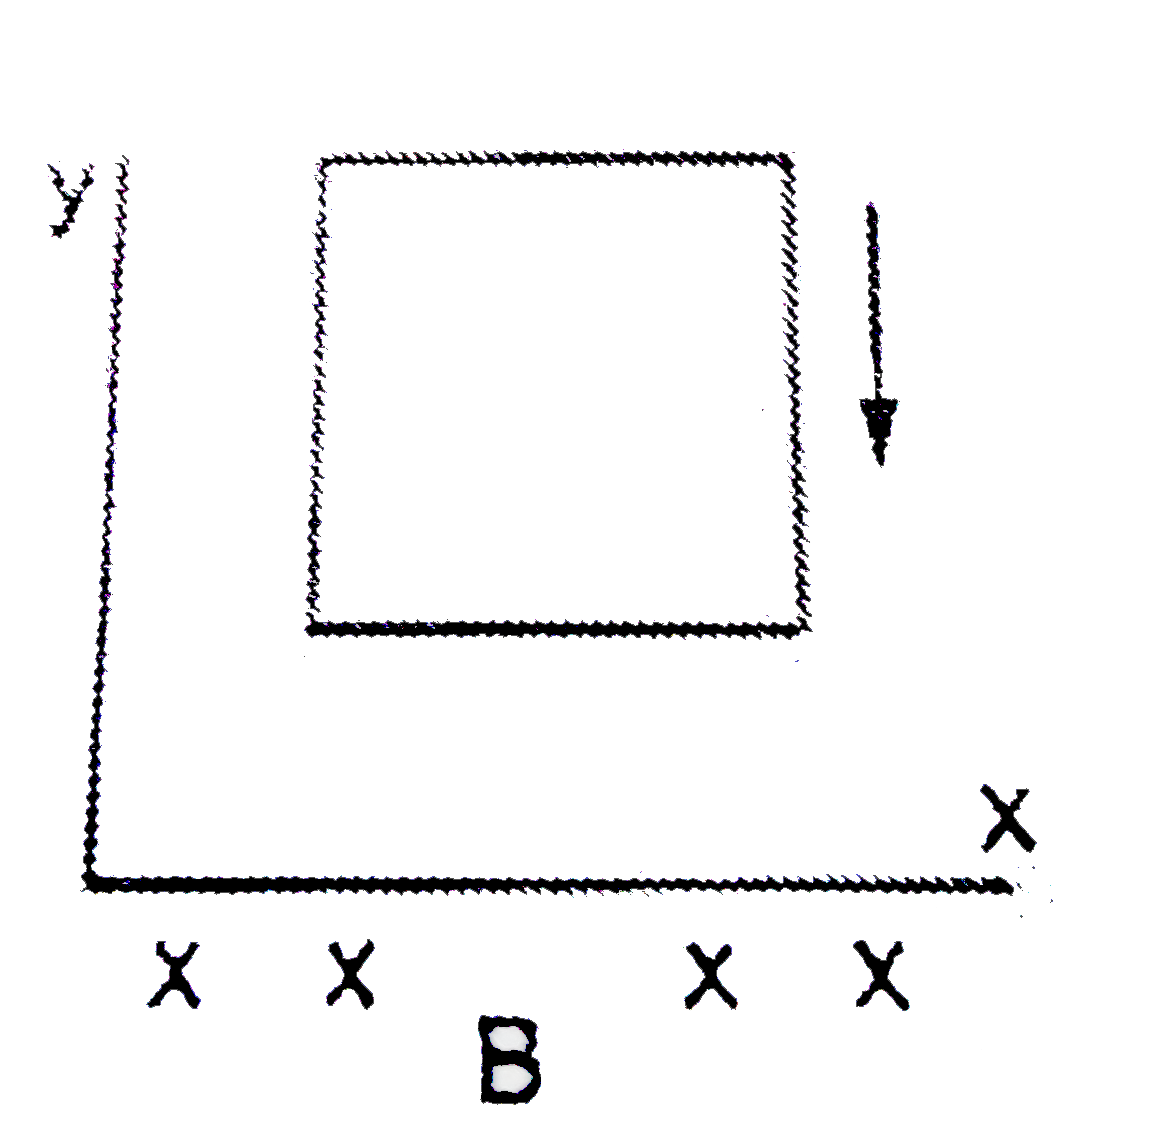
A square, conducting loop falls from rest in the xy-plane. There is a uniform magnetic field in the z-direction below the x-axis. The velocity v of the loop is plotted against time t. Which of the following best represents the resulting curveA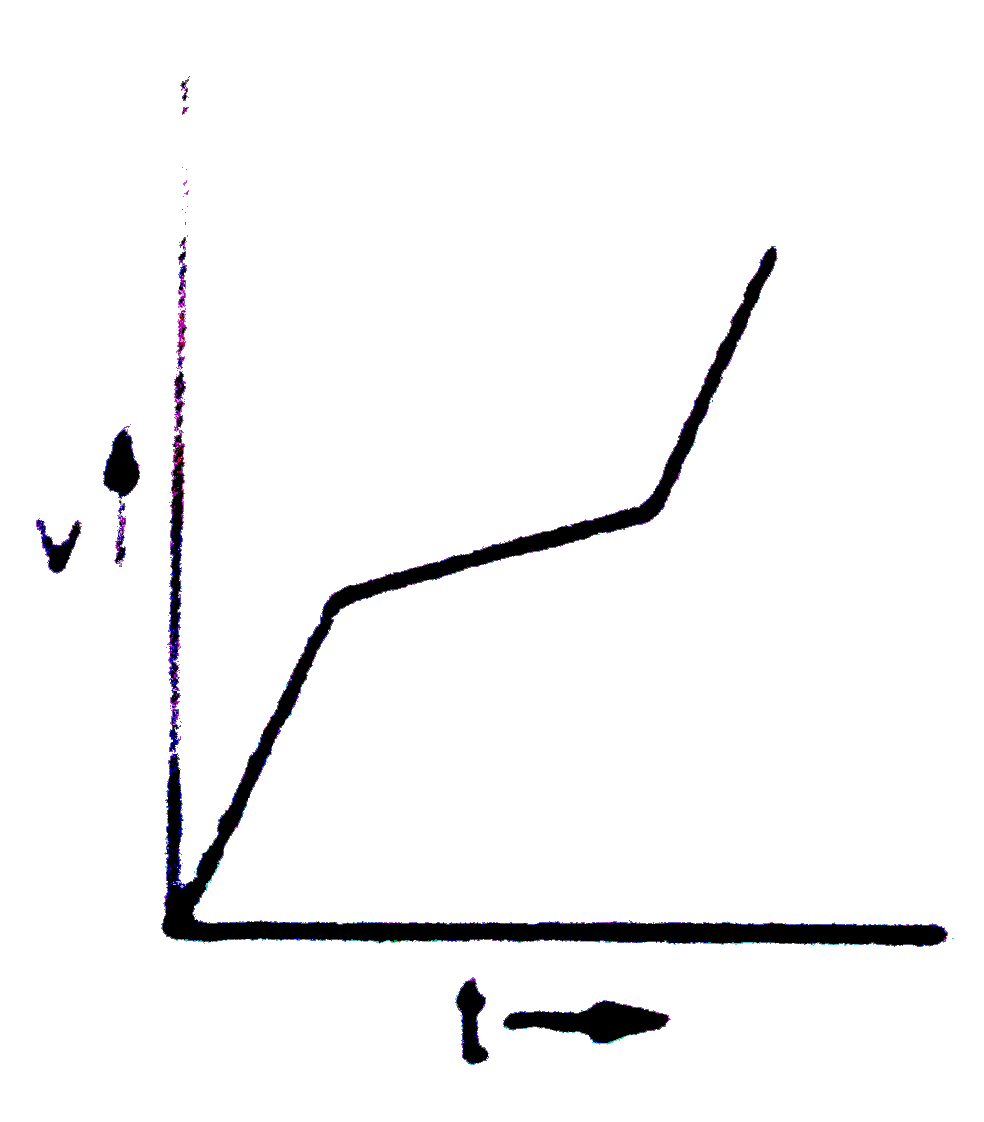 B
B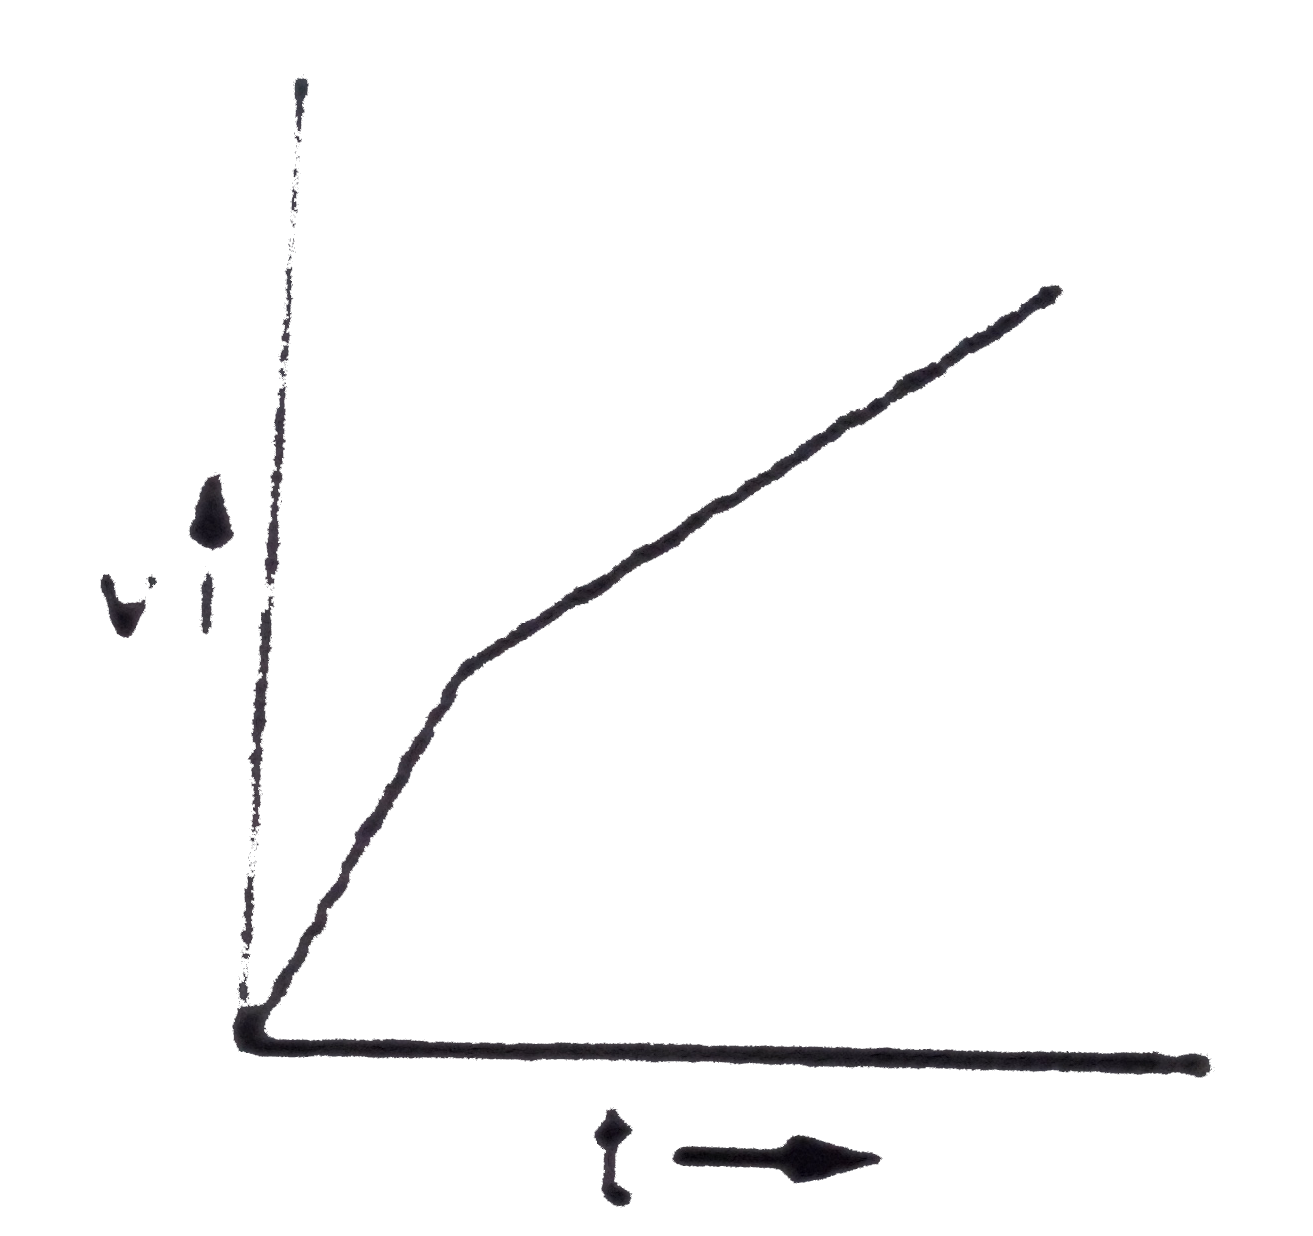 C
C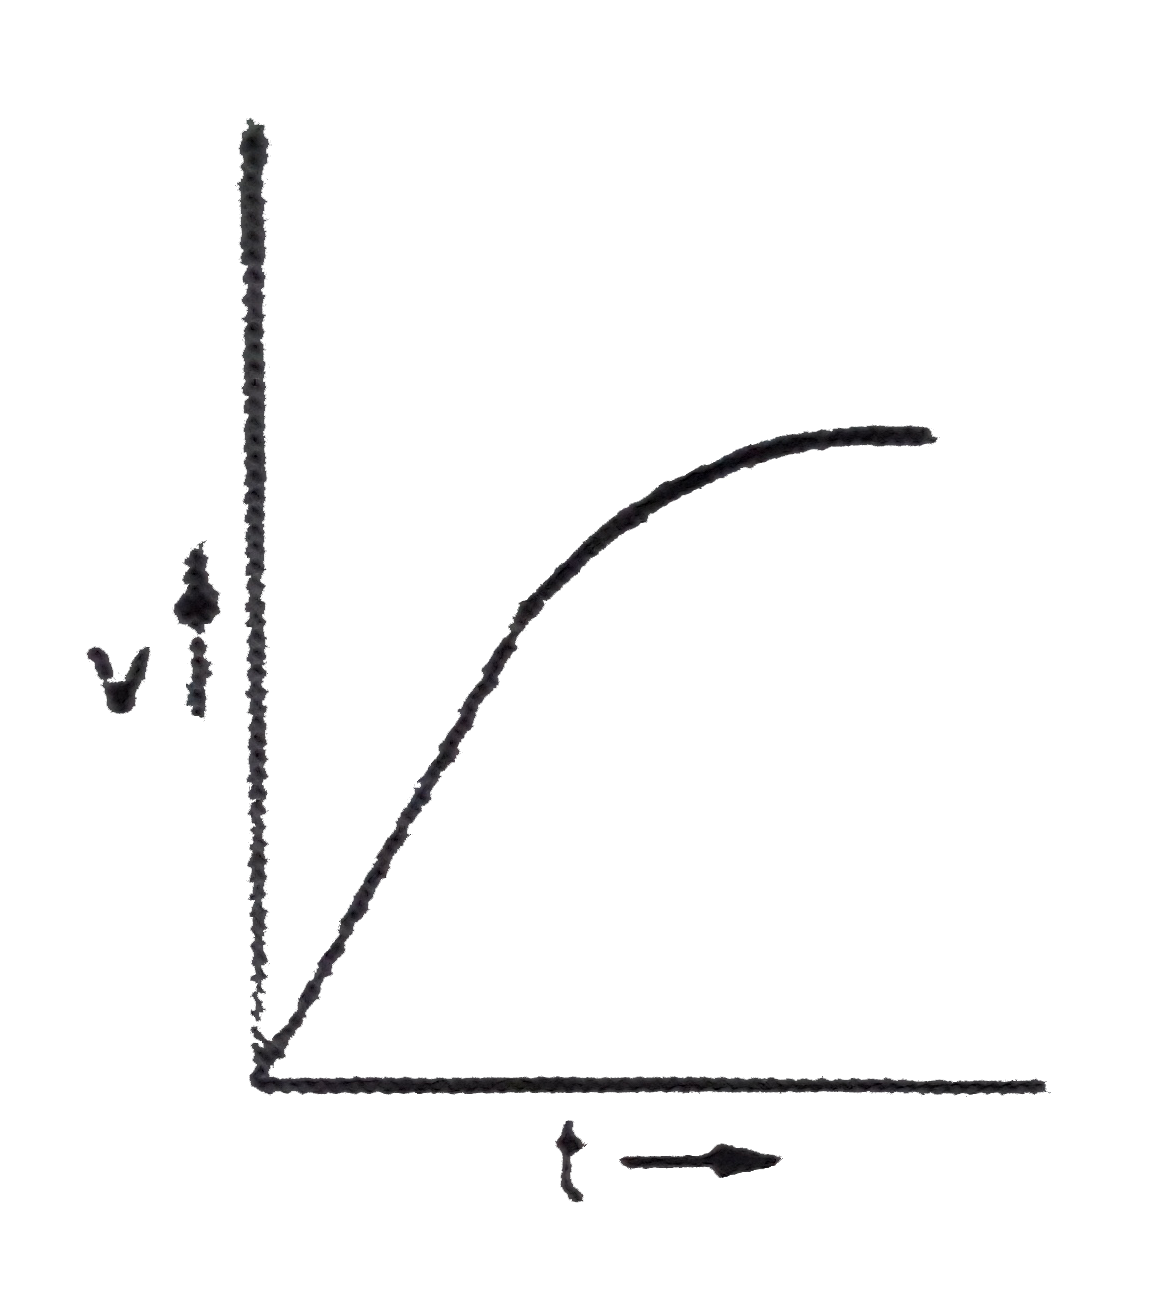 D
D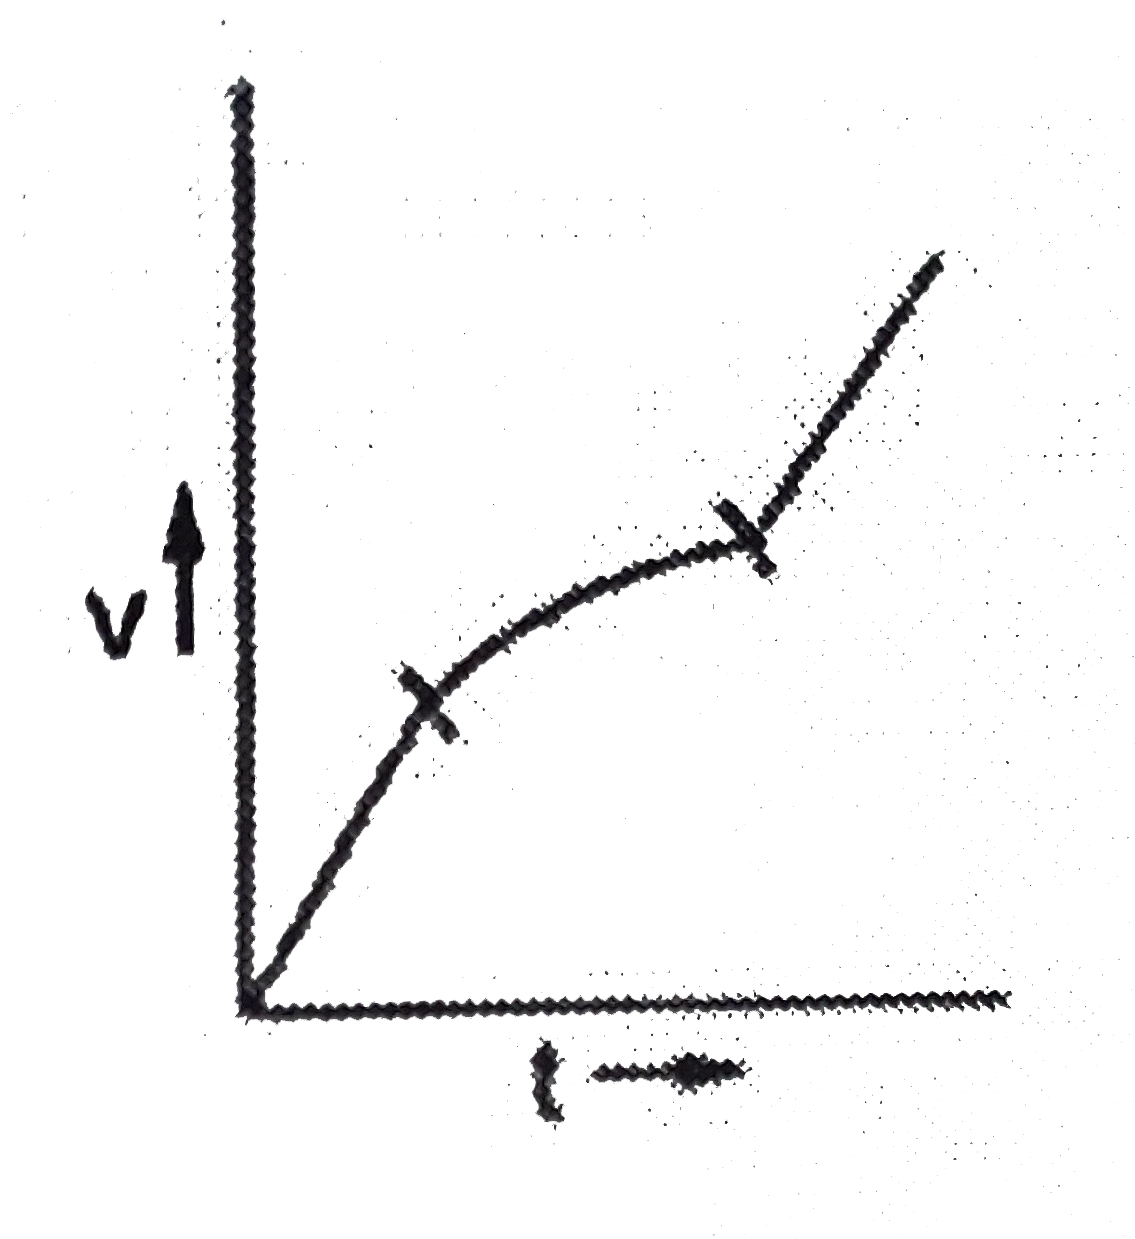
A long bar magnet moves with constant velocity along the axis of a fixed metal ring. It stars form a large distance from the ring, passes through the ring and then moves away far from the ring. The current i flowing in the ring is plotted against time t. Which of the following best represents the resulting curve?
A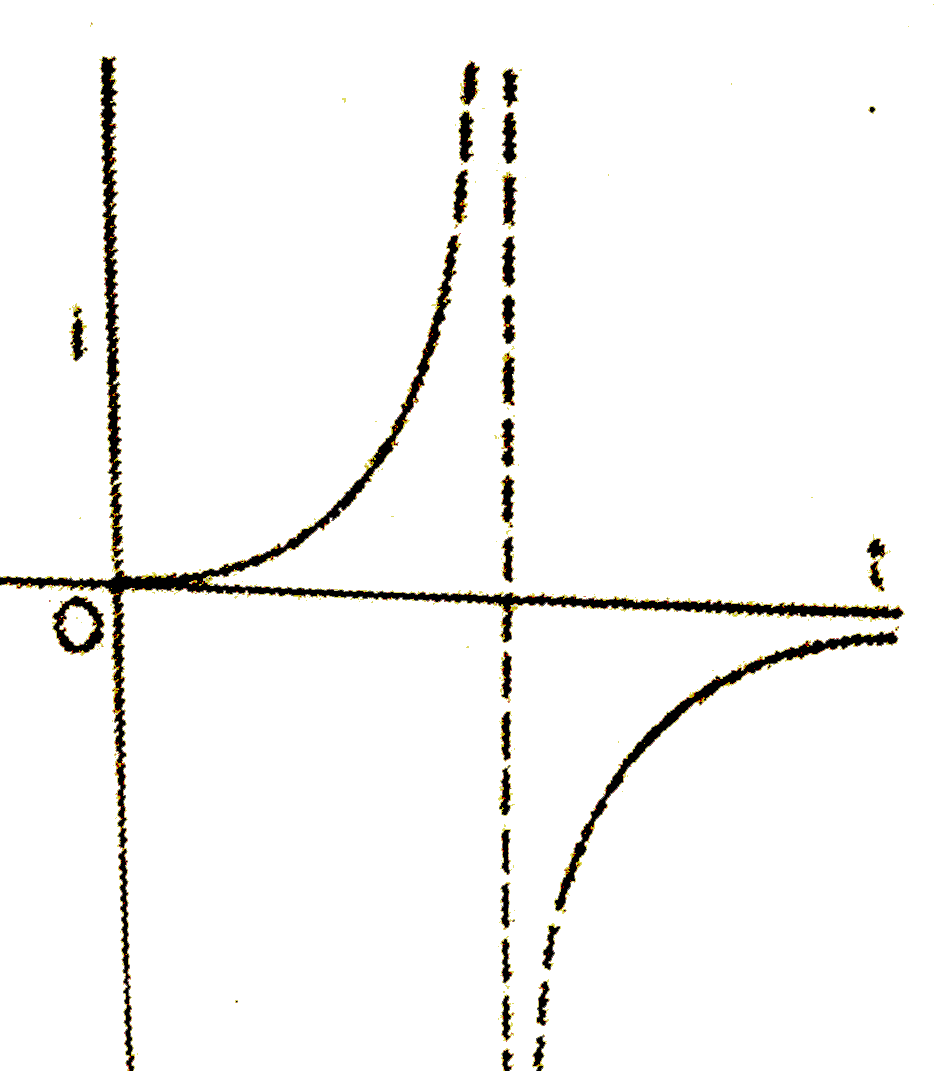 B
B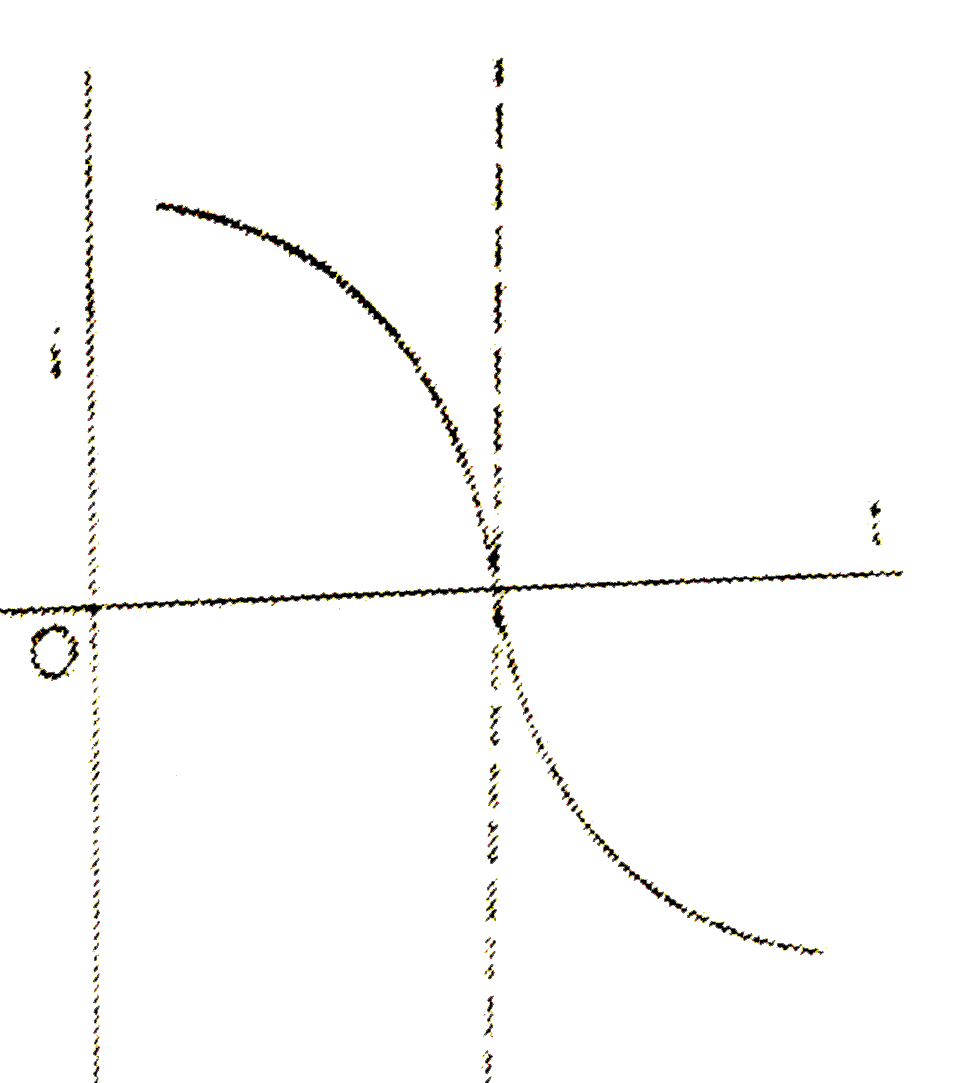 C
C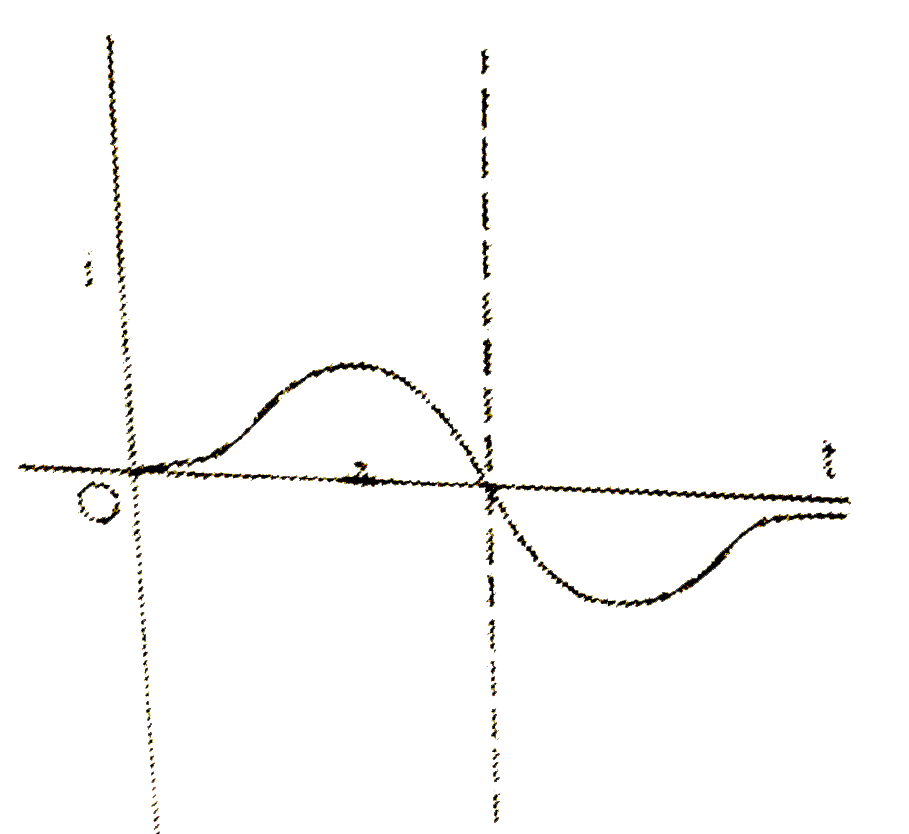 D
D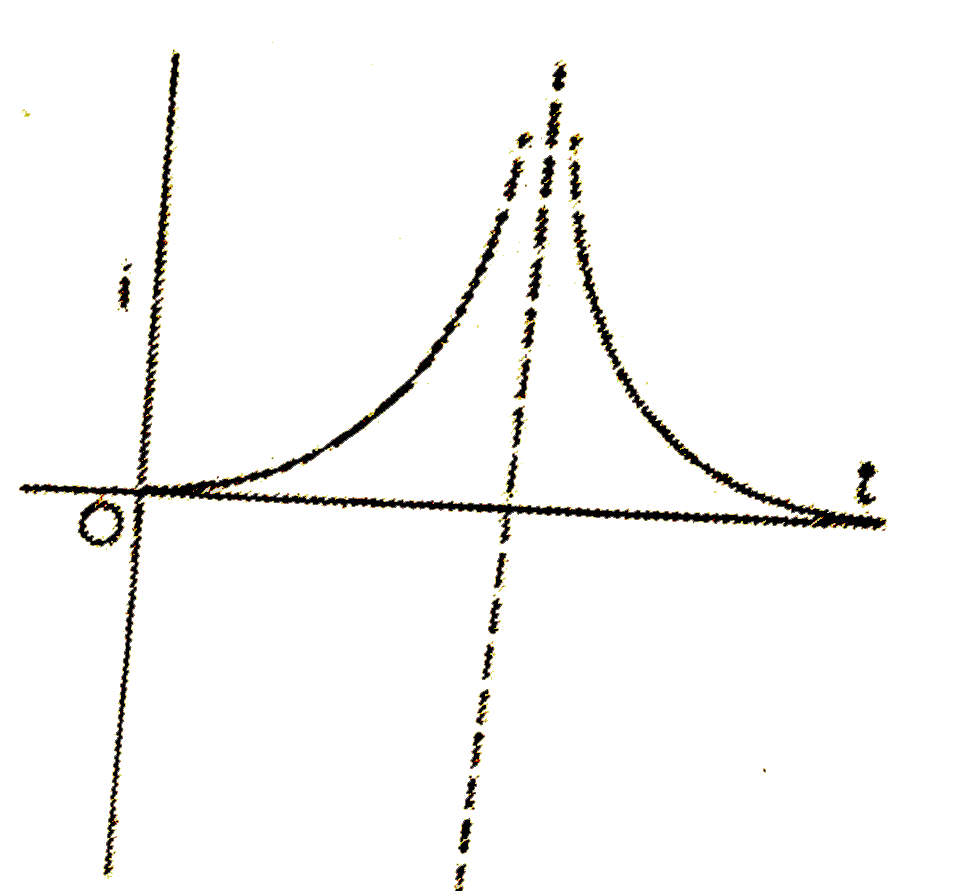
Two parallel beams of protons and electrons, carrying equal currents are fixed at a separation d. The protons and electrons move in opposite directions. P is a point on a line joining the beams , at a distacne x from any one beam. The magnetic field at P is B . If B is plotted against x, which of the following best represents the resulting curve
View SolutionTwo ideantical point charges are placed at a separation of d. P is a point on the line joining the charges, at a distance x from any one charge. The field at P is E,E is plotted against x for value of x from close to zero to slightly less then d. Which of the following represents the resulting curve
View SolutionTwo ideantical point charges are placed at a separation of d. P is a point on the line joining the charges, at a distance x from any one charge. The field at P is E,E is plotted against x for value of x from close to zero to slightly less then d. Which of the following represents the resulting curve
View SolutionE denotes electric field in a uniform conductor, I corresponding current through it, vd velocity of electrons and P denotes thermal power produced in the conductor, then which of the following graph is incorrect?
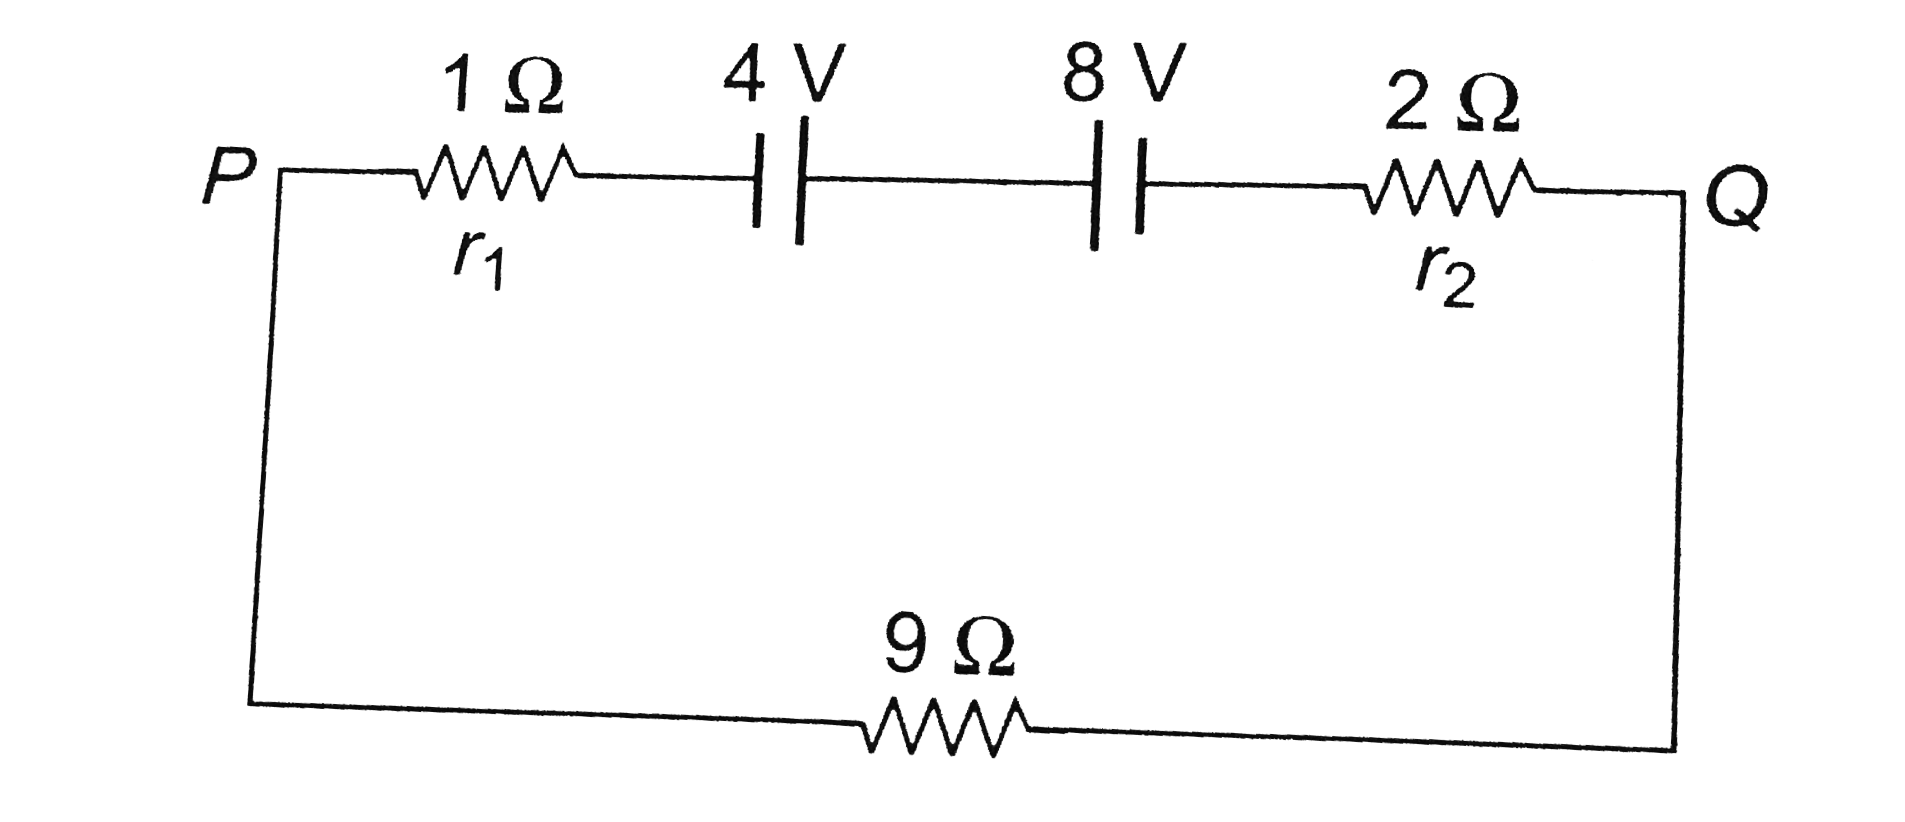
View SolutionTwo batteries of e.m.f. 4V and 8V with internal resistances 1Ω and 2Ω are connected in a circuit with a resistance of 9Ω as shown in figure. The current and potential difference between the points P and Q
View Solution
