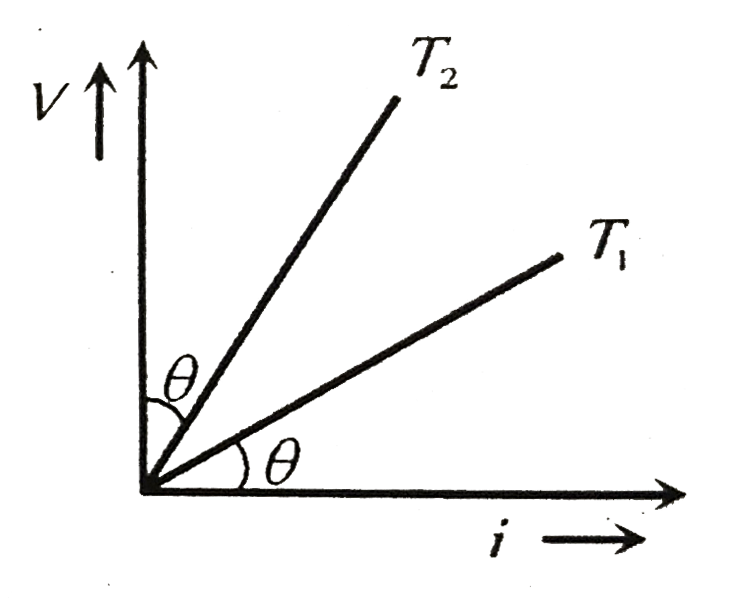
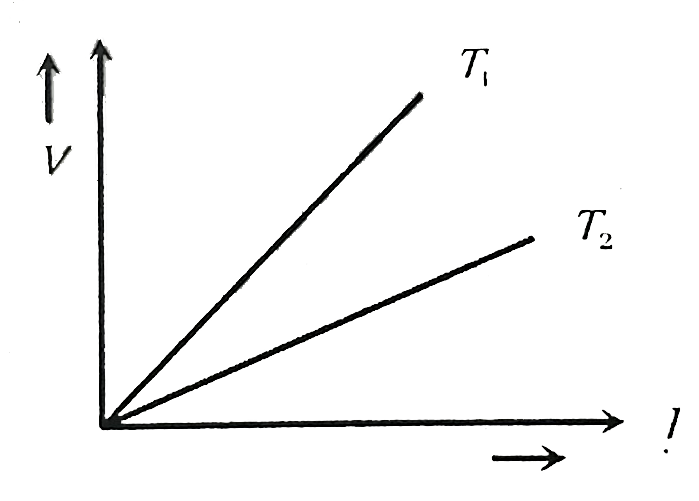
The V - i graph for a conductor at temperature and are as shown in the figure. is proportional to
The correct Answer is:C
Step by step video, text & image solution for The V - i graph for a conductor at temperature T_(1) and T_(2) are as shown in the figure. ( T_(2) - T_(1)) is proportional to by Physics experts to help you in doubts & scoring excellent marks in Class 12 exams.
Updated on:21/07/2023Topper's Solved these Questions
- PRACTICE PAPPERBook:NCERT FINGERTIPSChapter:PRACTICE PAPPERExercise:Practice Paper 2
Explore 50 Videos
- PRACTICE PAPPERBook:NCERT FINGERTIPSChapter:PRACTICE PAPPERExercise:Practice Paper 3
Explore 50 Videos
- NUCLEIBook:NCERT FINGERTIPSChapter:NUCLEIExercise:Assertion And Reason
Explore 15 Videos
- RAY OPTICS AND OPTICAL INSTRUMENTSBook:NCERT FINGERTIPSChapter:RAY OPTICS AND OPTICAL INSTRUMENTSExercise:Assertion And Reason
Explore 15 Videos
Similar Questions
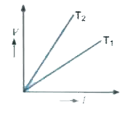
The voltage-current (V-I) graph of a metallic conductor at two different temperature T1 and T2 is shown in figure. At which temperature is the resistance higher?
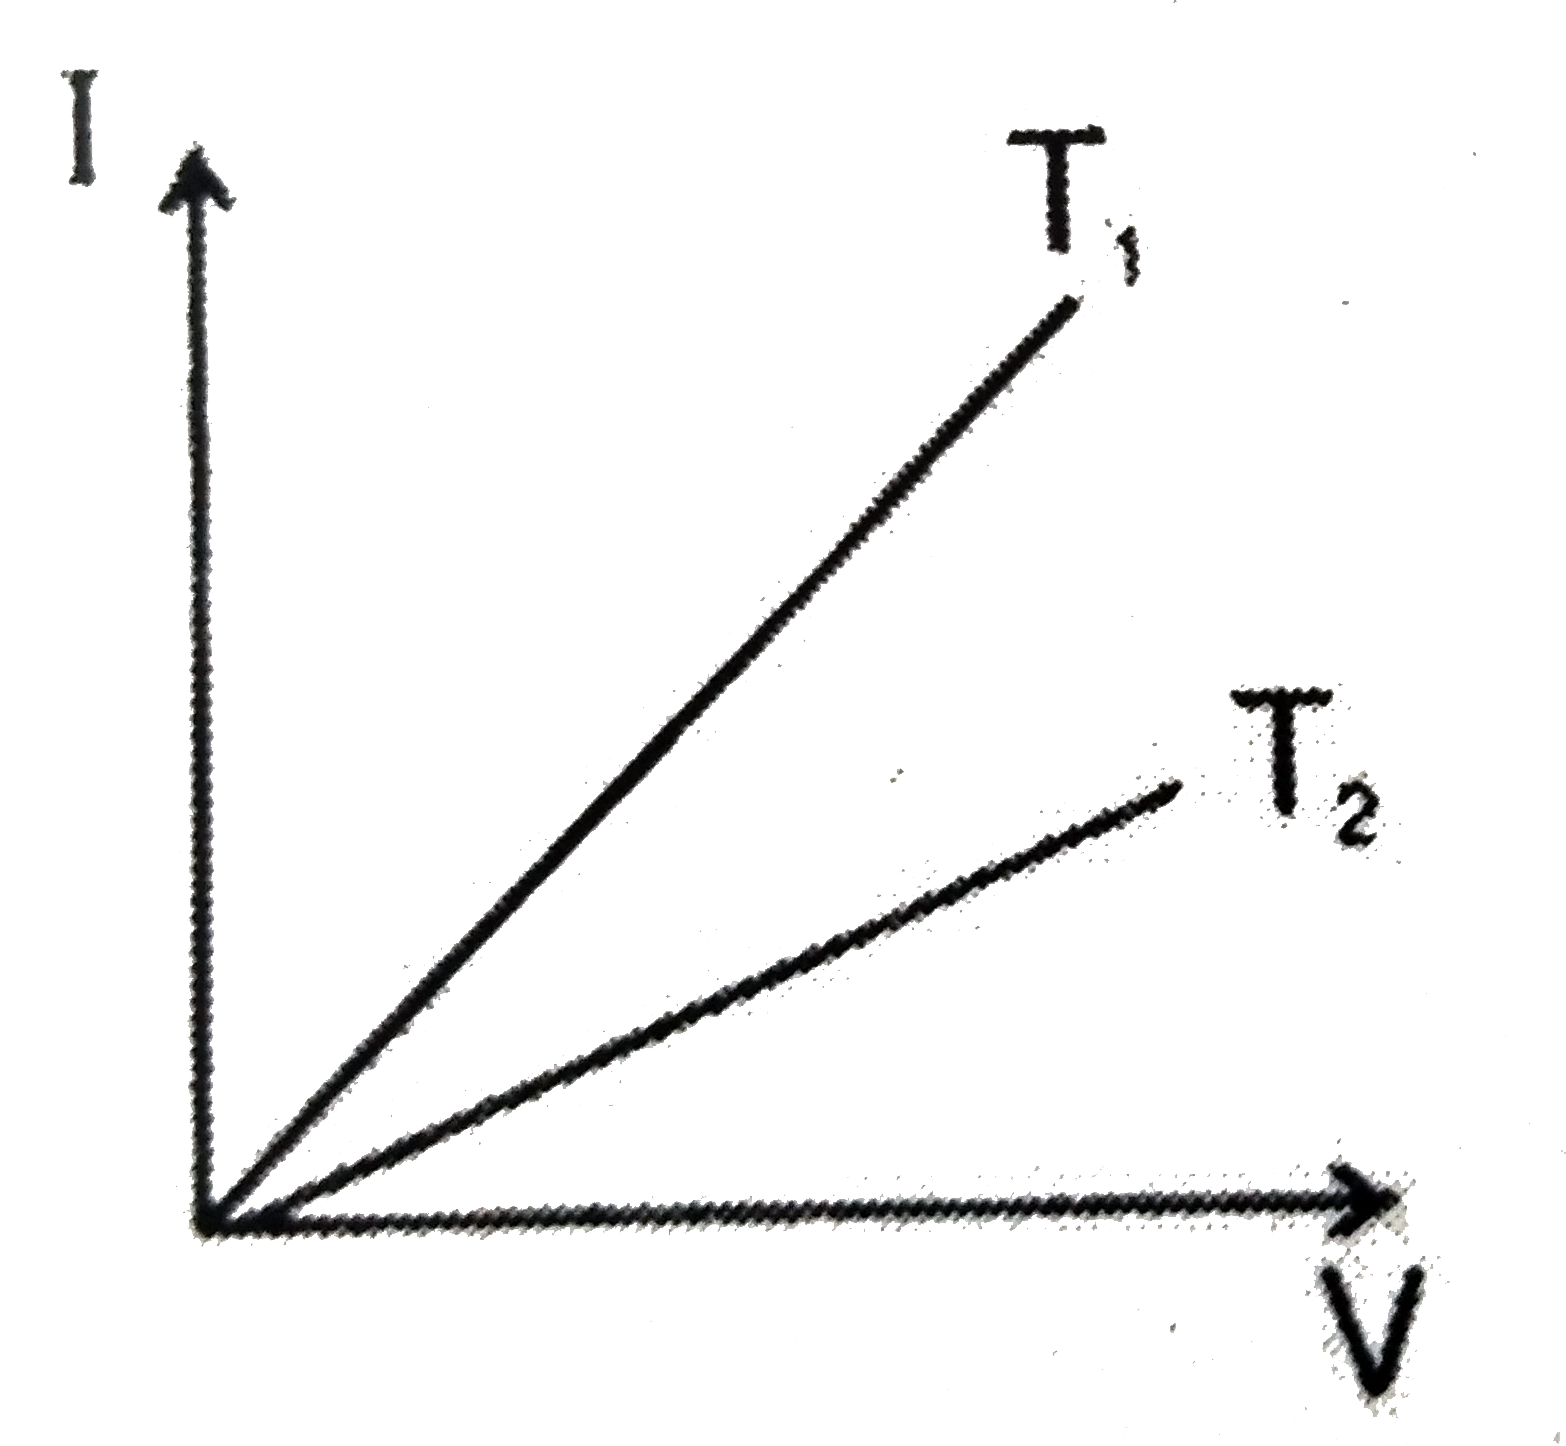
View SolutionThe current-coltage graphs for a given metallic wire at two differenct tempeature T1 and T2 are shown in the figure. Which one is higher, T1 or T2
View Solution
Knowledge Check
The V-l graph for a conductor at temperatures T1 and T2 are as shown in the figure. The term T2−T1 is proportional to
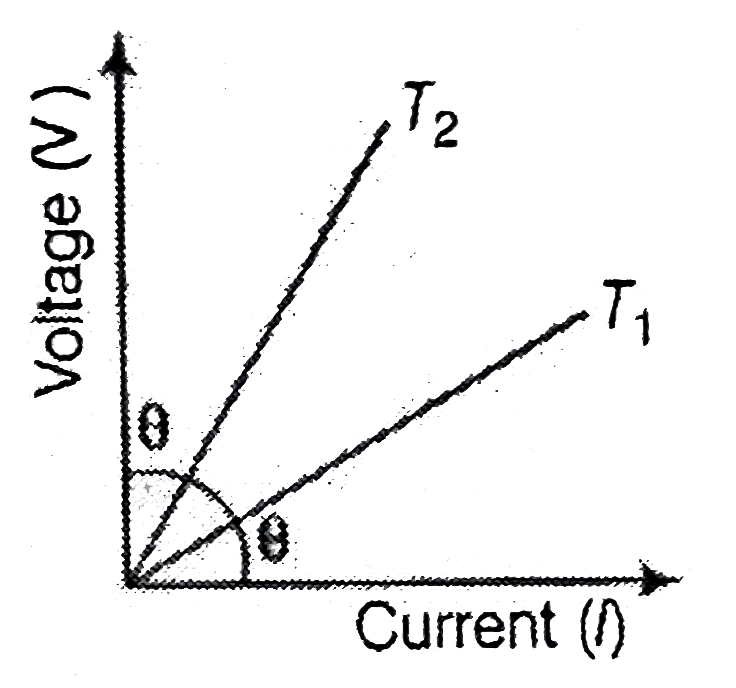 Acos2θBsin2θCcot2θDtan2θ
The V−i graph for a conductor at temeratures T1 and T2 are as shown in the figure. (T2−T1) is alphaortional to.
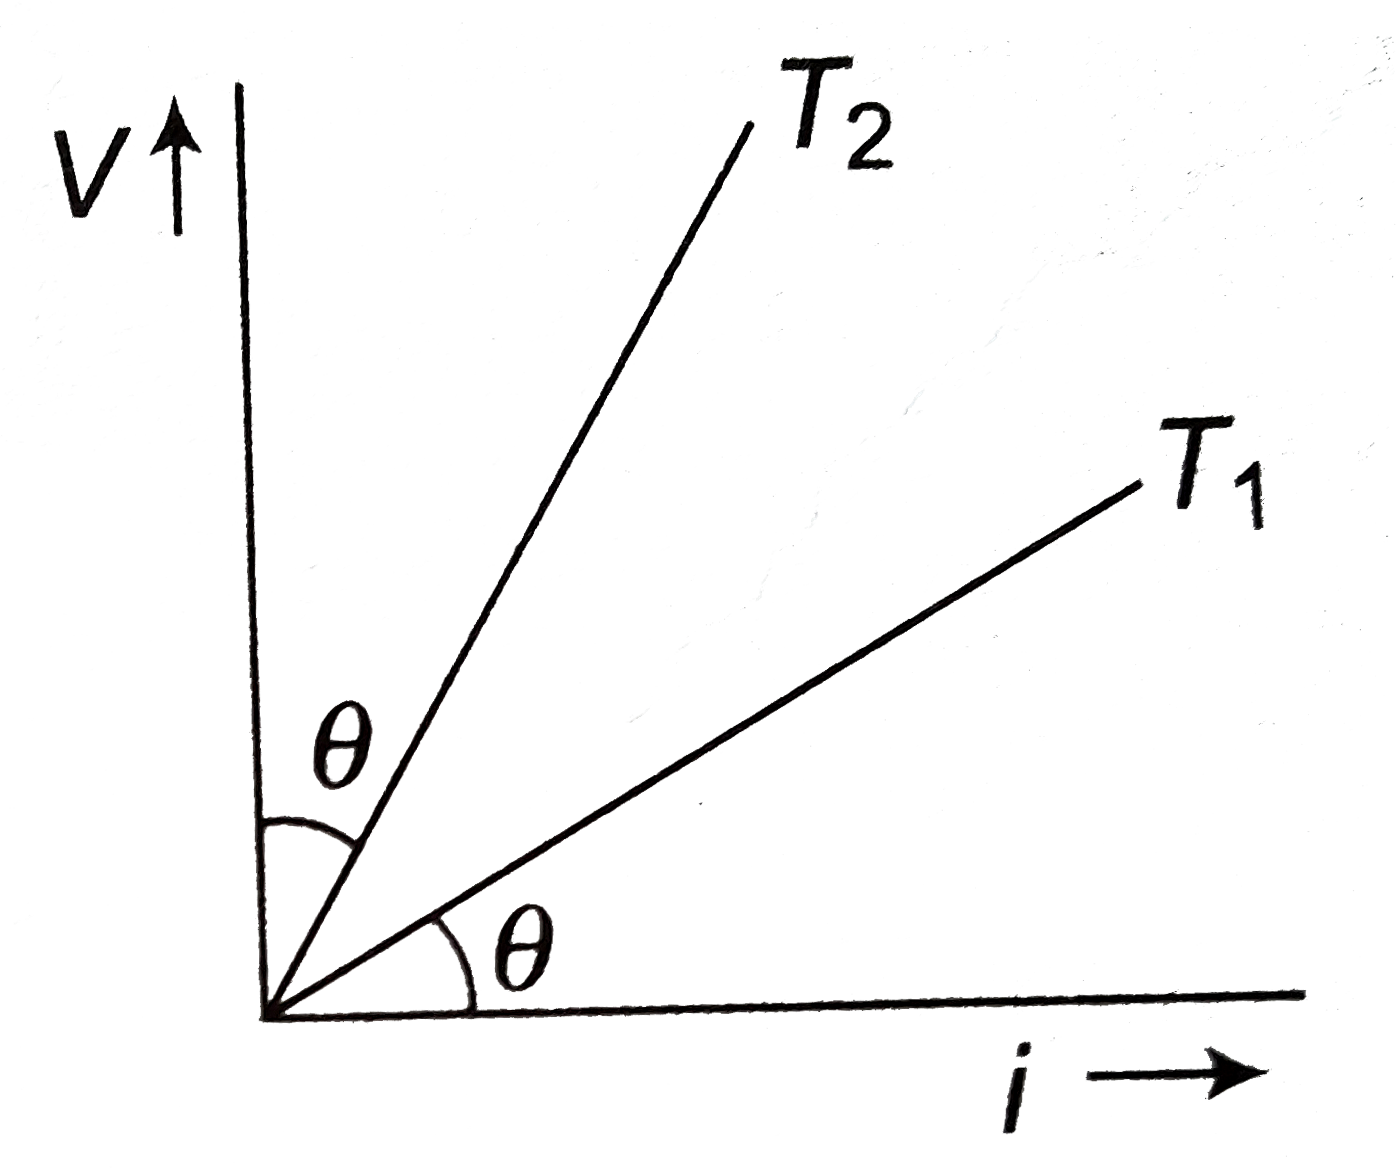 .Acos2θBsinθCcot2θDtanθ
The V - I graphs for a conductor at temperature T1andT2 are shown in the figure (T2−T1) is proportional to
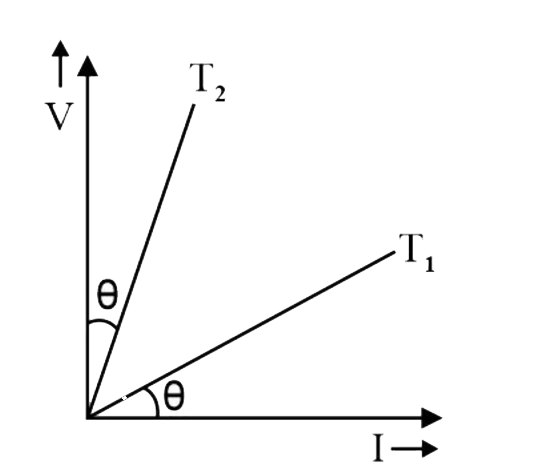 AtanθBsinθCcot2θDcos2θ
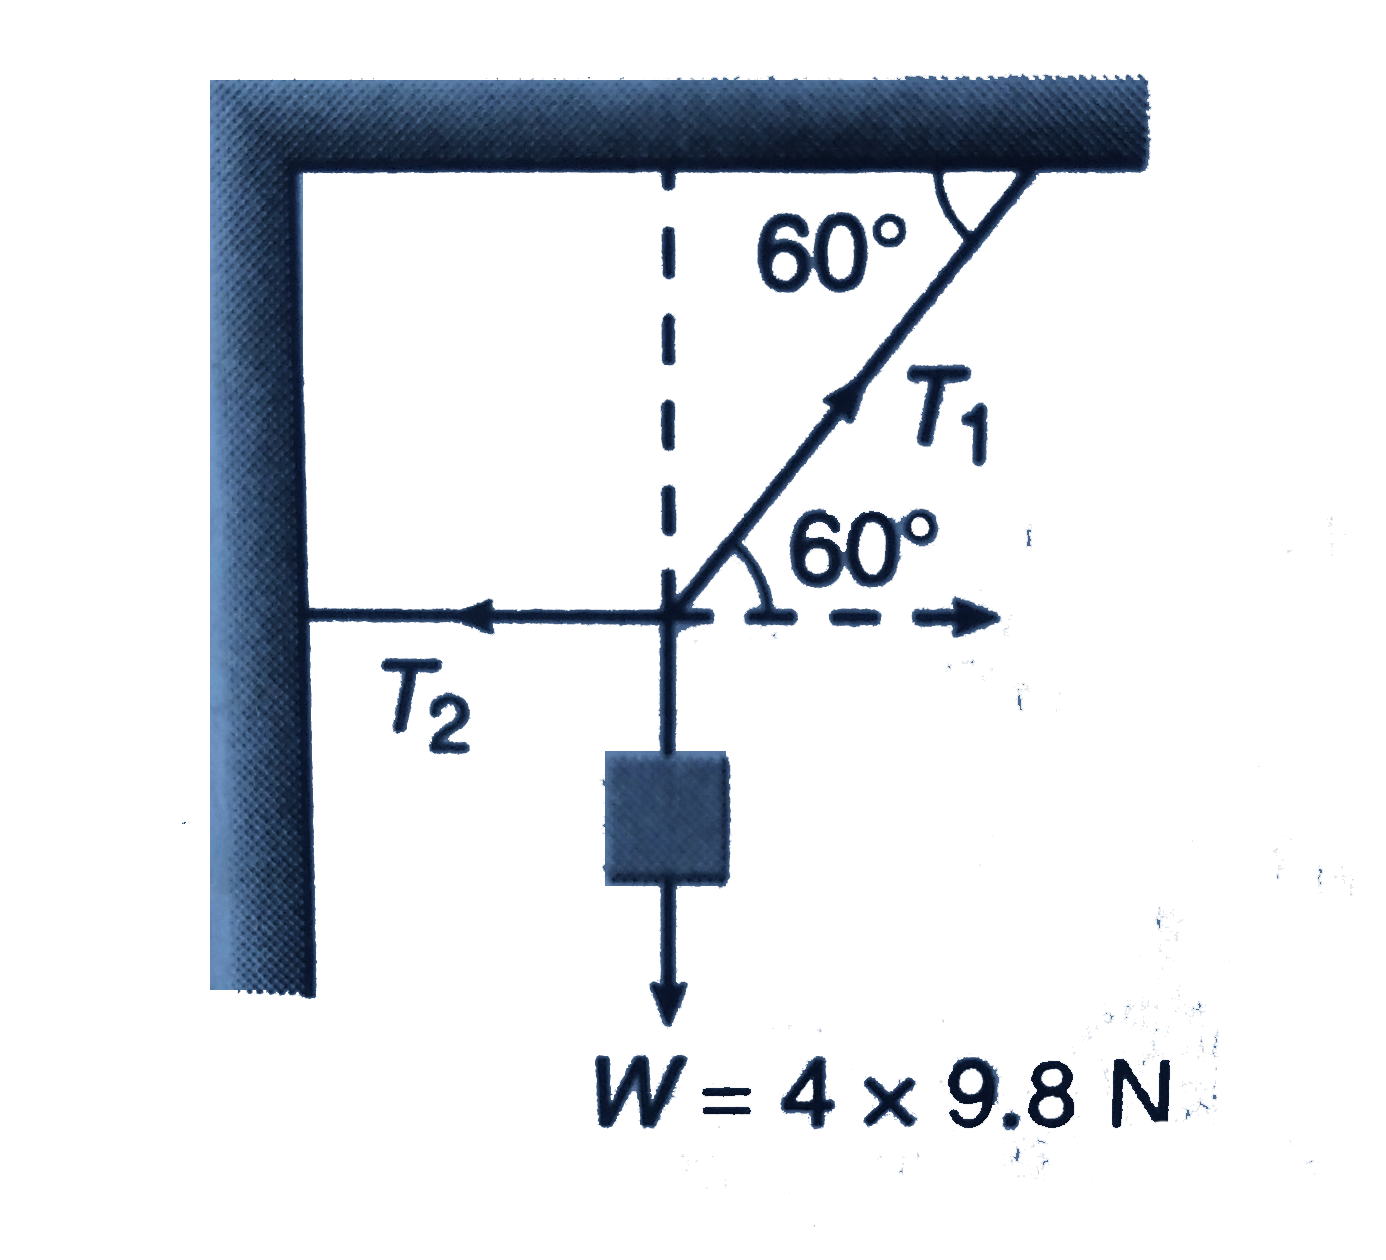
Determine the tensions T1 and T2 in the string as shown in figure.
View SolutionThe current - voltage graphs for a given metallic wire at two different temperatures T1andT2 are shown in the figure.
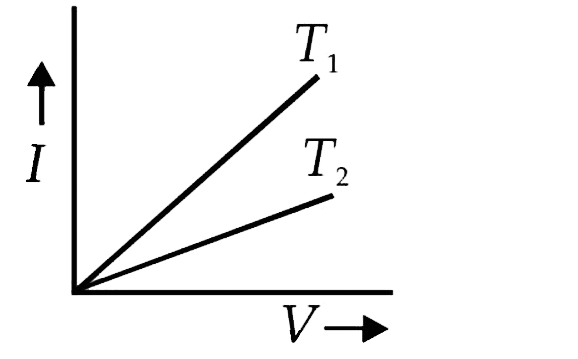
The temperature T2 is greater than T1.
View SolutionThe voltage V and current I v graphs for a conductor at two different temperatures T1andT2 are shown in the figure. The relation between T1andT2 is

View SolutionThe voltage V and current I graph for a conductor at two different temperatures T1 and T2 are shown in the figure. The relation between T1 and T2 is
View SolutionAssertion : Current versus potential difference (i-V) graph for a conductor at two different temperatures T1 and T2 is shown in figure. Hence T1>T2.
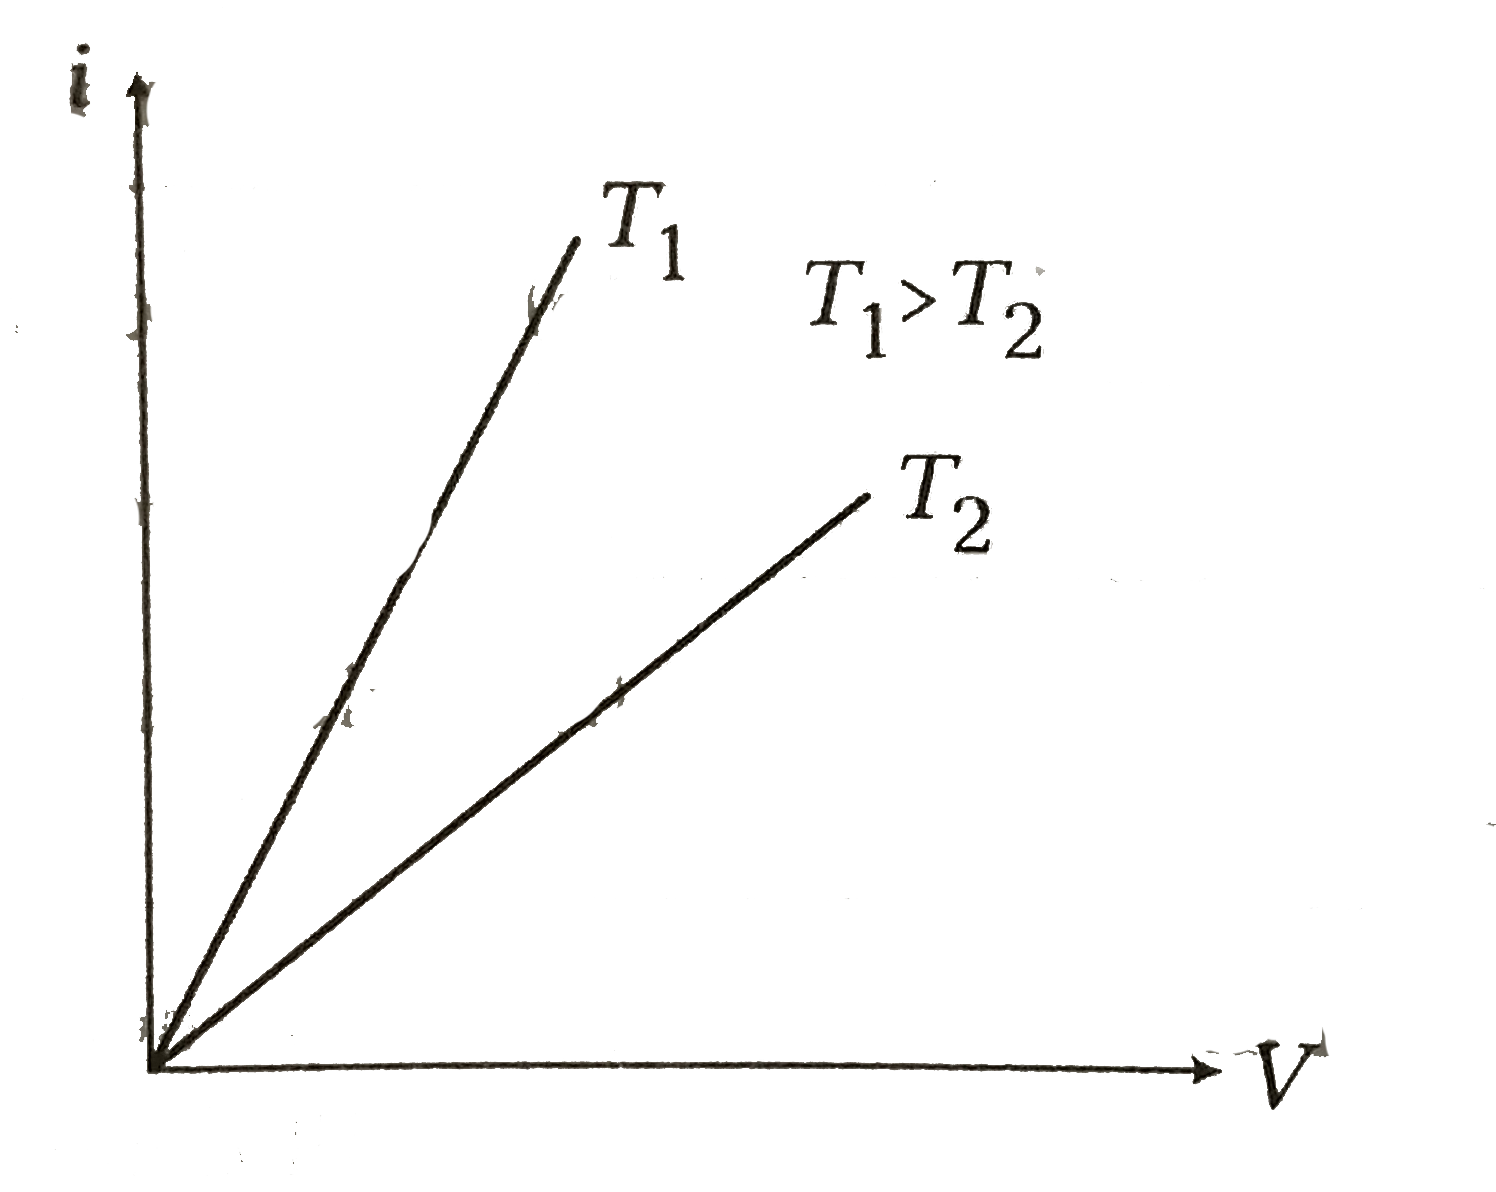
Reason : Resistance of a conductor increases with rise in temperature.
View Solution