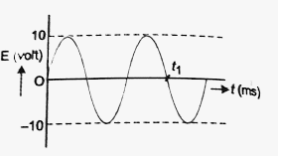
The variation with time t of the output E of an alternating voltage supply of frequency 50 Hz is shown in the figure.
 State the time t1, the peak value E0 of the voltage, the root mean square voltage Erms, the mean (Average) voltage EavSolution in Punjabi
Step by step video & image solution for The variation with time t of the output E of an alternating voltage supply of frequency 50 Hz is shown in the figure. State the time t_1, the peak value E_0 of the voltage, the root mean square voltage E_(rms), the mean (Average) voltage E_(av) by Physics experts to help you in doubts & scoring excellent marks in Class 12 exams.
Topper's Solved these Questions
Similar Questions
A lamp is connected in series with a capacitor to a high frequency a.c. source. How will the glow of the lamp change, when it is connected directly to the same source? Explain your answer.
03:49View SolutionAssuming the earth to be a sphericl conductor of radius 6400 km, calculate its caacitance. Given 14πε0=9×10⁹Nm2^−2
02:39View SolutionThe output E of an alternating voltage supply of frequency 50 Hz is shown in Fig. From this Fig, state
(i) value of time t1
(ii) peak voltage E0 (iii) root mean square voltage Ev
(iv) mean supply is connected in series with a resistance of 2.4Ω, calculate the mean power dissipated in the resistor.
 02:41View Solution
An alternating voltage is given by: e=e1sinωt+e2cosωt. Then the root mean square value of voltage is given by:
02:17View SolutionCalculate the root mean square value of the voltage of the given variation of an alternating EMF with time in graph as shown in figure-5.173.
01:23View SolutionAn AC voltage is given by E=E0sin(2πt)T. Then the mean value of voltage calculated over time interval of T/2 seconds
02:19View Solutionएक प्रत्यावर्ती धारा परिपथ में विभवान्तर का वर्ग - माध्य -मूल मान 200 V है । विभव का शिखर मान क्या है ?
01:32View Solution220 व वर्ग माध्य मूल मान तथा 50 हर्ट्ज की प्रत्यावर्ती वोल्टता का (i) शिखर मान (ii) तात्कालिक मान क्या होगा ?
09:27View Solutionप्रत्यावर्ती वोल्टेज का शिखर मान 423 वोल्टेज है। उसका वर्ग-माध्य-मूल मान कितना होगा ?
03:18View SolutionFind the root mean square voltage for the variation of voltage as shown in the adjacent figure.
 01:40View Solution
किसी 50 Hz आवृत्ति के ज्यावक्रीय प्रत्यावर्ती वोल्टता का वर्ग माध्य मूल मान 200√2 है, तो इसकी तात्क्षणिक वोल्टता का समीकरण (t समय पर) लिखो।
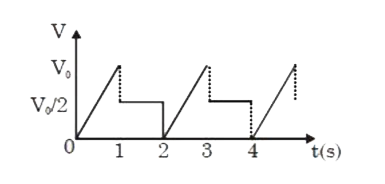
03:00View SolutionA periodic voltage V varies with time t as shown in figure. T is the time period. Find the rms value of the voltage.
01:18View SolutionExpression for instantaneous value of an alternating voltage is given below: epsilon= 150 sin 200 pit where t is the time in seconds . Calculate (i) the peak value of voltage (ii) rms value of voltage and (iii) frequency of supply.
02:57View SolutionIf E0 represents the peak value of the voltage in an a.c. circuit, the rms value of the voltage will be ......
01:47View SolutionAn alternating voltage is given by: e = e_(1) sin omega t + e_(2) cos omega t . Then the root mean square value of voltage is given by:
02:48View SolutionAn alternating voltage is given by: e=e1sinωt+e2cosωt. Then the root mean square value of voltage is given by:
03:32View Solution

