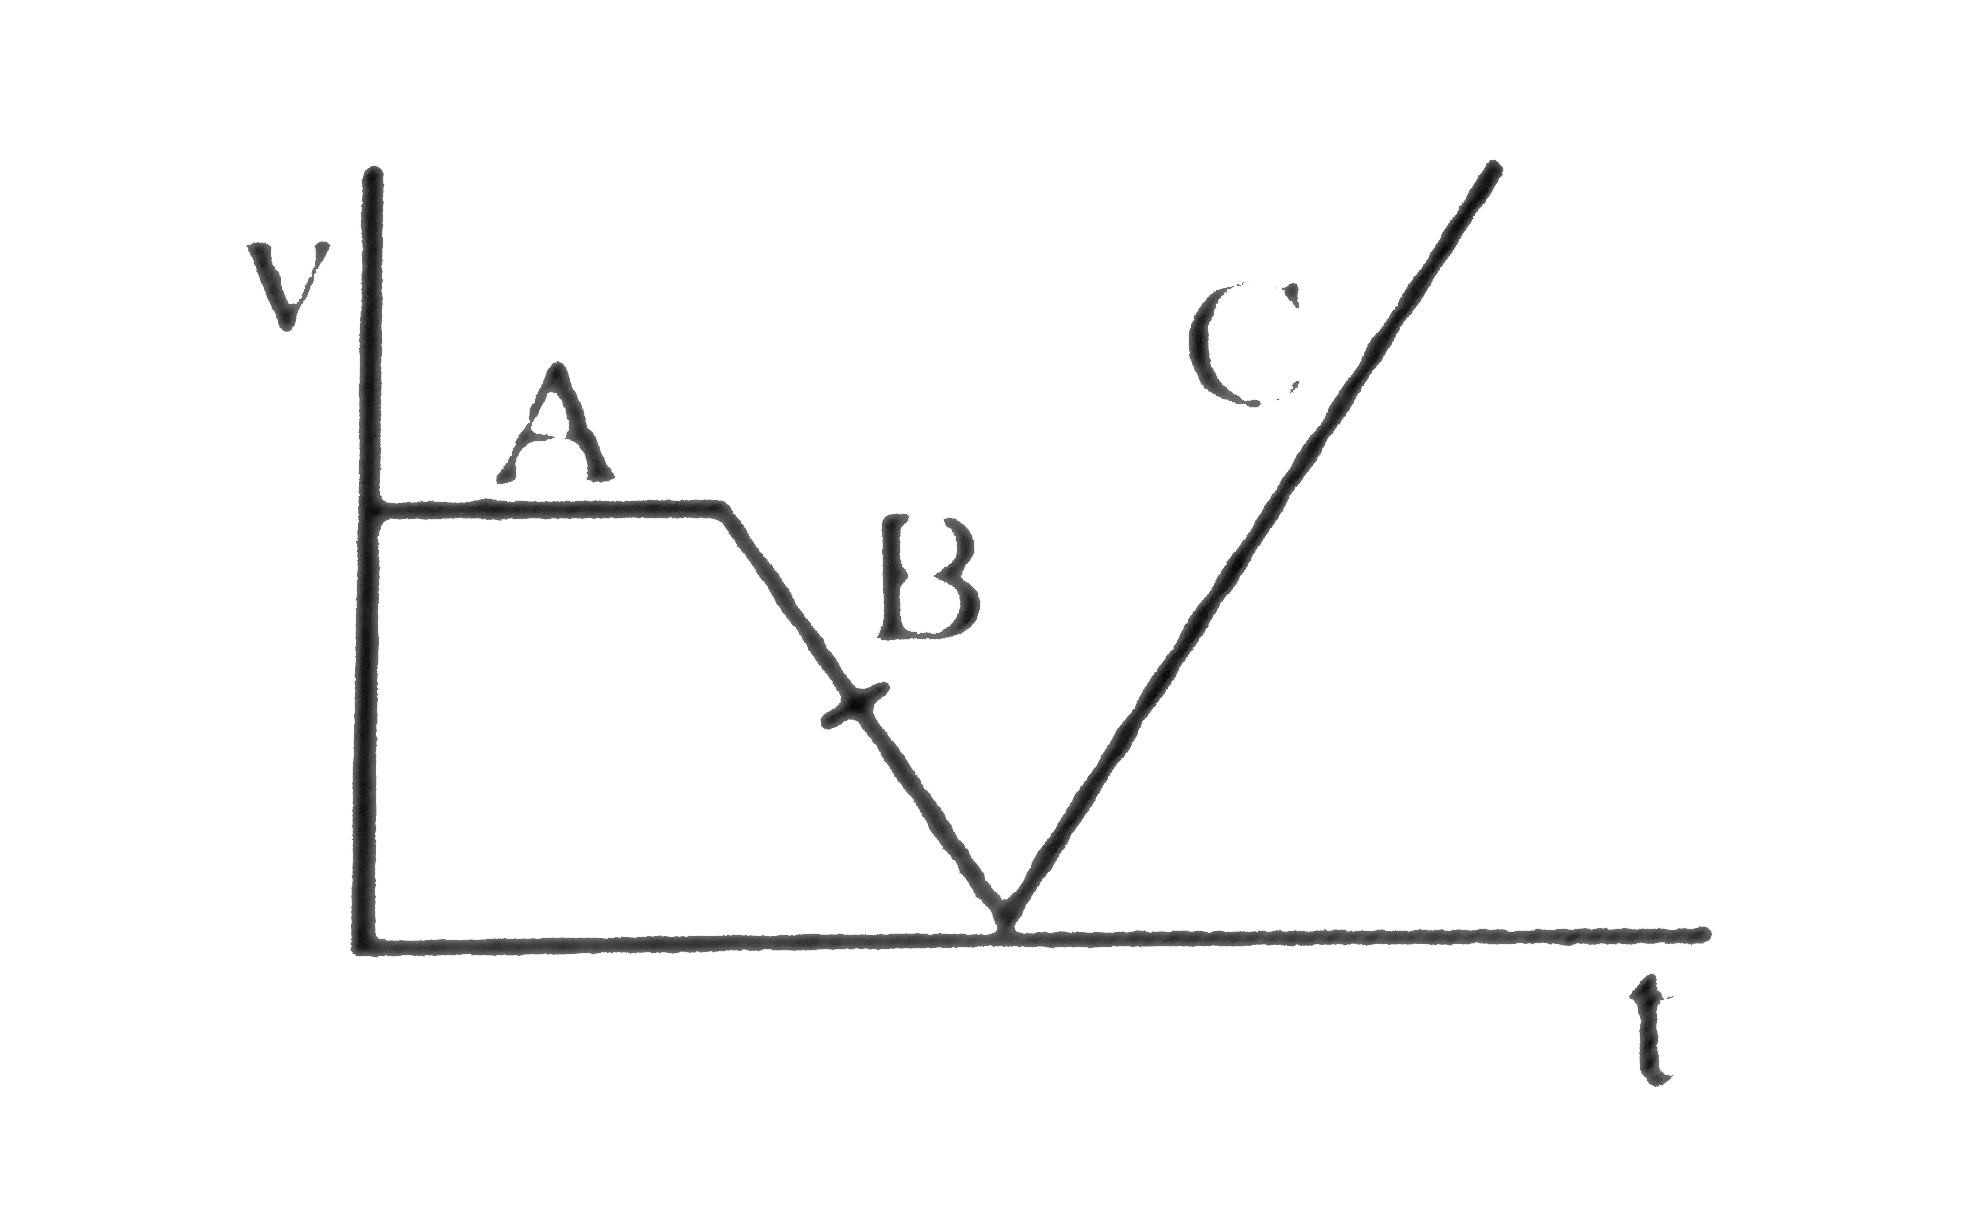
The velocity time graph of a body is shown in fig. it indicates that :
A
at B force is zero
B
at B there is a force but towards motion
C
at B there is a force that opposes the motion
D
forces are equal at A, B and C
Video Solution
Text Solution
The correct Answer is:C
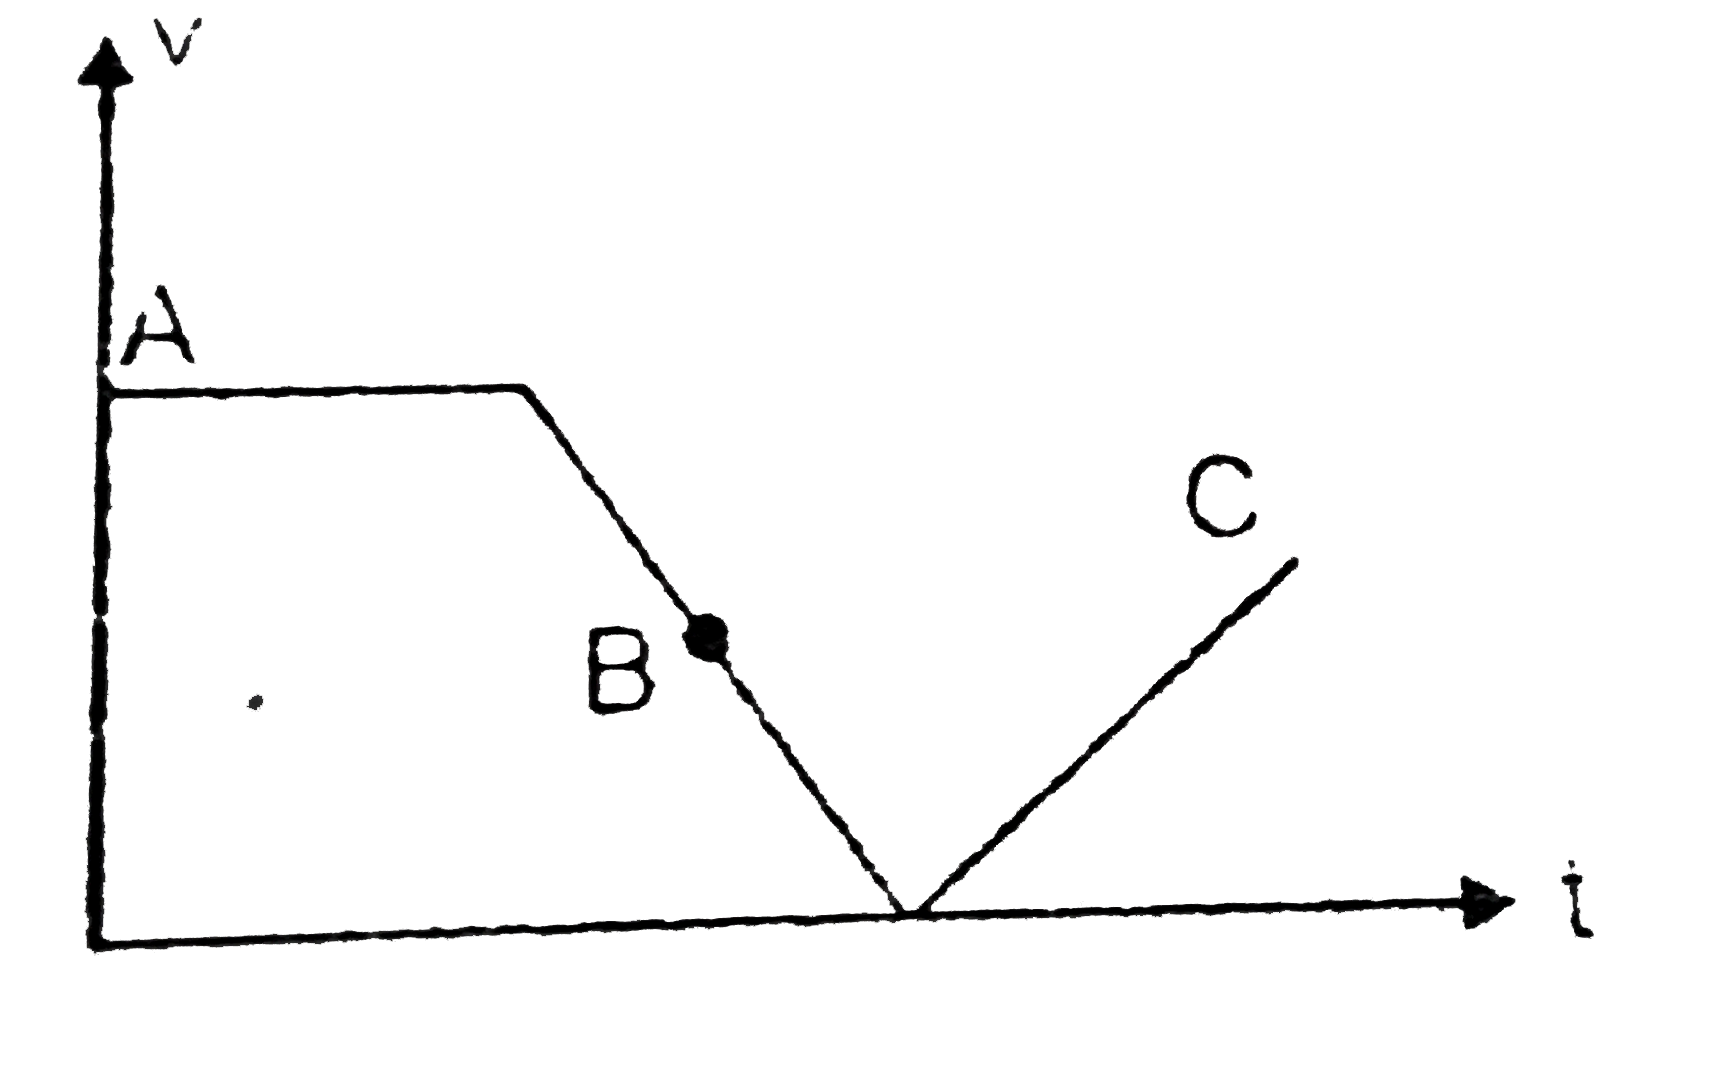
At B acceleration is −ve. Hence force oppose the motion
|
Topper's Solved these Questions
- MOTION IN A STRAIGHT LINEBOOK - GRB PUBLICATIONCHAPTER - MOTION IN A STRAIGHT LINEEXERCISE - More than one choice is correct
16 Videos
- MOTION IN A STRAIGHT LINEBOOK - GRB PUBLICATIONCHAPTER - MOTION IN A STRAIGHT LINEEXERCISE - Assertion Reason
12 Videos
- MOTION IN A STRAIGHT LINEBOOK - GRB PUBLICATIONCHAPTER - MOTION IN A STRAIGHT LINEEXERCISE - Problems and Practice
16 Videos
- FRICTION AND CIRCULAR MOTION BOOK - GRB PUBLICATIONCHAPTER - FRICTION AND CIRCULAR MOTION EXERCISE - Comprehension type
11 Videos
- MOTION IN TWO AND THREE DIMENSIONSBOOK - GRB PUBLICATIONCHAPTER - MOTION IN TWO AND THREE DIMENSIONSEXERCISE - All Questions
210 Videos
Similar Questions
Knowledge Check
The veloctiy - time graph of a body is shown in the fig. It implies that at point B.
 AThe force is zeroBThere is a force towards motionCThere is a force which opposes motionDThere is only gravitational force
The velocity-time graph of a body is shown in the figure, it implies that at point B
 Athe force Is zeroBthere is a force toward motionCthere Is a force which opposes motionDthere is only gravitational force
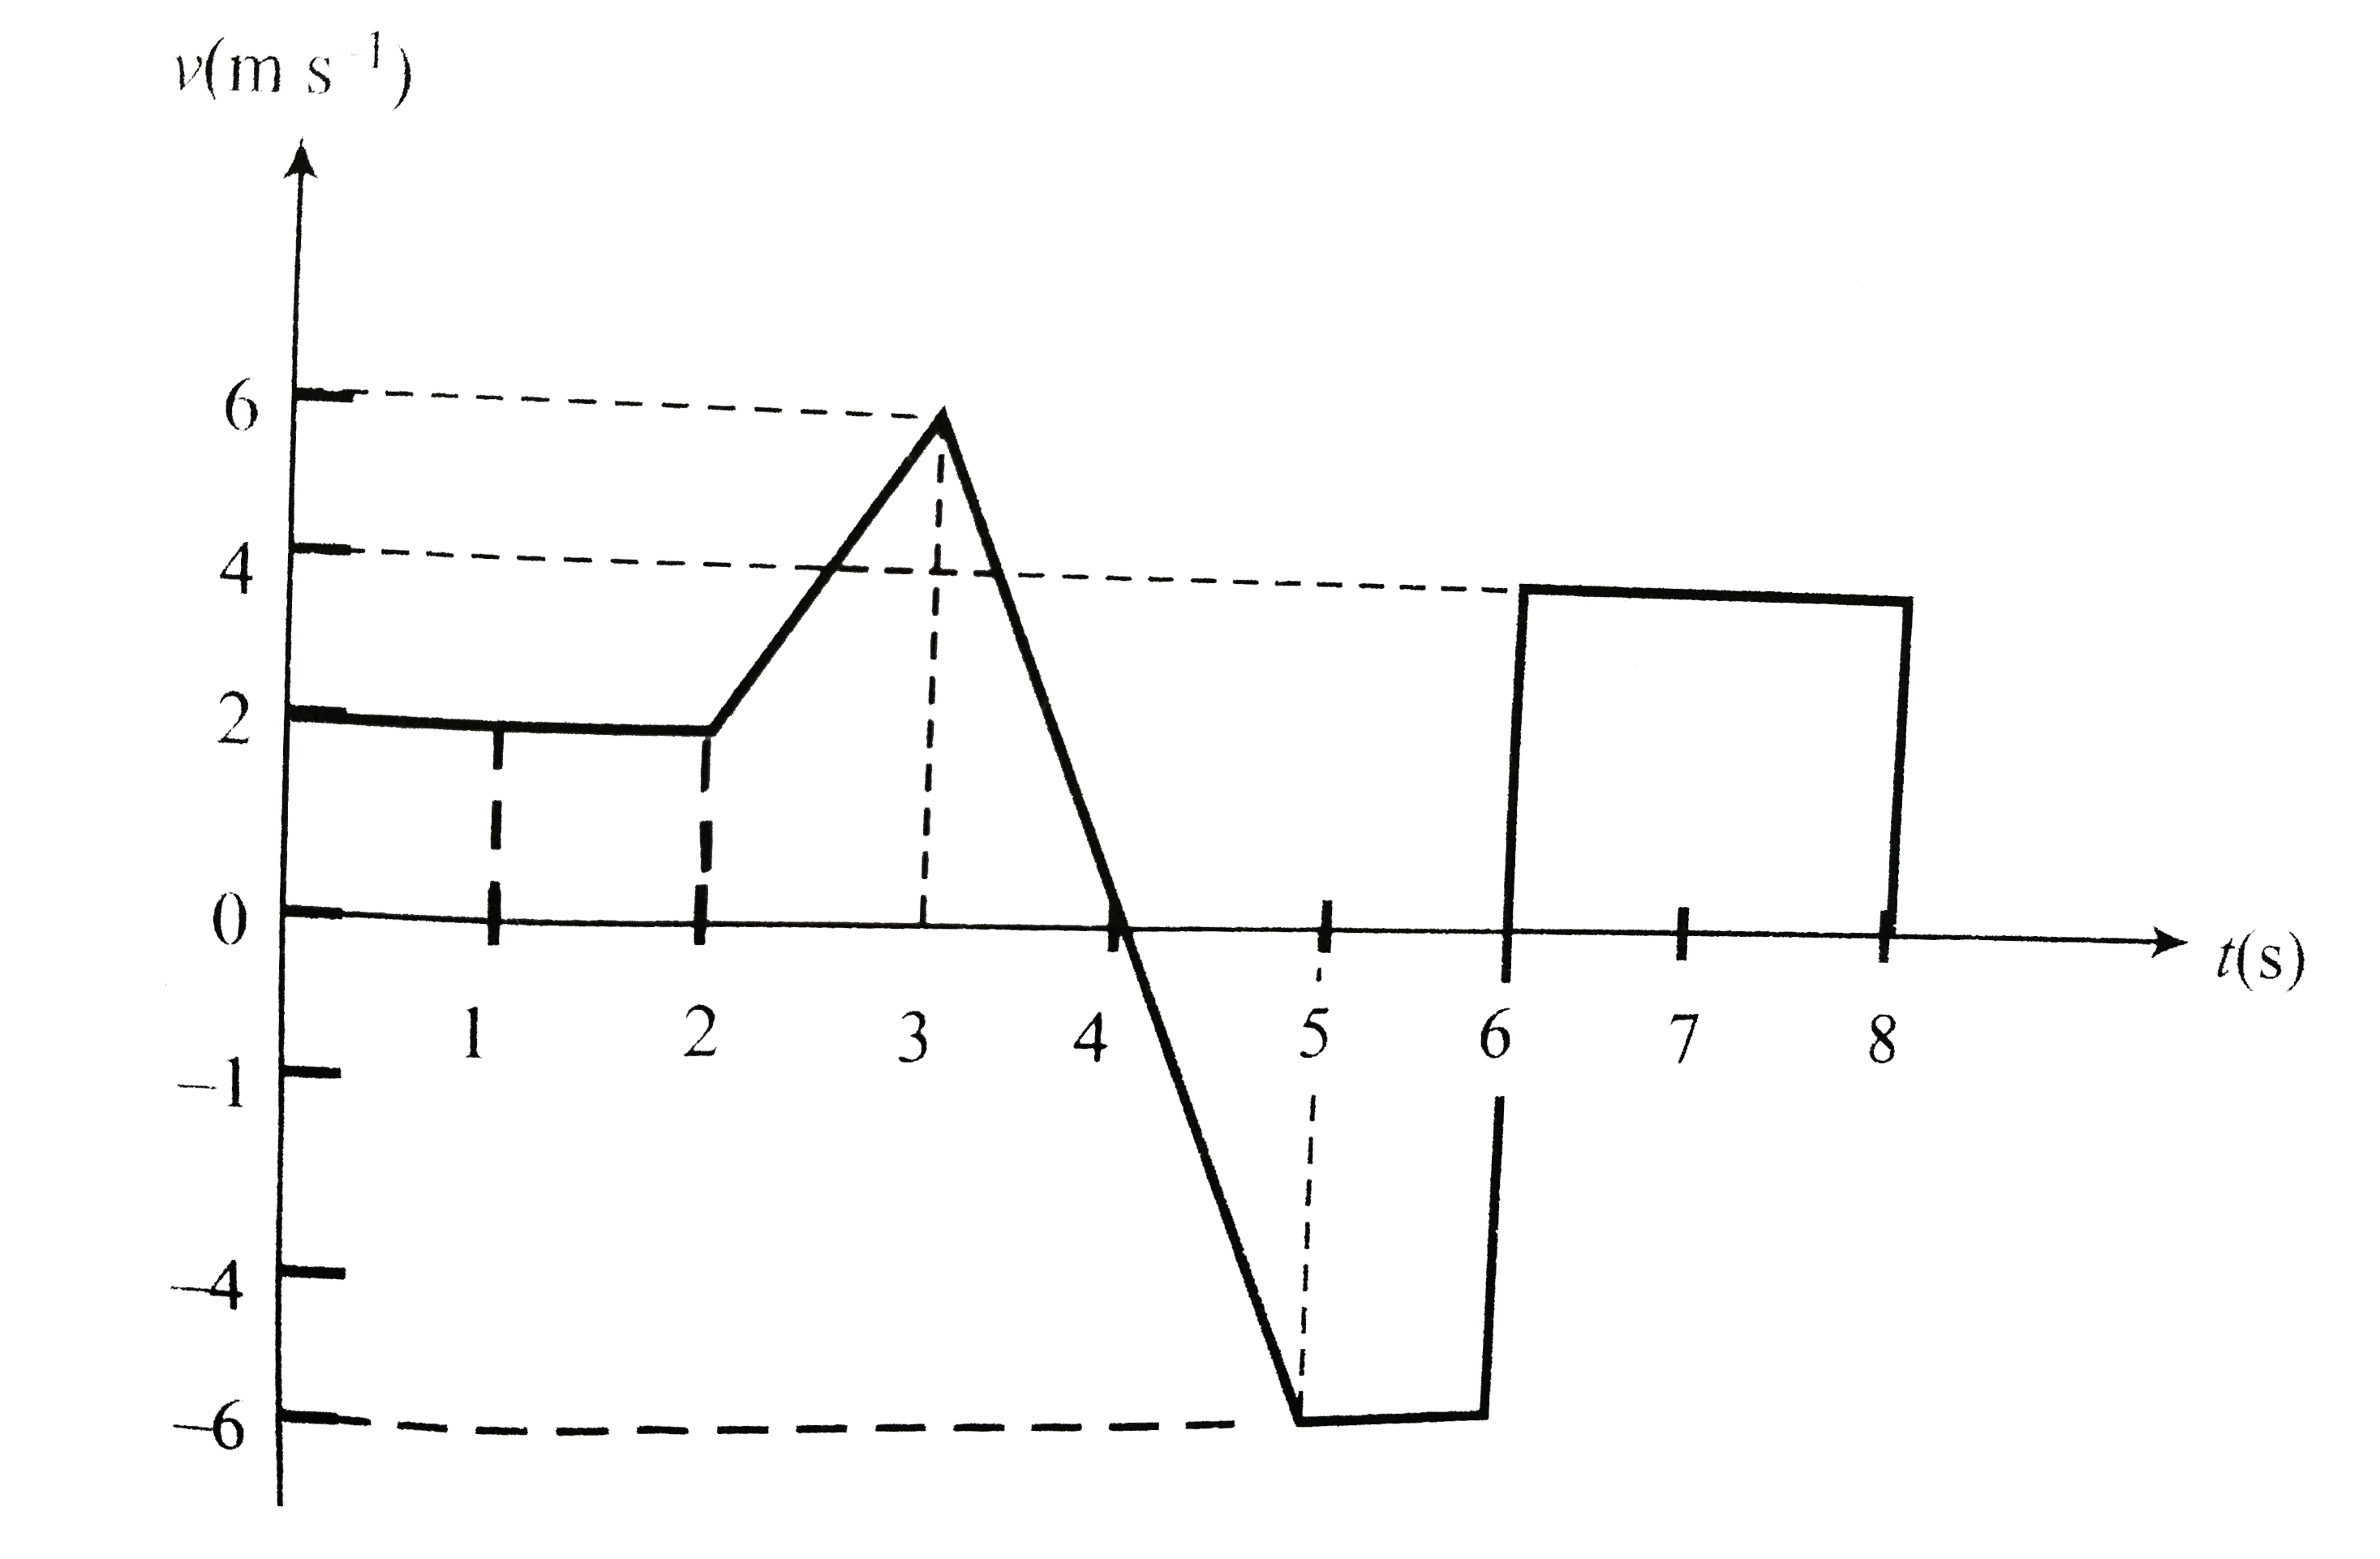
The velocity-time graph of a body is shown in .
The displacement of the body in 8s is.
 .A9mB12mC10mD28m
The velocity time graph of a body represented as shown in Fig. Calculate the distance by the body in 5 second.

View SolutionThe velocity time graph of a body is as showh in
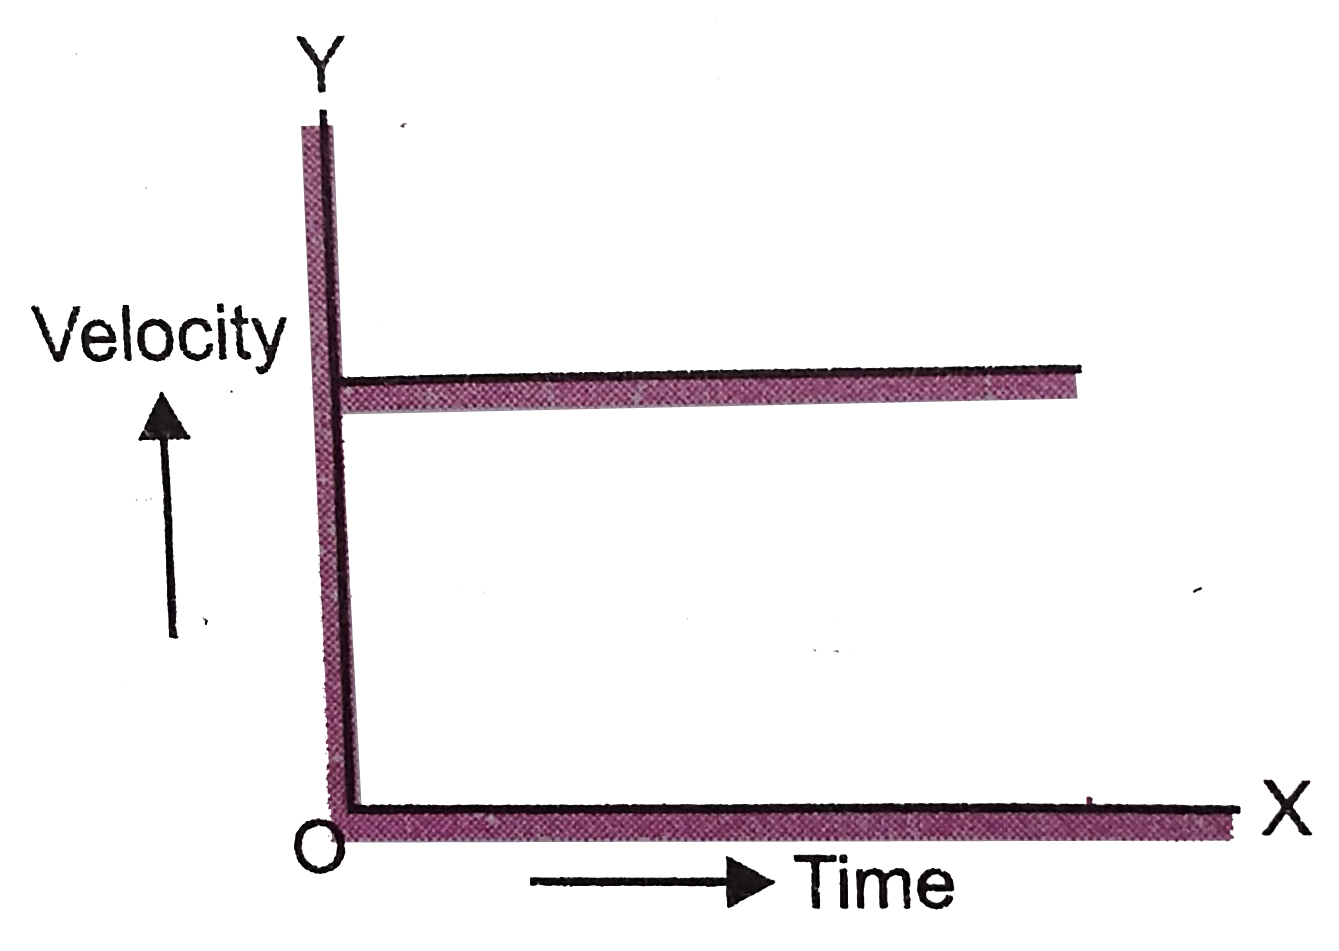
what would be the acceleration of the body ?
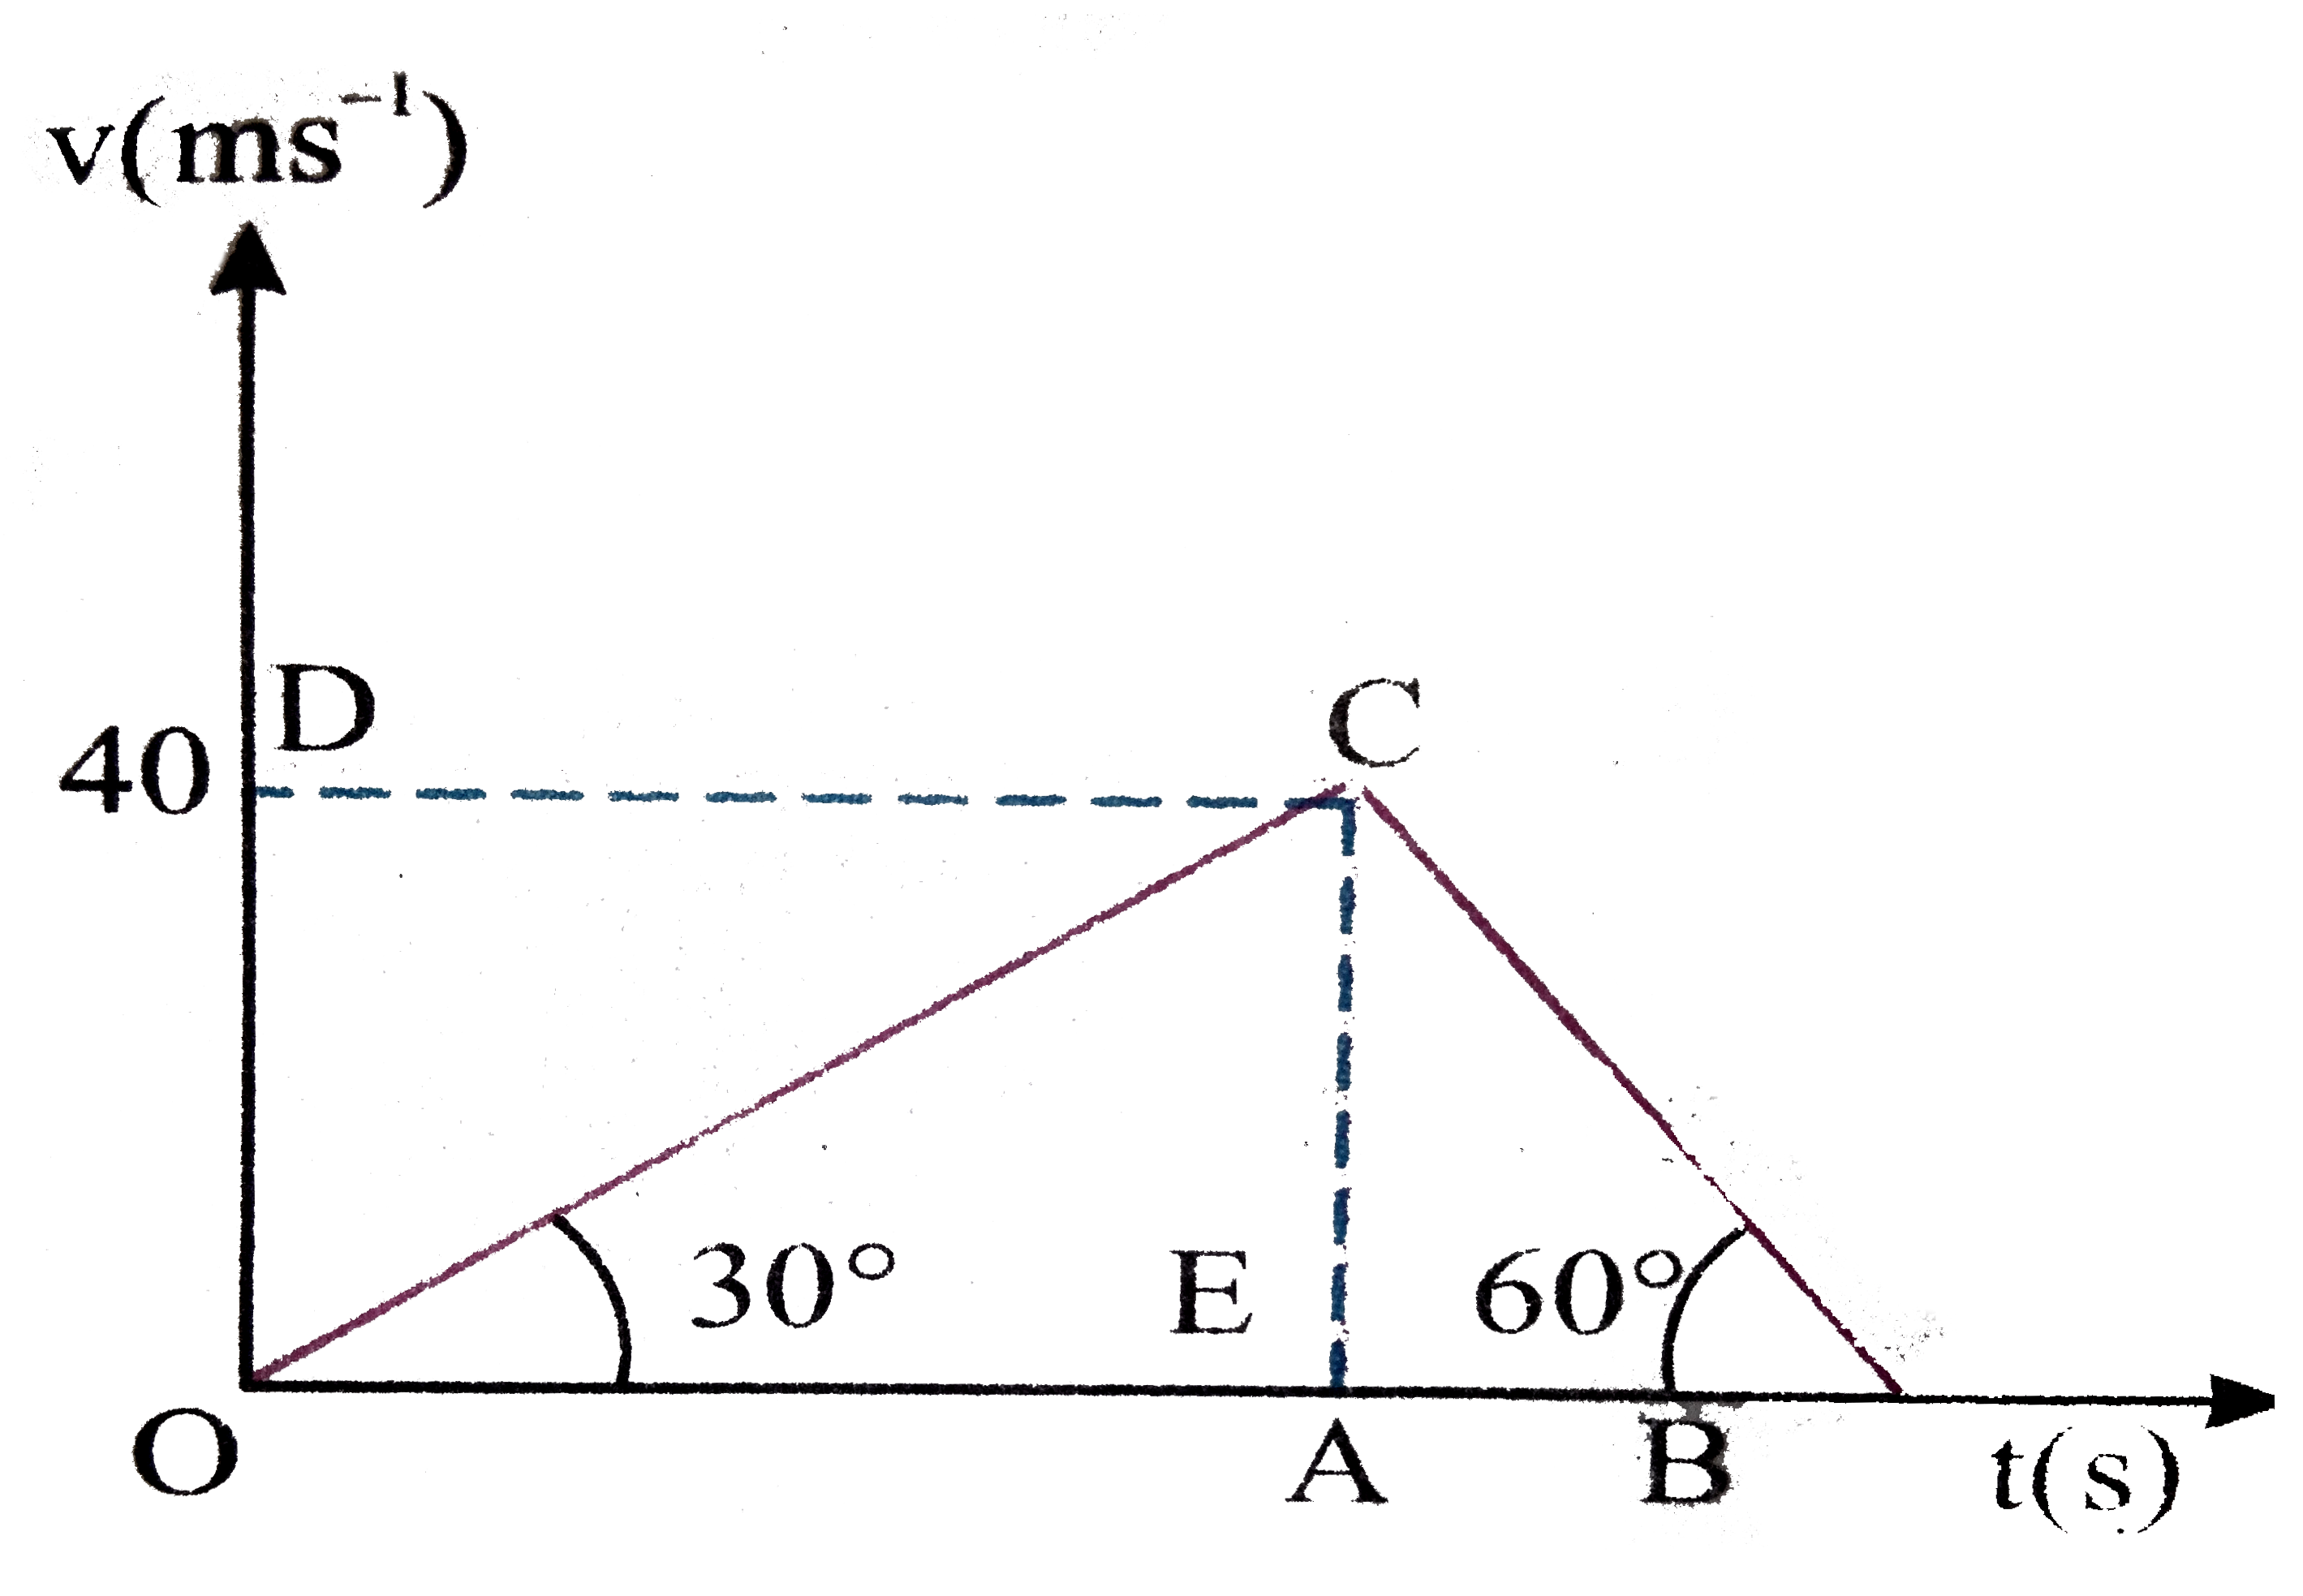
View SolutionThe velocity-time graph of a body is shown in figure. The ratio of magnitude of average acceleration during the intervals OA and AB is
View SolutionThe velocity − time graph of a particle is as shown in figure

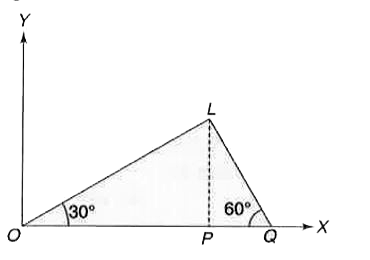
View SolutionThe velocity-time (v – t) graph of a body is shown in the figure. For the intervals OP and PQ, the ratio of the distances covered is
View Solution

