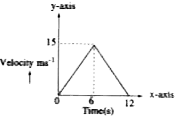
The velocity-time graph of a particle moving along a straight line is shown is Fing. The rate of acceleration and deceleration is constant and it is equal to 5ms−2. If the a average velocity during the motion is 20ms−1, Then  .
.
The distace travelled with uniform velcoty is .
375 m
125m
300m
450m
The correct Answer is:a
25(20−t)=25×15=375m.
Topper's Solved these Questions
- KINEMATICS-1Book:CENGAGE PHYSICS ENGLISHChapter:KINEMATICS-1Exercise:Integer
Explore 9 Videos
- KINEMATICS-1Book:CENGAGE PHYSICS ENGLISHChapter:KINEMATICS-1Exercise:Assertion-reasoning
Explore 5 Videos
- GRAVITATIONBook:CENGAGE PHYSICS ENGLISHChapter:GRAVITATIONExercise:INTEGER_TYPE
Explore 1 Video
- KINEMATICS-2Book:CENGAGE PHYSICS ENGLISHChapter:KINEMATICS-2Exercise:Exercise Integer
Explore 9 Videos
Similar Questions
The velocity-time graph of a particle moving along a straight line is shown is . The rate of acceleration and deceleration is constant and it is equal to 5ms−2. If the a average velocity during the motion is 20ms−1, Then
 .
.
The value of t is.
View SolutionThe velocity-time graph of a particle moving along a straight line is shown is Fig. The rate of acceleration and deceleration is constant and it is equal to 5ms−2. If the a average velocity during the motion is 20ms−1, Then
 .
.
The maximum velocity of the particle is .
View SolutionThe velocity-time graph of a particle moving along a straight line is shown is Fig. The rate of acceleration and deceleration is constant and it is equal to 5ms−2. If the a average velocity during the motion is 20ms−1, Then
 .
.
The maximum velocity of the particle is .
View Solution
The velocity displacement graph of a particle moving along a straight line is shown in figure.
Then the acceleration displacement graph is.
View SolutionThe velocity –position graph of a particle moving along a straight line is shown. Then acceleration of the particle at s = 15 m is :
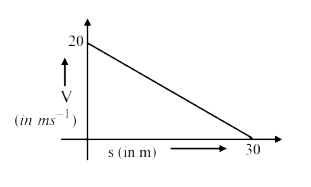
View SolutionThe velocity - displacement graph of a particle moving along a straight line is shown
The most suitable acceleration - displacement graph will be

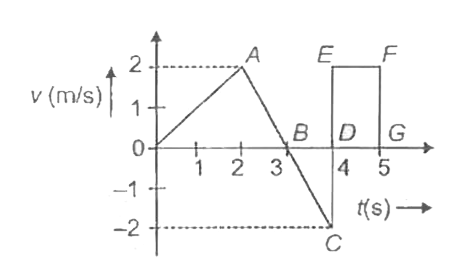
View SolutionThe velocity - time graph of a particle moving along a straight line is shown in the figure given below
The displacement of the particle in 5 second is
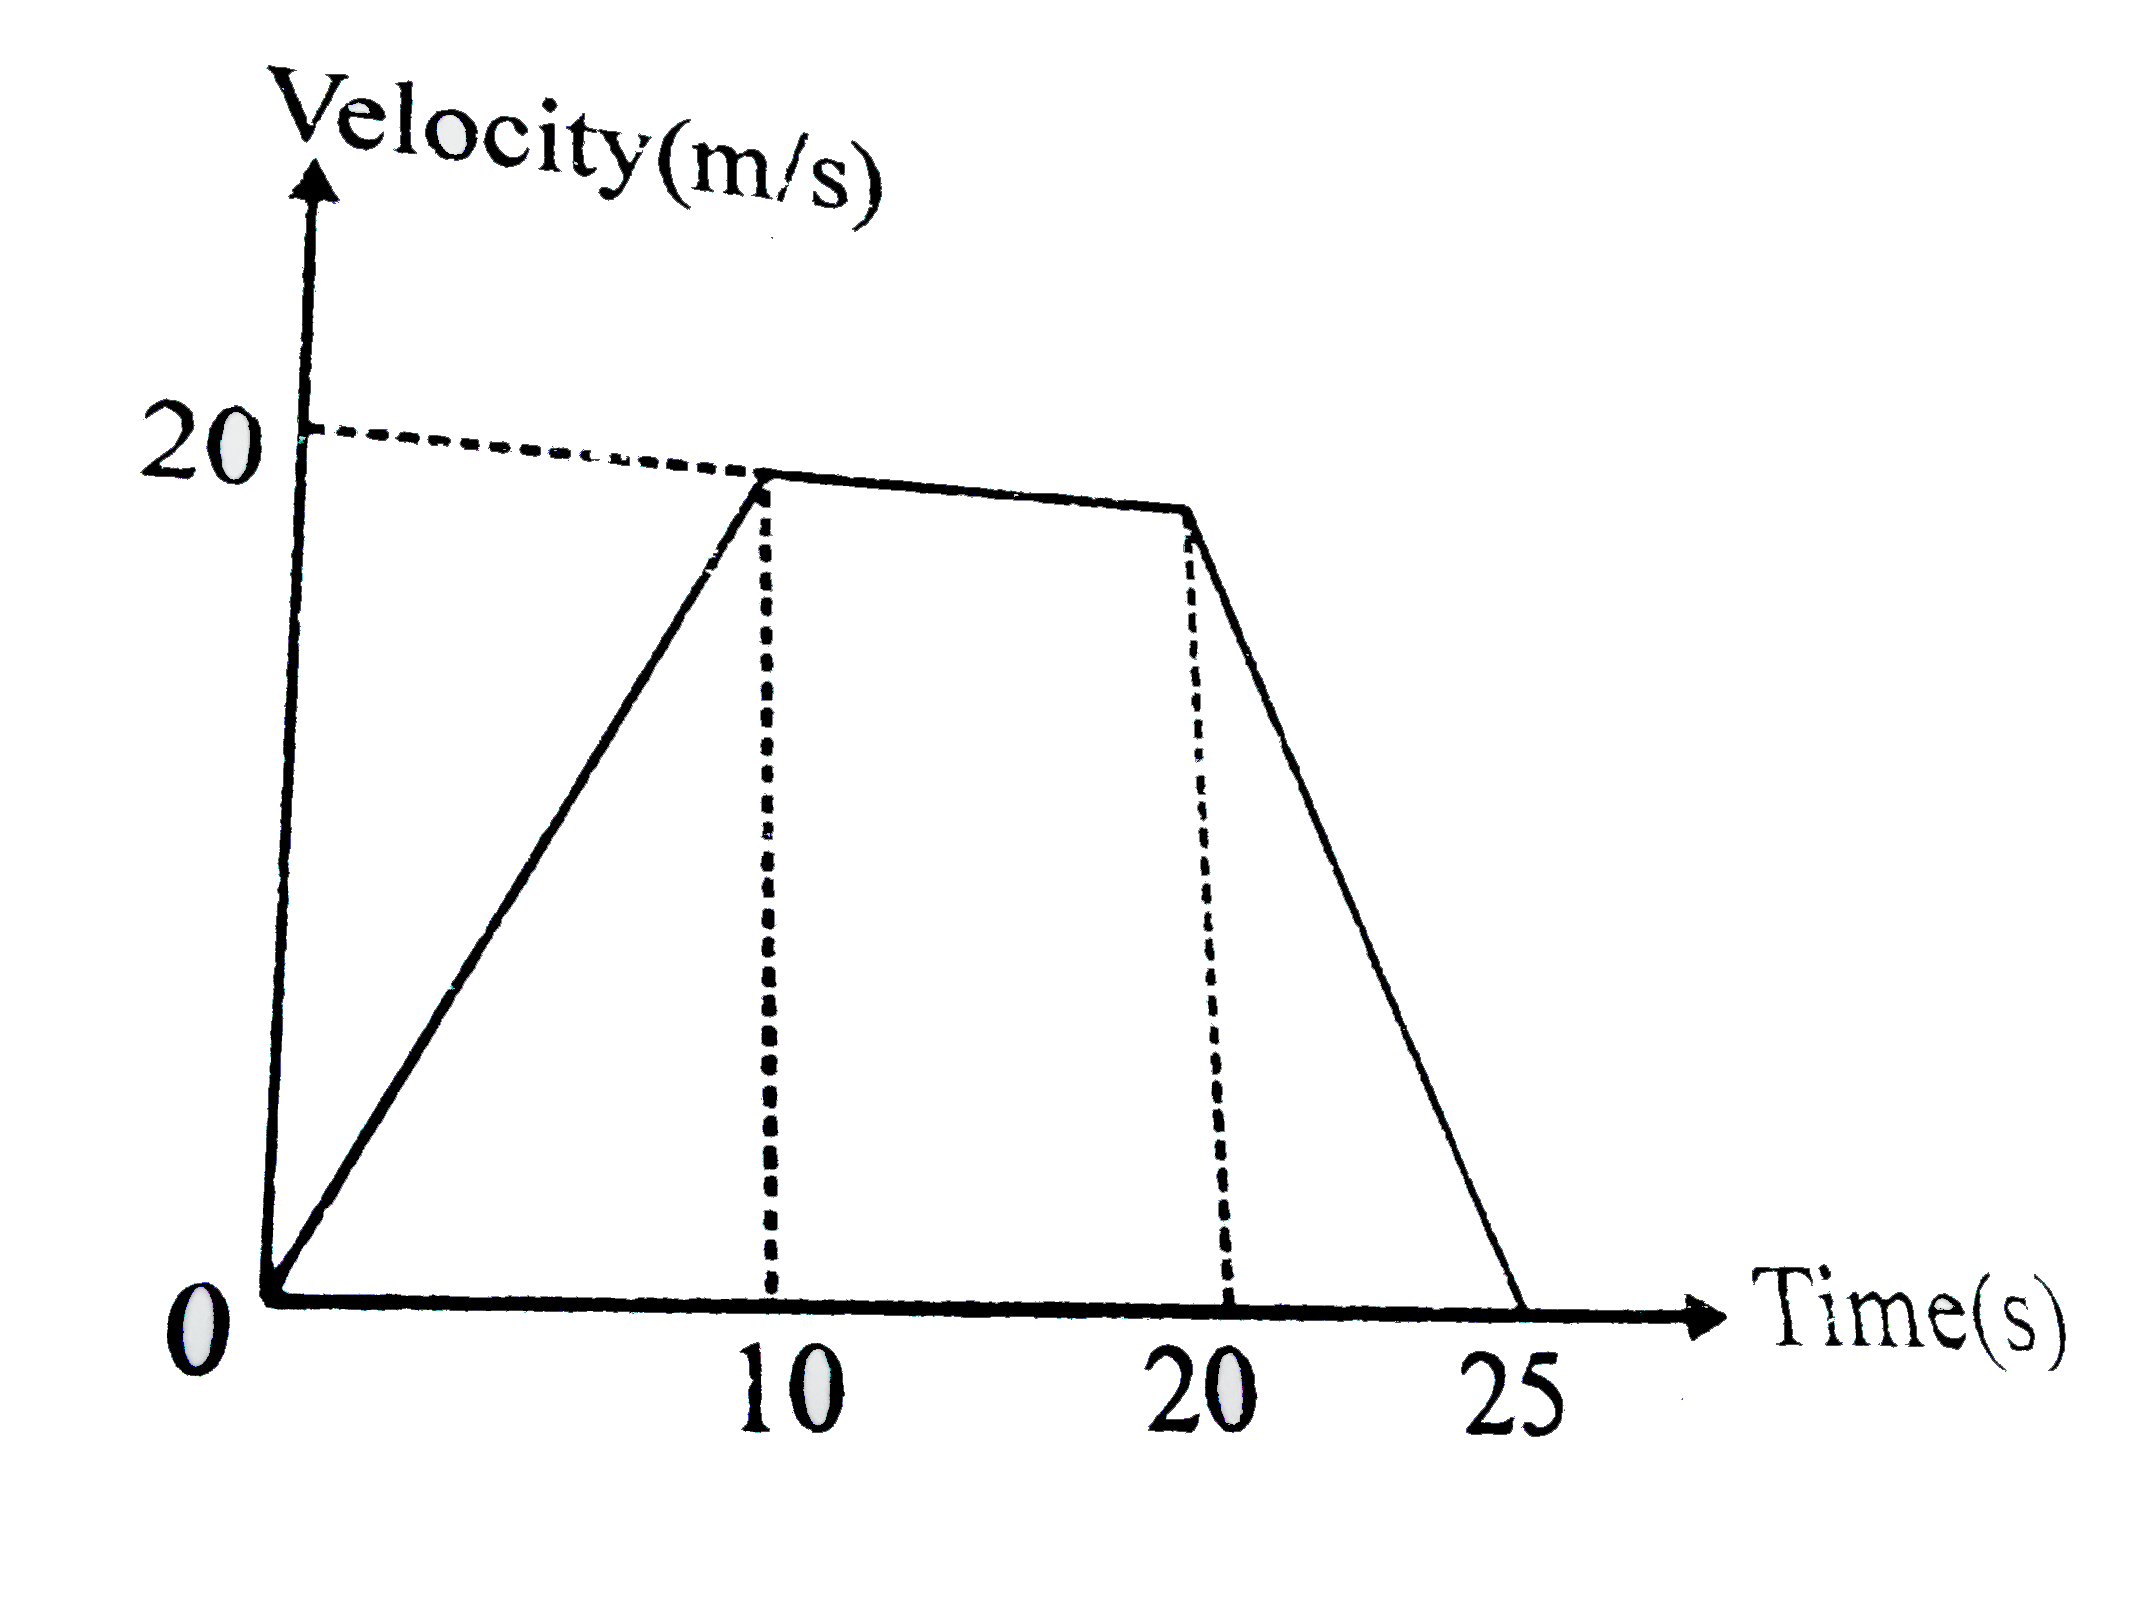
View SolutionThe velocity-time graph of a car moving along a straight road is shown in figure. The average velocity of the car in first 25 seconds is
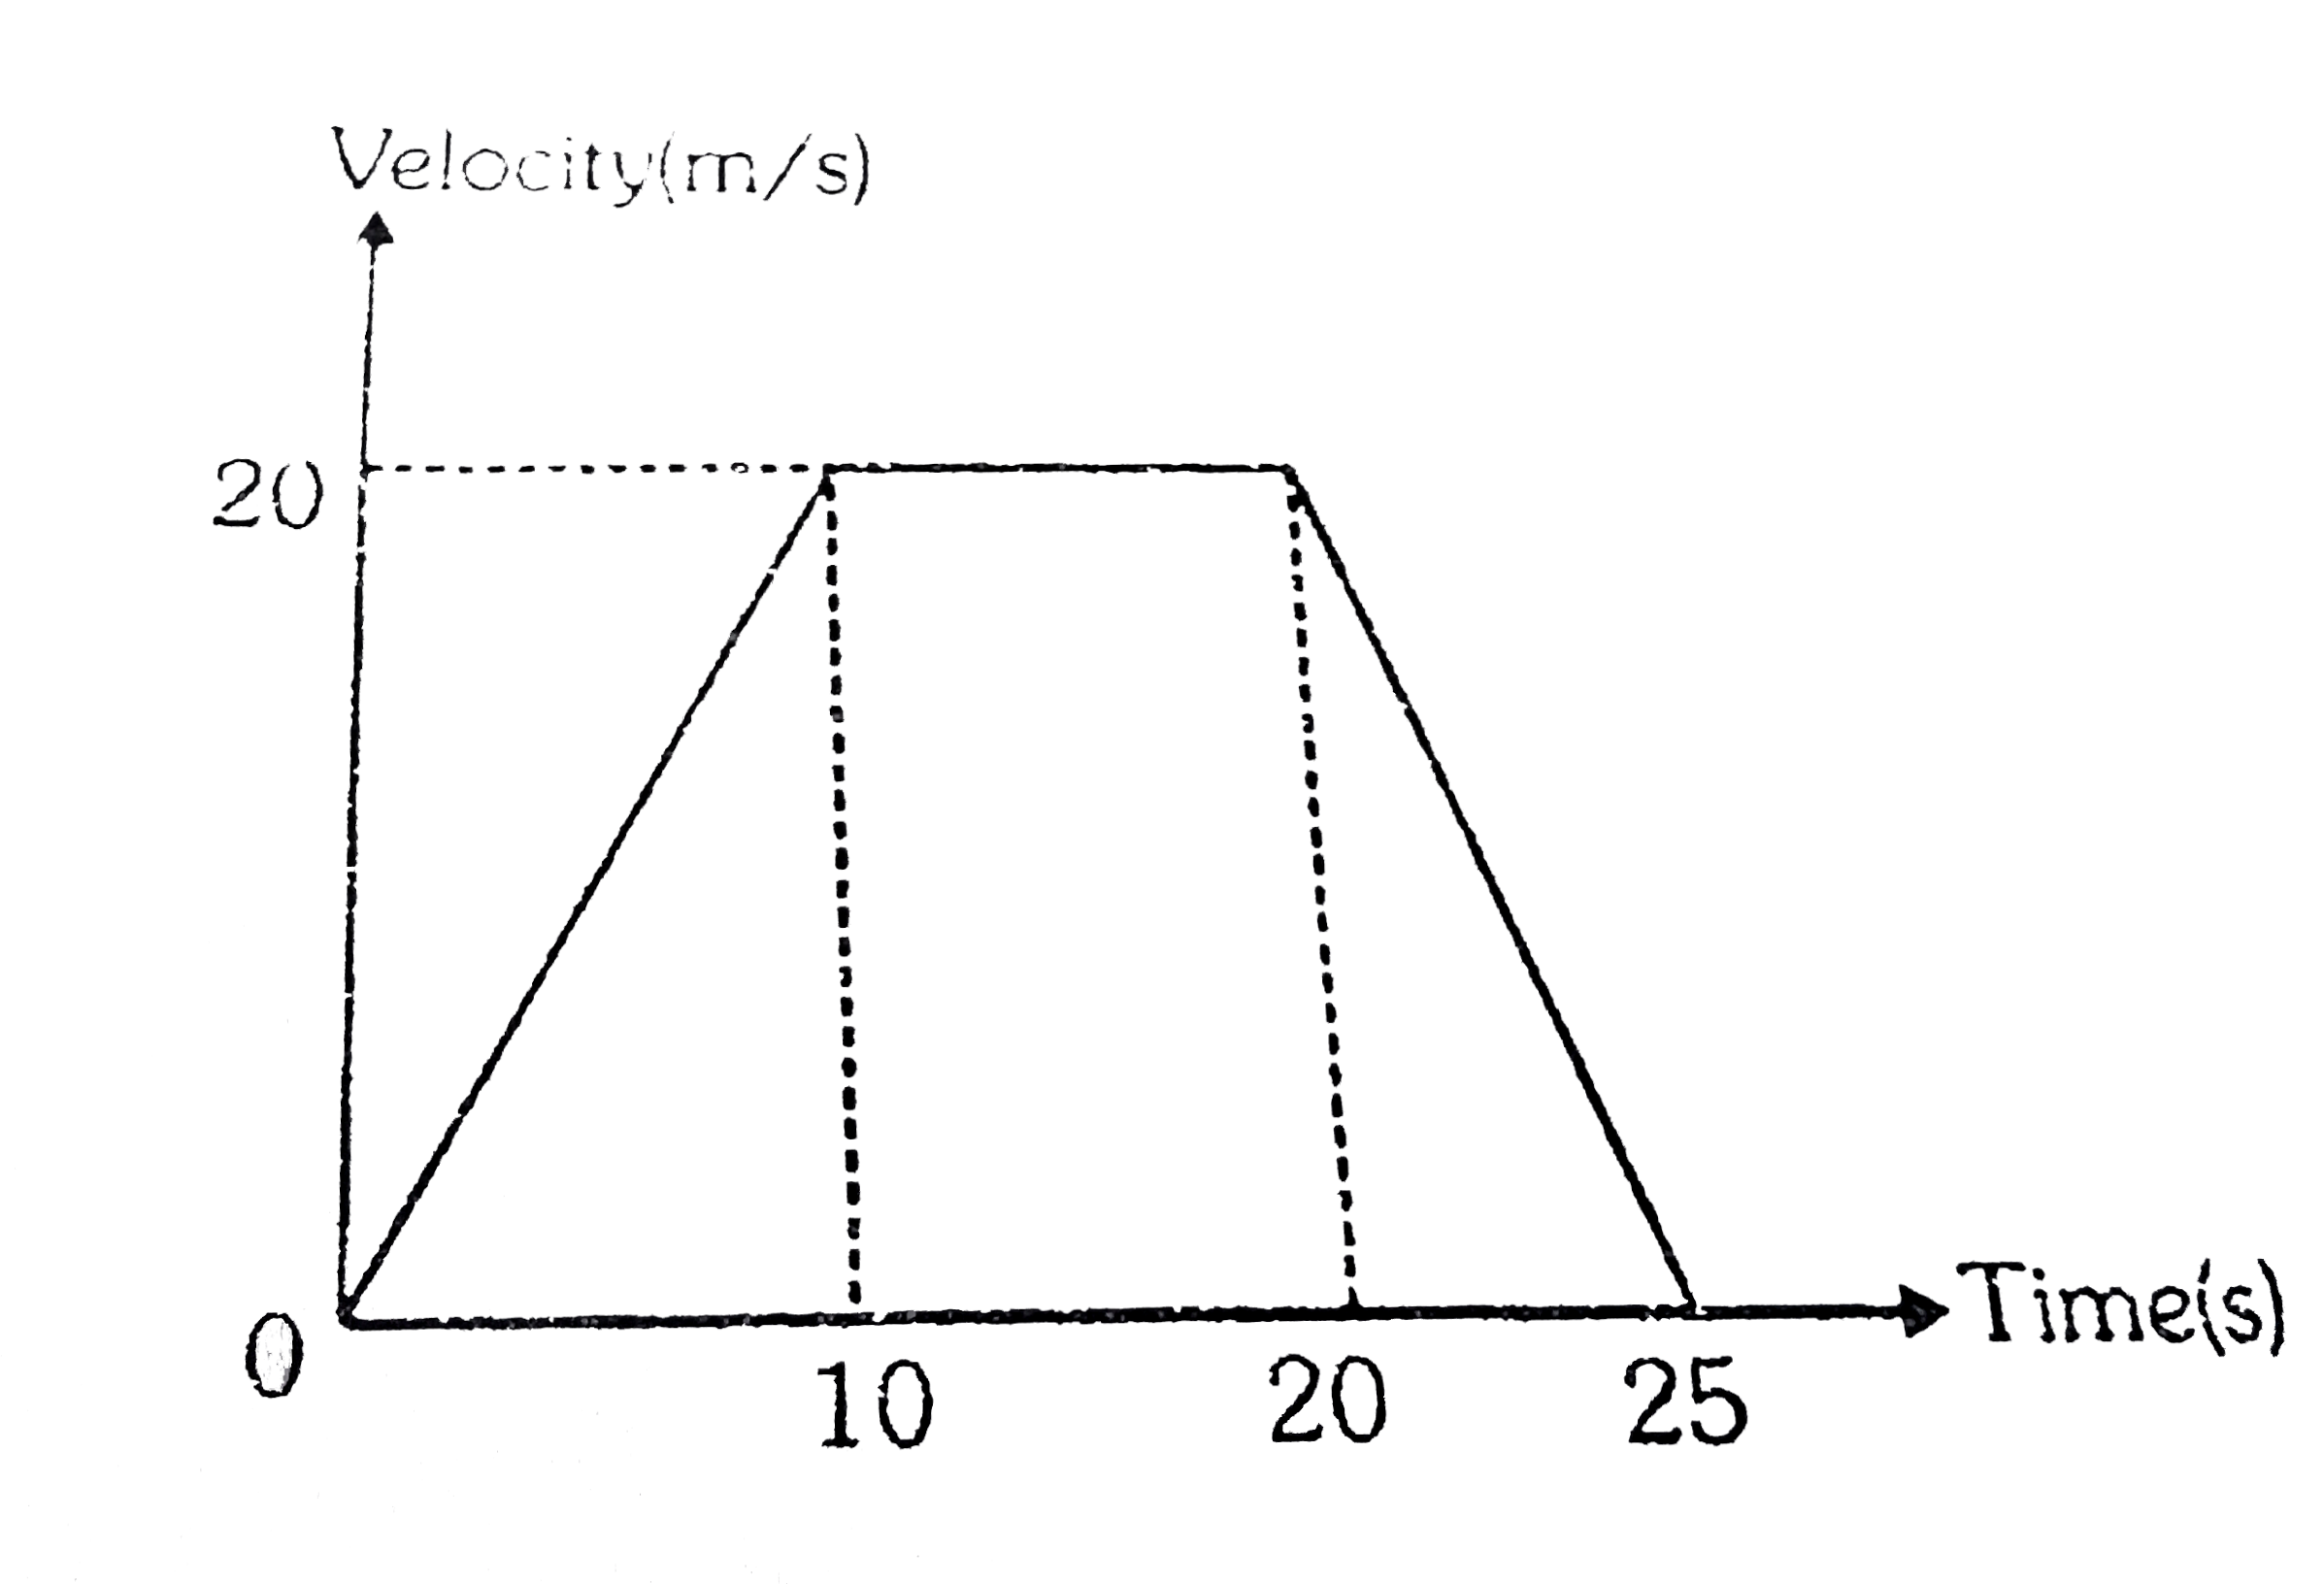
View SolutionThe velocity-time graph of a car moving along a straight road is shown in figure. The average velocity of the car is first 25 seconds is
View SolutionThe velocity and time graph for a particle moving in a straight line s shown in the figure. Then, the average velocity between t=4 s and t=6 s is _____
View Solution