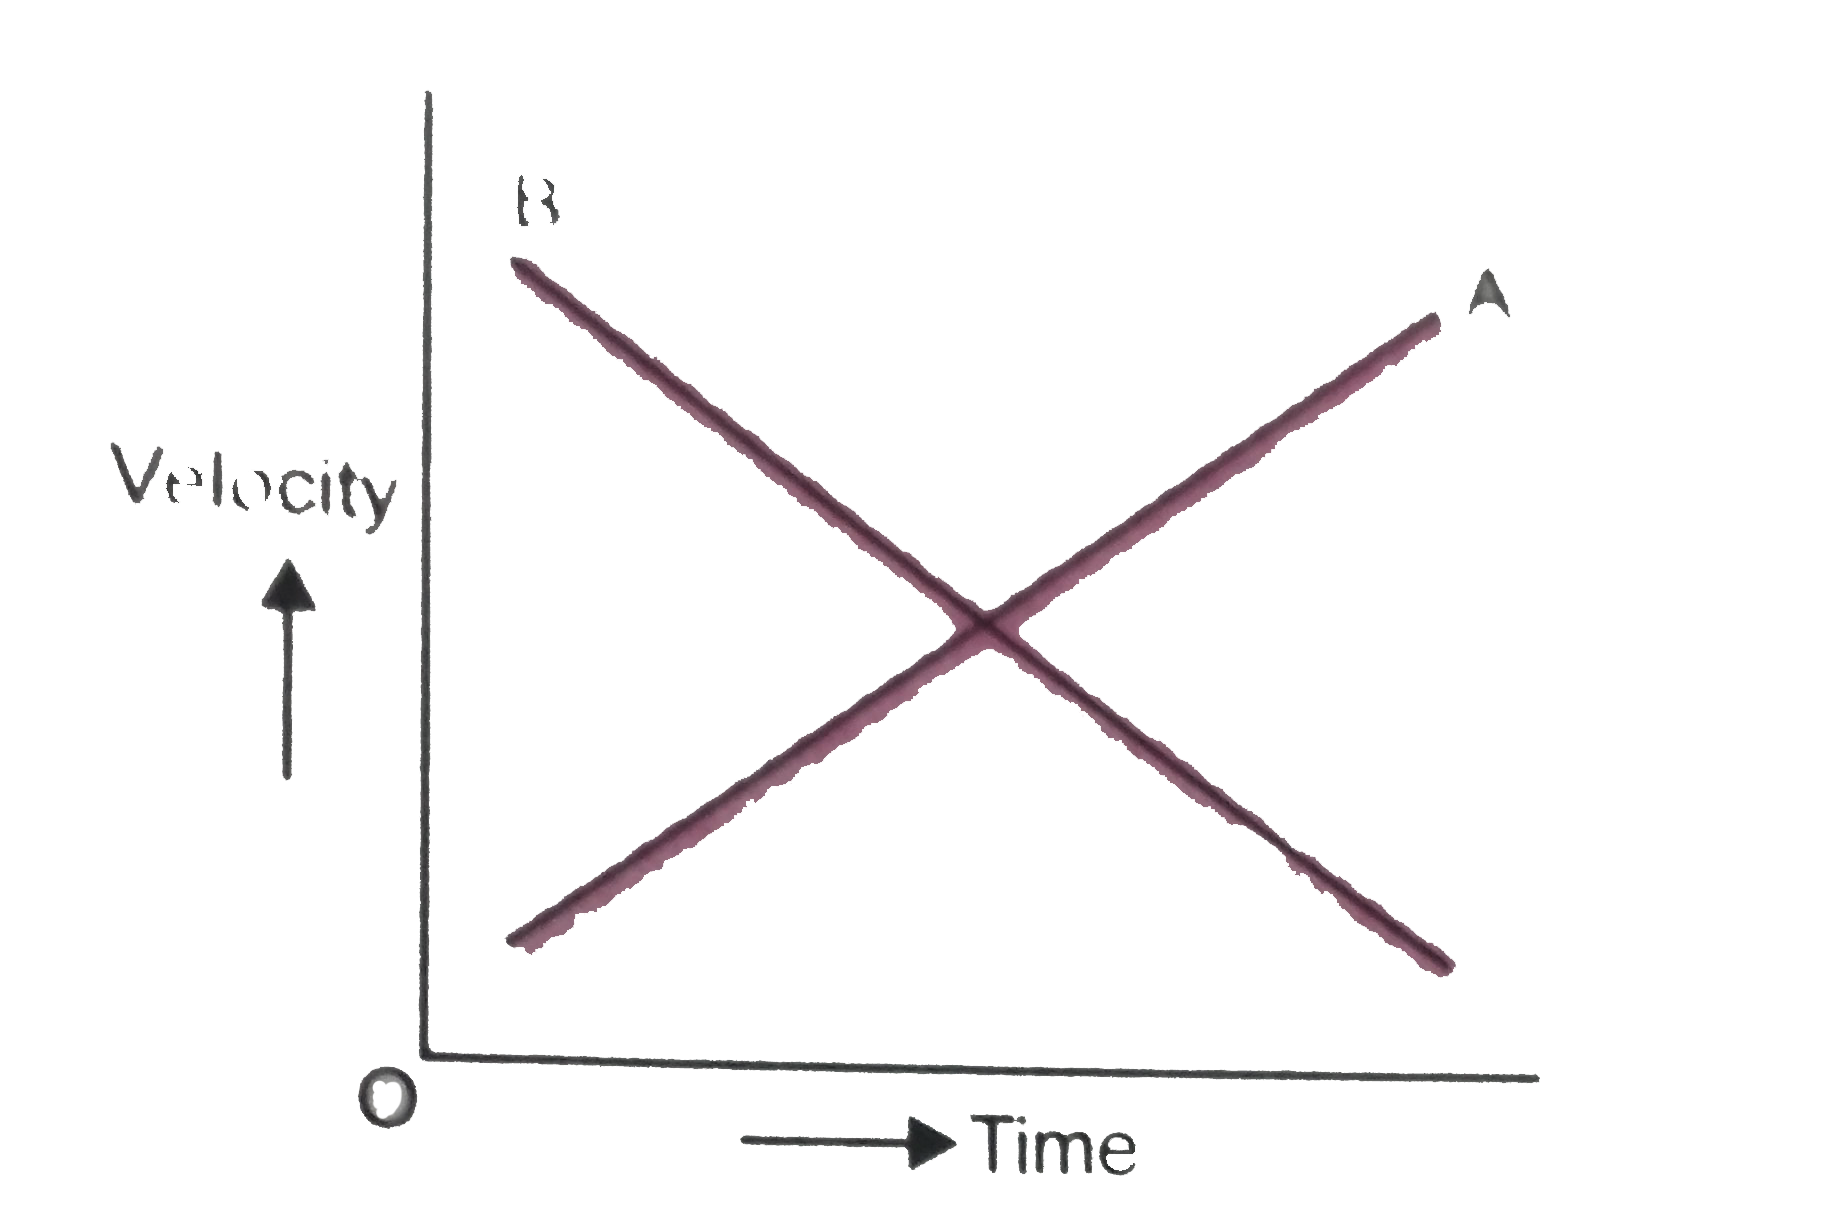
The velocity - time graph of two bodies A and B is shown in figure. Choose correct statement.
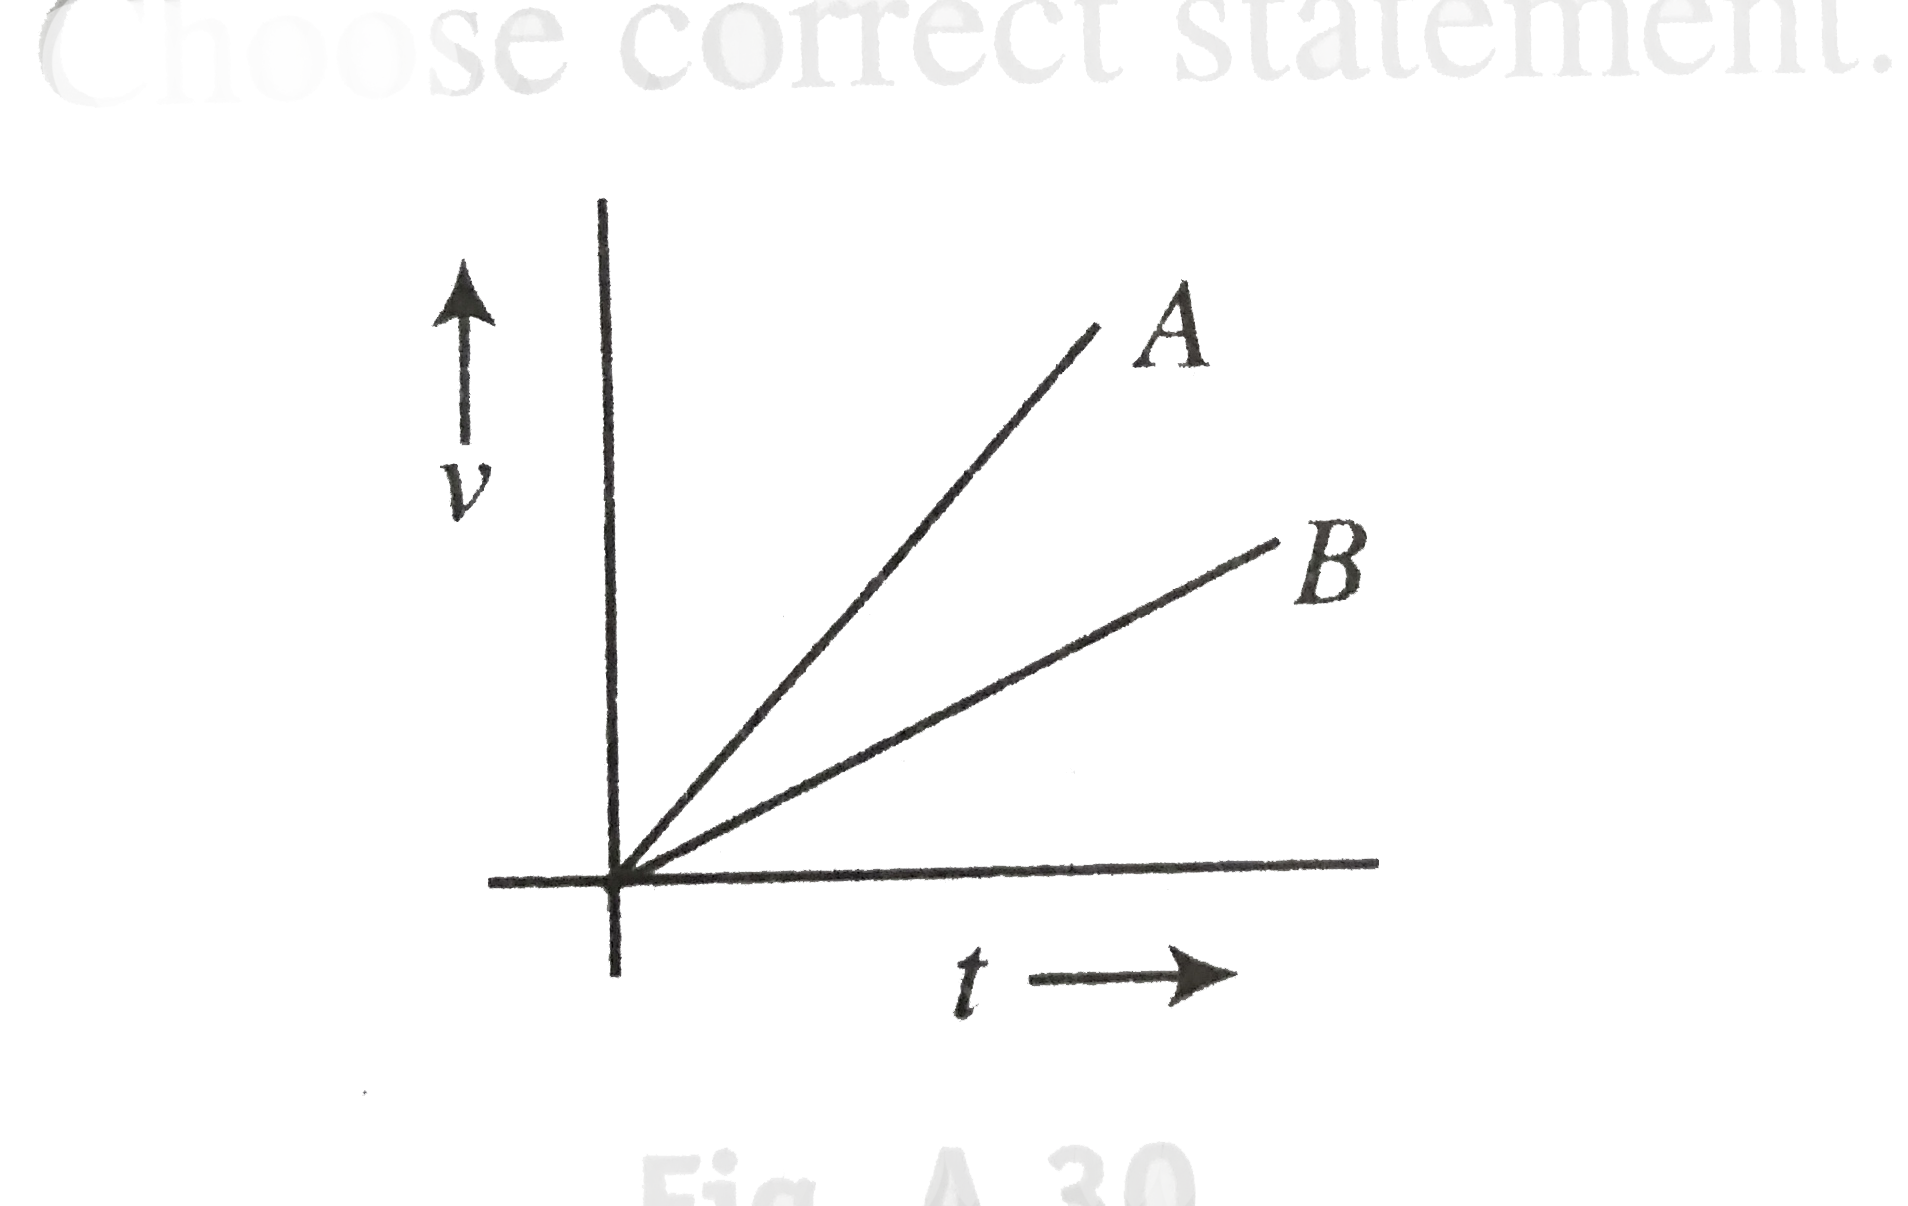
acceleration of Bgt acceleration of A
acceleration of A gt acceleration of B
both are starting from same point
A covers greater distance than B in the same time.
The correct Answer is:B, D
b,d. Slope of A is greater than slope of B.
∴aA>aB
S=12at2⟨.u=0)
∴SA>SB.
Topper's Solved these Questions
- MISCELLANEOUS KINEMATICSBOOK - CENGAGE PHYSICSCHAPTER - MISCELLANEOUS KINEMATICSEXERCISE - Linked Comprehension Type
35 Videos
- MISCELLANEOUS KINEMATICSBOOK - CENGAGE PHYSICSCHAPTER - MISCELLANEOUS KINEMATICSEXERCISE - Integer Type
17 Videos
- MISCELLANEOUS KINEMATICSBOOK - CENGAGE PHYSICSCHAPTER - MISCELLANEOUS KINEMATICSEXERCISE - Interger type
3 Videos
- LINEAR AND ANGULAR SIMPLE HARMONIC MOTIONBOOK - CENGAGE PHYSICSCHAPTER - LINEAR AND ANGULAR SIMPLE HARMONIC MOTIONEXERCISE - Multiple Correct Answer Type
9 Videos
- MISCELLANEOUS VOLUME 2BOOK - CENGAGE PHYSICSCHAPTER - MISCELLANEOUS VOLUME 2EXERCISE - INTEGER_TYPE
10 Videos
Similar Questions
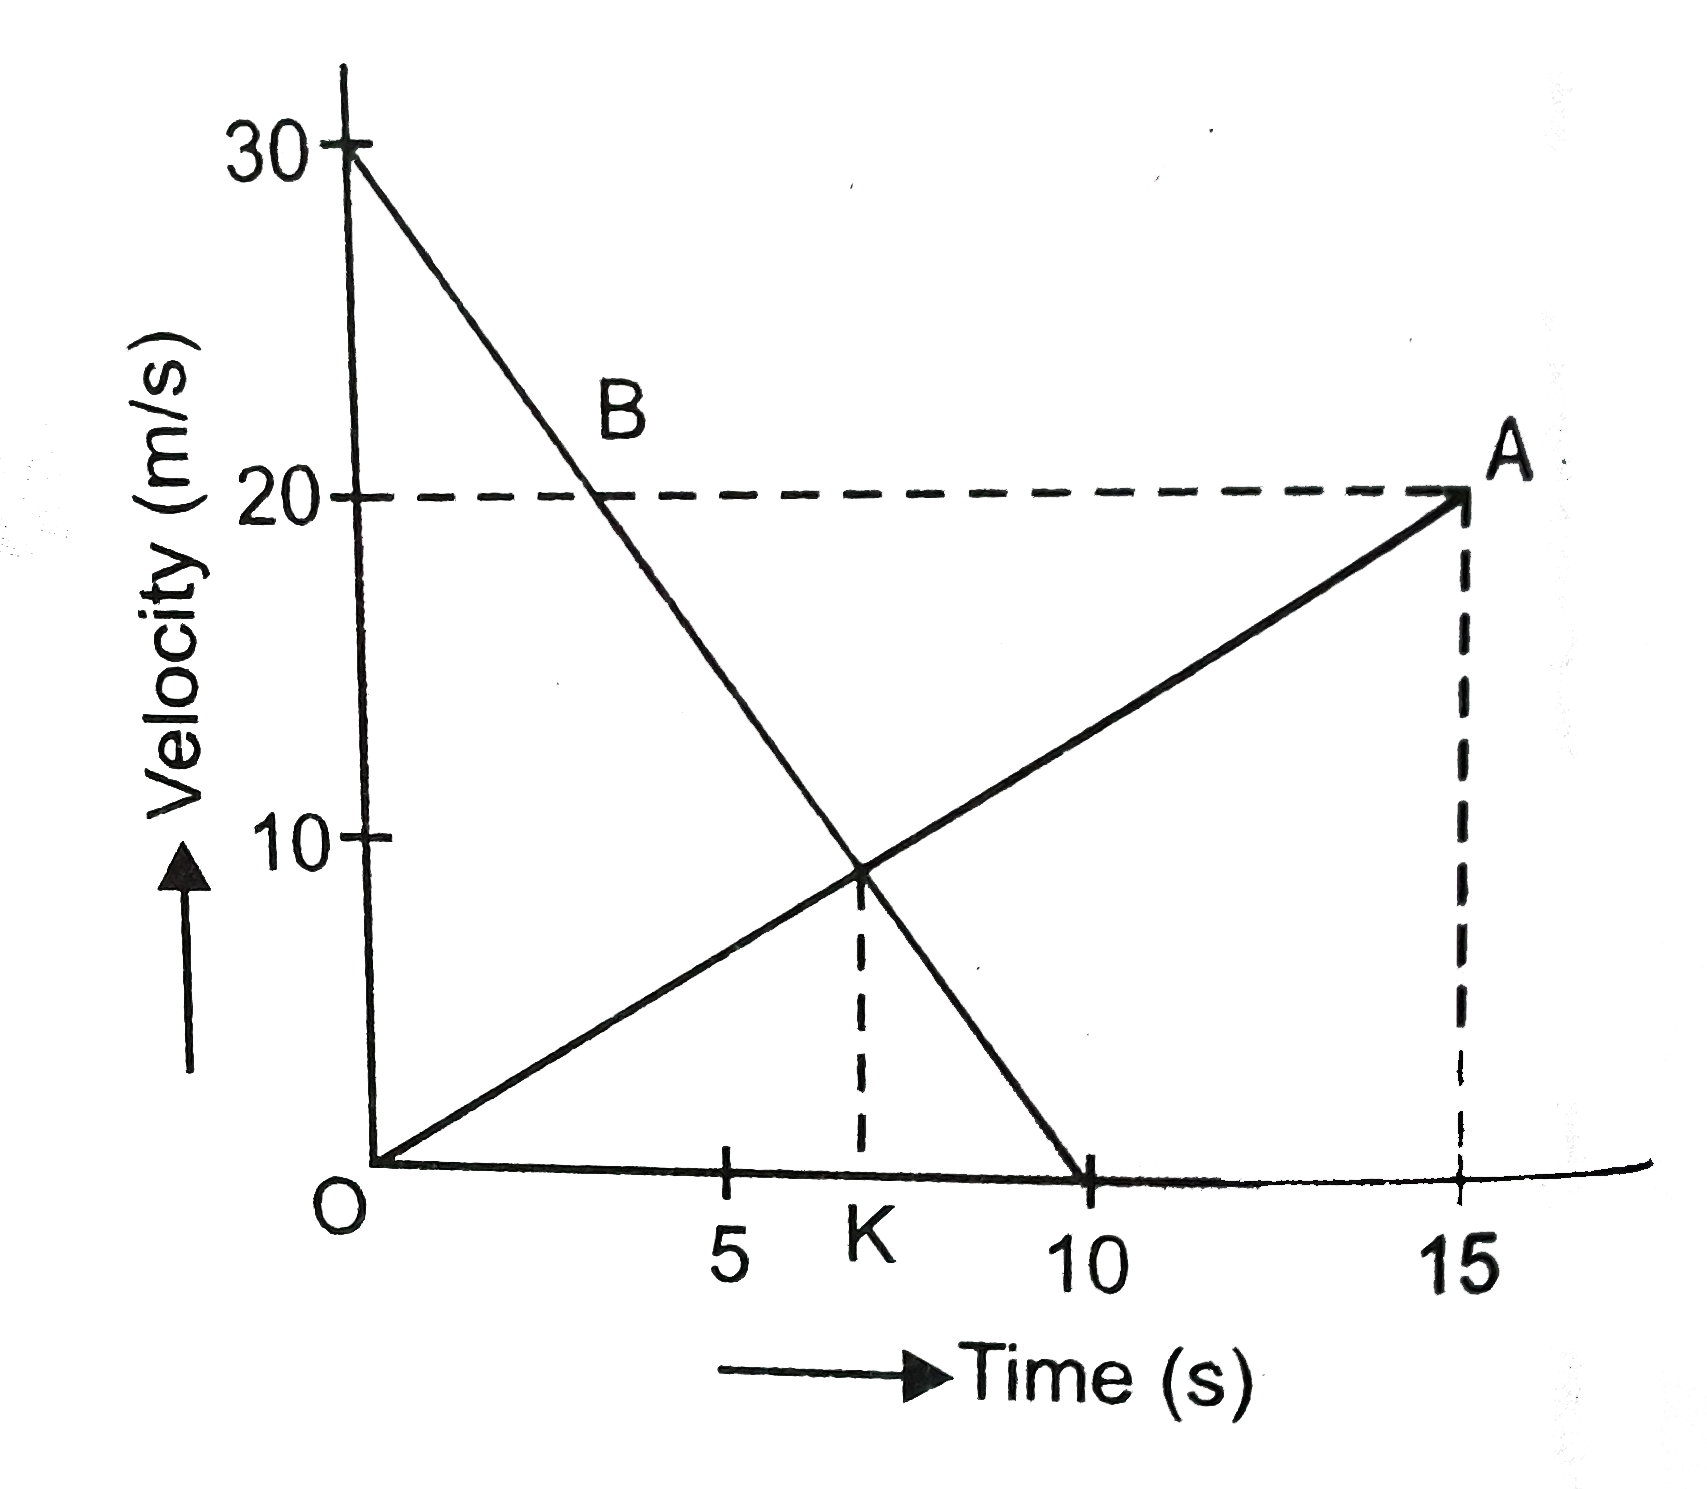
The velocity time graphs of two bodies A and B are shown in Figure. Observe these graphs carefully and answer the following questions :
(i) From the shape of graphs, what is nature of motion of A and B
(ii) What do you infer from the slopes of the graphs ?
(iii) What are the initial velocities of A and B ?
(iv) What is acceleration of A ?
(v) What is acceleration of B ?
(vi) What distance is travelled by B before coming to rest ?
(vii) At what time will the two bodies have equal velocity ?
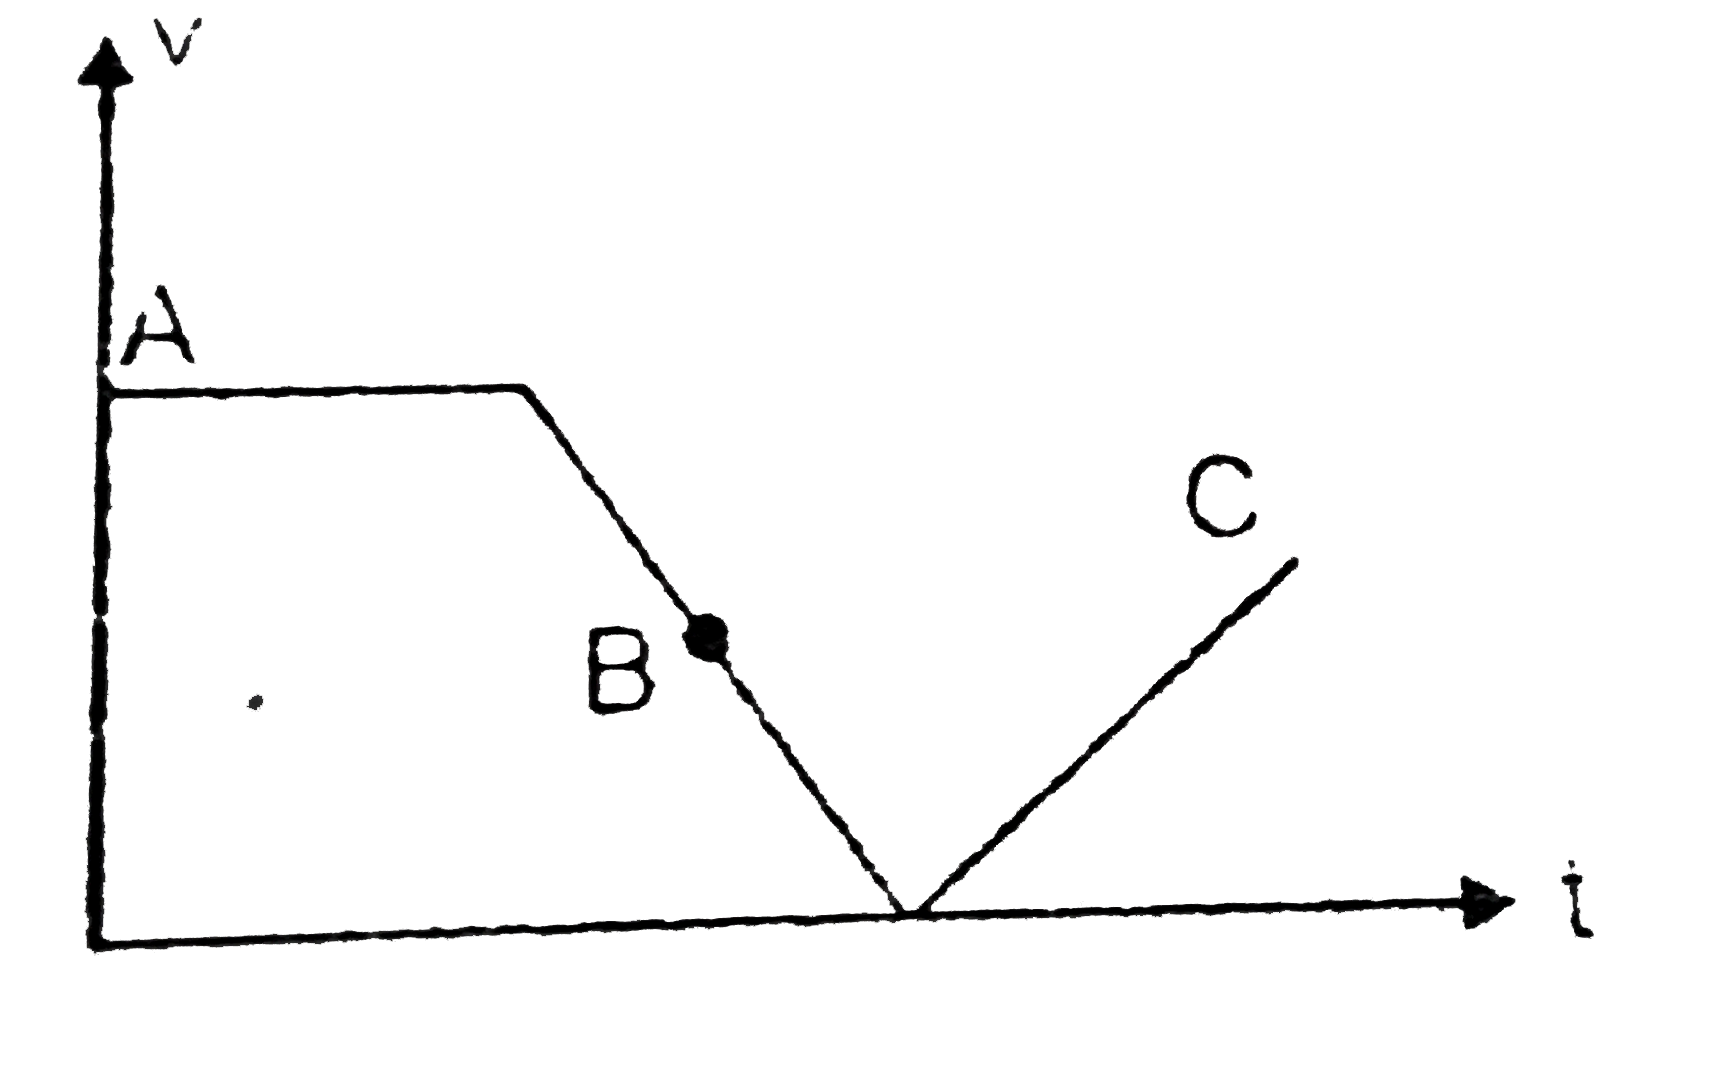
View SolutionThe velocity time graph of a body is shown in fig. it indicates that :
View Solution
Knowledge Check
The velocity - time graph for two bodies A and B are shown in figure. Then, the acceleration of A and B are in the ratio
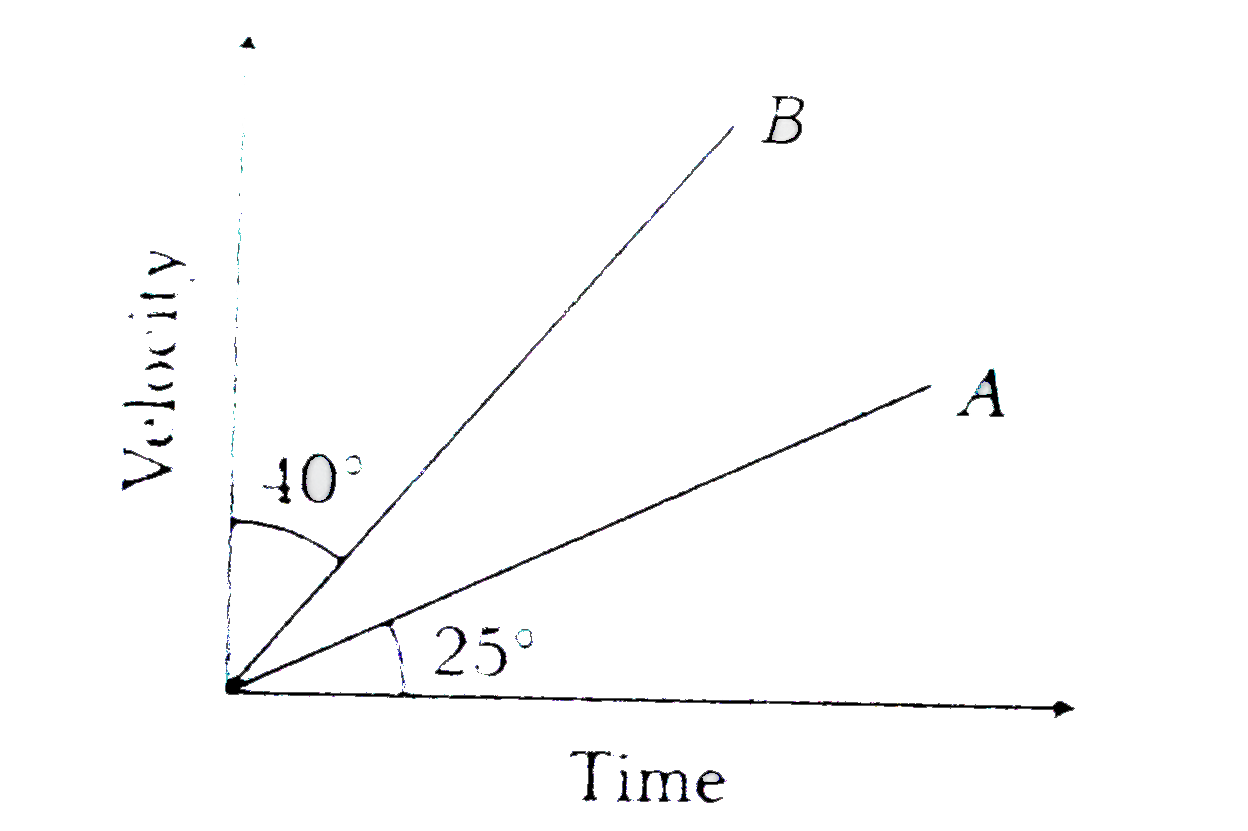 Asin25∘ to sin50∘Btan25∘ to tan40∘Ccos25∘ to cos50∘Dtan25∘ to tan50∘
The velocity − time graph of a particle is as shown in figure
 AIt moves with a constant acceleration throughoutBIt moves with an acceleration of constant magnitude but changing direction at the end of every two secondCThe displacement of the particle is zeroDThe velocity becomes zero at t=4 second
The displacement time graphs of two bodies A and B are shown in figure. The ratio of velocity of A to velocity of B,vA/vB is:
 A1√3B√3C13D3
(a) Look at the velocity time graph of two bodies AandB, Figure. which body starts from rest and which body has some initial velocity ?
(b) From Figure, which body is having greater acceleration ?
View Solution(a) The velocity time graph of two bodies are shown in Figure. Slope of the graph for body A is positive. What does it signify ?
(b) The slope of velocity time graph of body B is negative. What does it represent ?
View SolutionIf velocity-time graph of a body is as shown in figure, what is the nature of motion ?
View SolutionCircuit as shown in figure below, choose the correct statement

View SolutionThe figure shows a velocity-time graph of a particle moving along a straight line
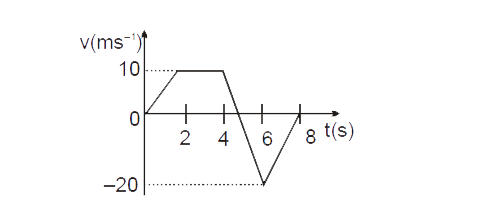
Choose the incorrect statement. The particle comes to rest at
View Solution
