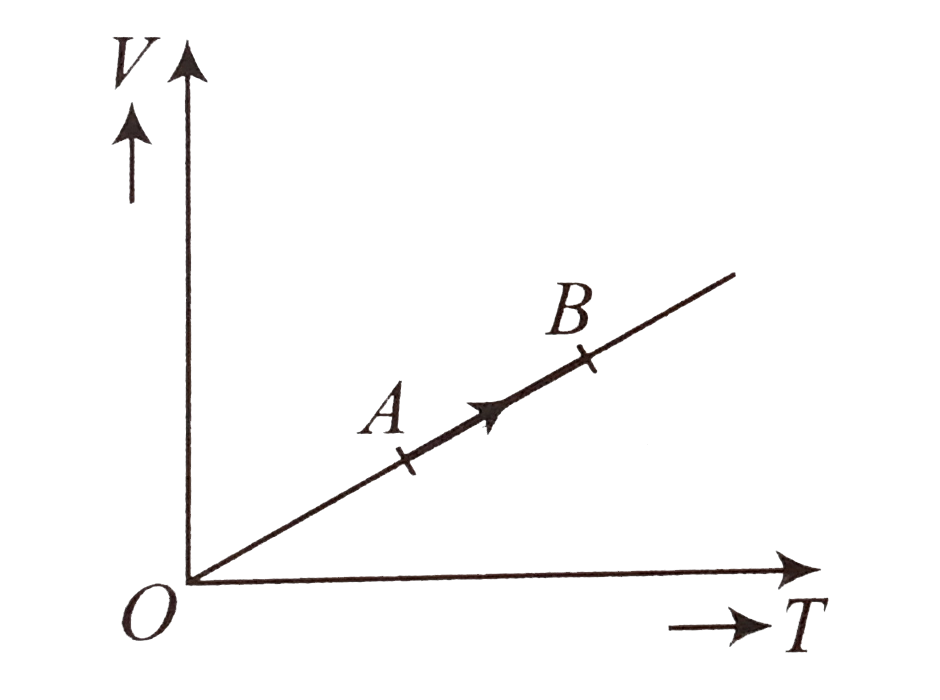
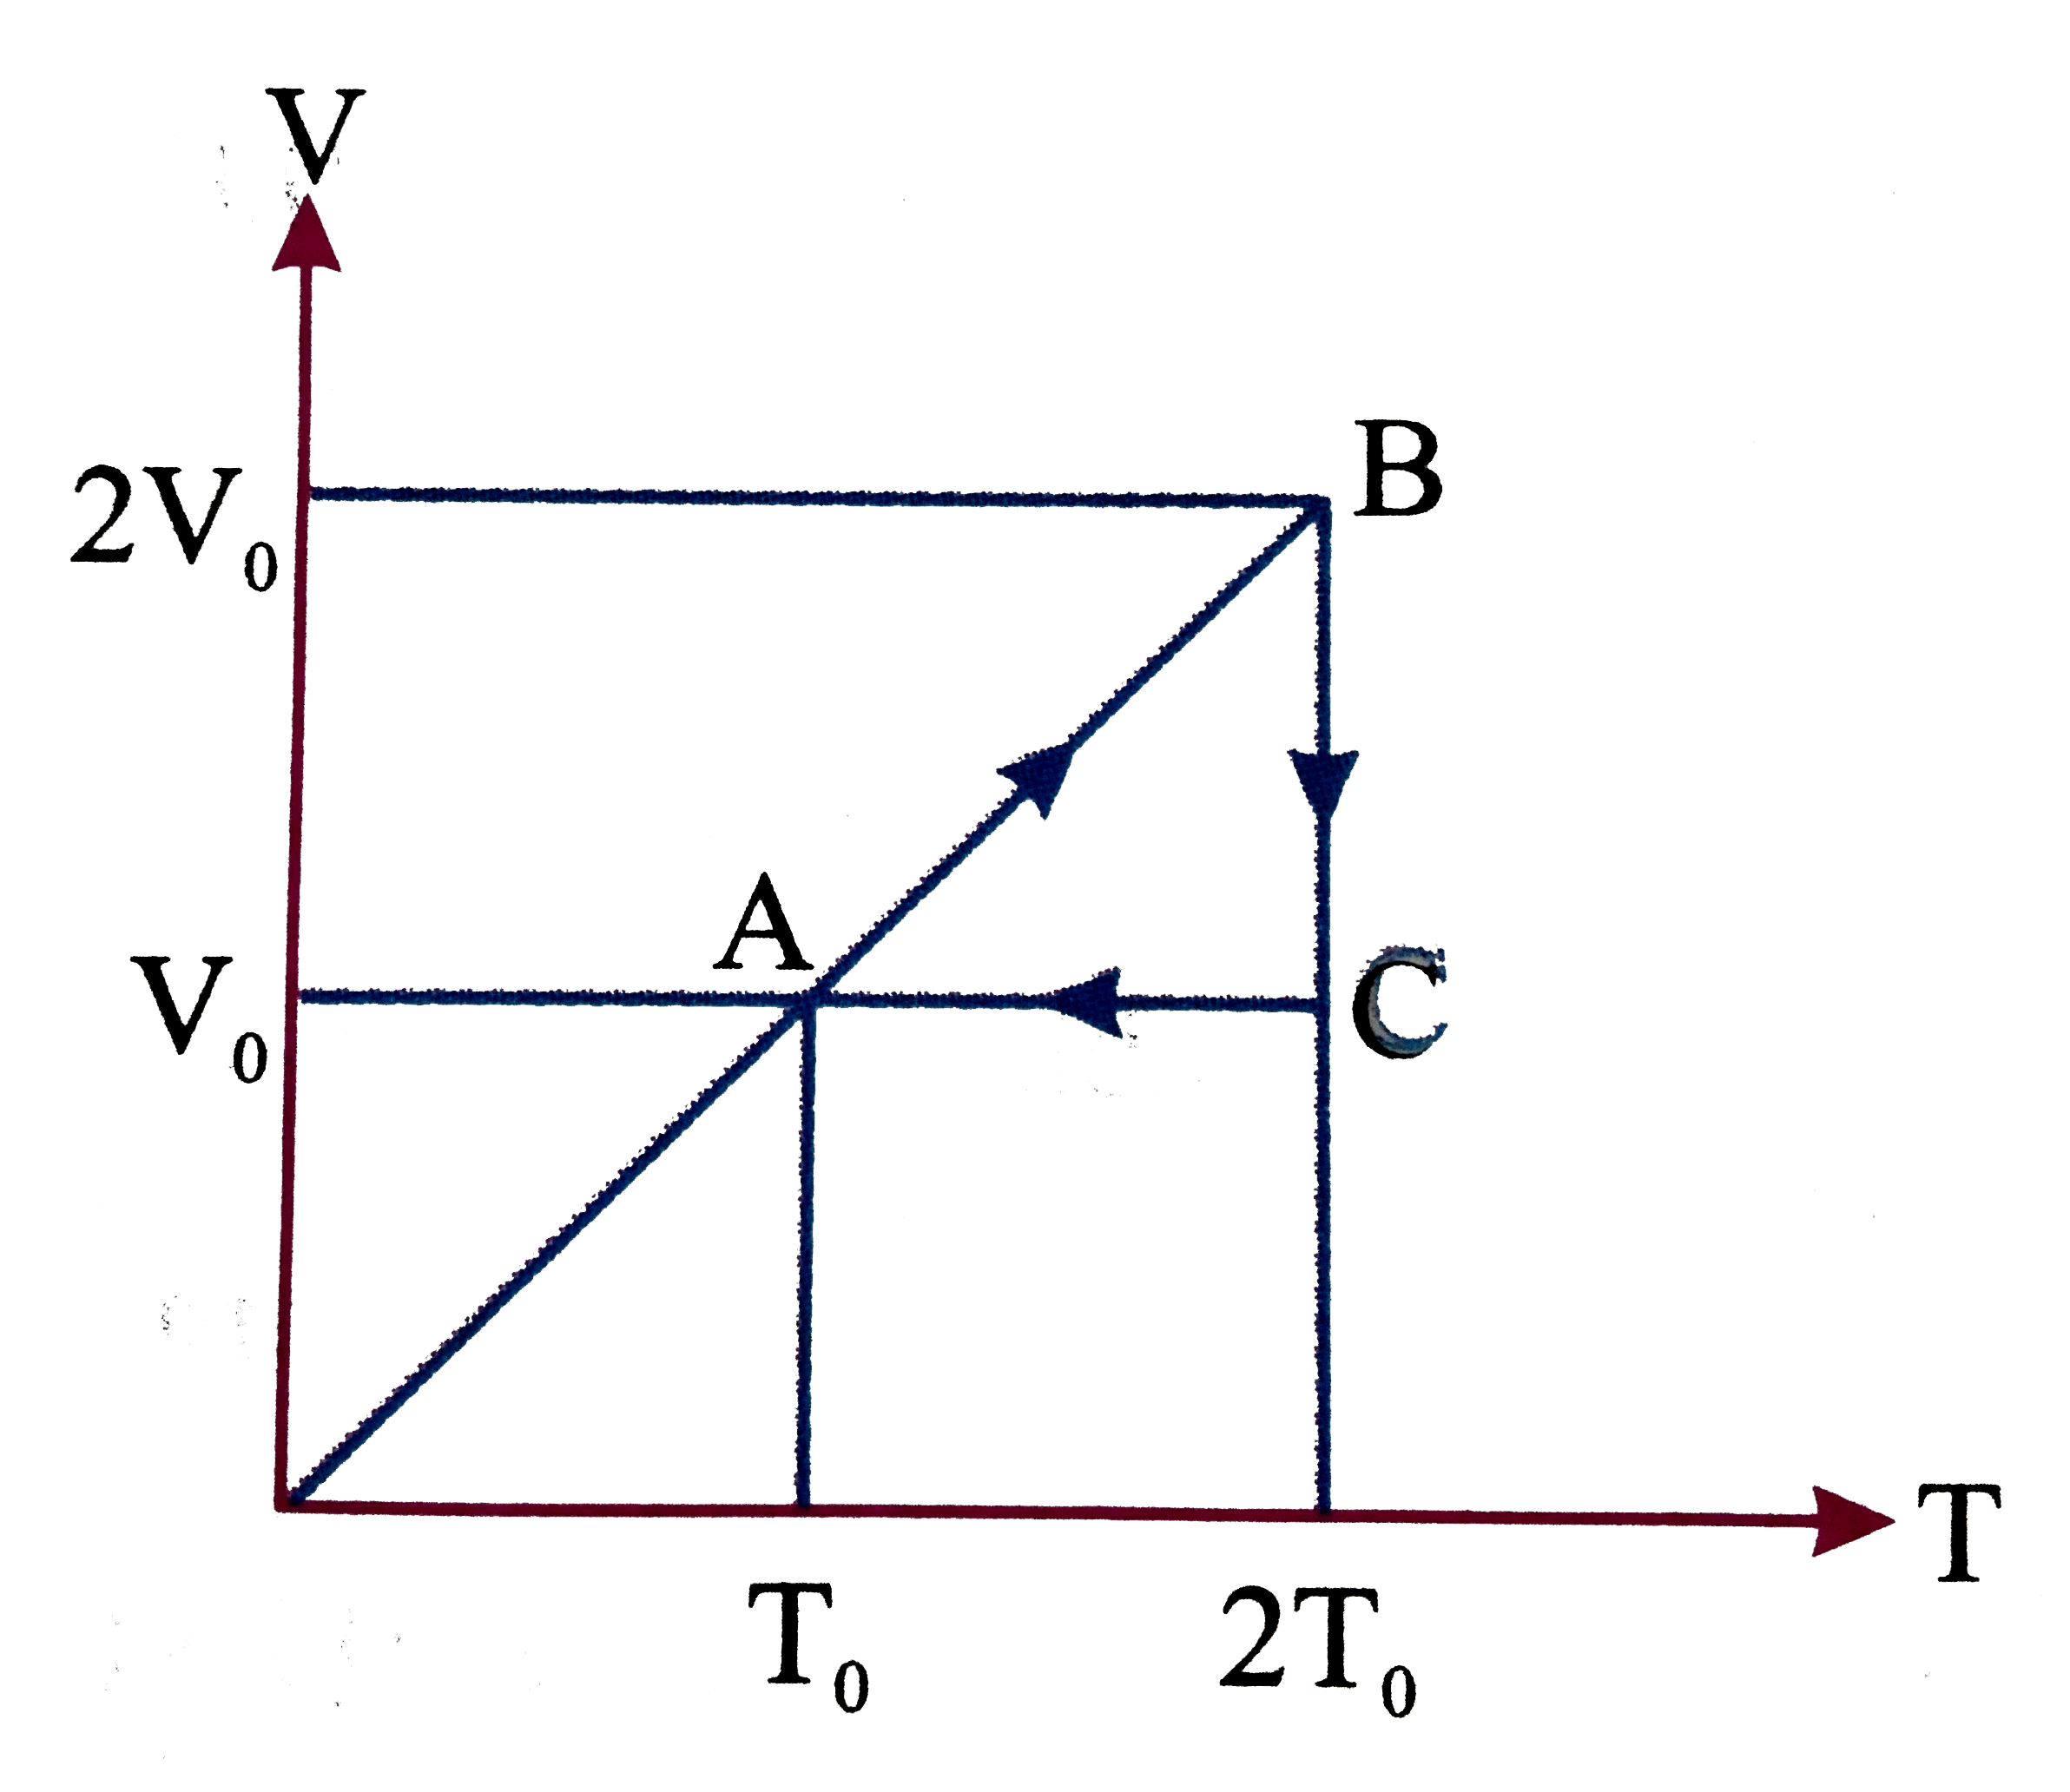
The volume (V) of a monatomic gas varies with its temperature (T) as shown in the graph. The ratio of work done by the gas, to the heat absorbed by it, when it undergoes a change from state A to state B,is
13
23
25
27
The correct Answer is:C
Step by step video, text & image solution for The volume (V) of a monatomic gas varies with its temperature (T) as shown in the graph. The ratio of work done by the gas, to the heat absorbed by it, when it undergoes a change from state A to state B,is by Physics experts to help you in doubts & scoring excellent marks in Class 11 exams.
Topper's Solved these Questions
- BOOK - DC PANDEYCHAPTER - SOLVD PAPERS 2017 NEET, AIIMS & JIPMEREXERCISE - Solved paper 2018(AIIMS)28videos
SOLVD PAPERS 2017 NEET, AIIMS & JIPMER
- BOOK - DC PANDEYCHAPTER - SOLVD PAPERS 2017 NEET, AIIMS & JIPMEREXERCISE - Solved paper 2018(JIPMER)38videos
SOLVD PAPERS 2017 NEET, AIIMS & JIPMER
- BOOK - DC PANDEYCHAPTER - SOLVD PAPERS 2017 NEET, AIIMS & JIPMEREXERCISE - Solved Papers 2017(JIPMER)28videos
SOLVD PAPERS 2017 NEET, AIIMS & JIPMER
- BOOK - DC PANDEYCHAPTER - SIMPLE HARMONIC MOTIONEXERCISE - Integer type questions14videos
SIMPLE HARMONIC MOTION
- BOOK - DC PANDEYCHAPTER - SOUND WAVESEXERCISE - Exercise 19.74videos
SOUND WAVES
Similar Questions
Knowledge Check
- Question 1 - Select One
The volume (V) of a moatomic gas varies with its temperature (T), as shown in the graph. The ratio of work done by the gas, to the heat absorbed by it, when it undergoes a change from state A to state B, is
 A25B23C13D27
 - Question 2 - Select One
The volume (V) of a monatomic gas varies with its temperature (T) as shown in the graph. The ratio of work done by the gas, to the heat absorbed by it, when it undergoes a change from state A to state B,is
 A13B23C25D27
 - Question 3 - Select One
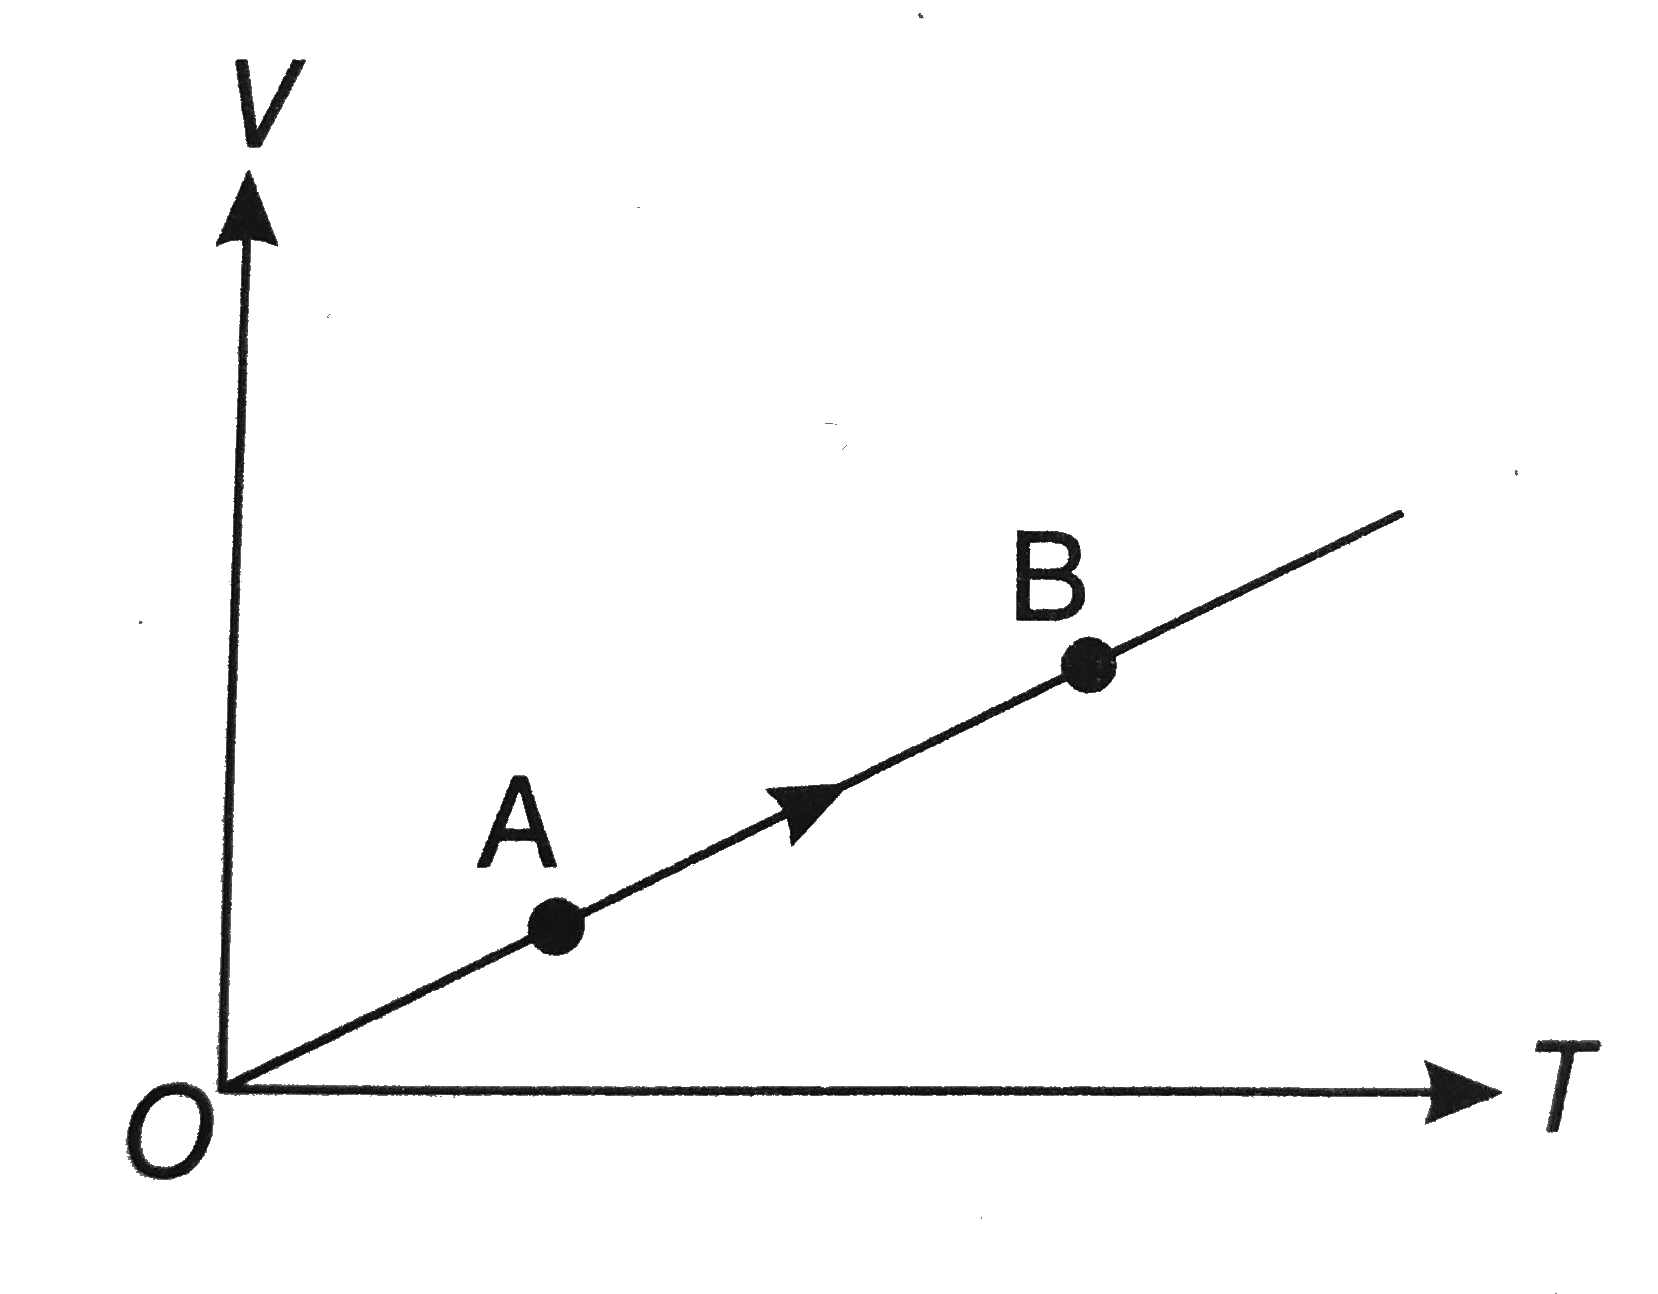
The volume (V) of a manatomic gas varies with its temperature (T) , as shown in the graph. The ratio of work done by the gas, to the heat absorbed by it, when it undergoes a change from state A to B , is
 A27B25C13D23
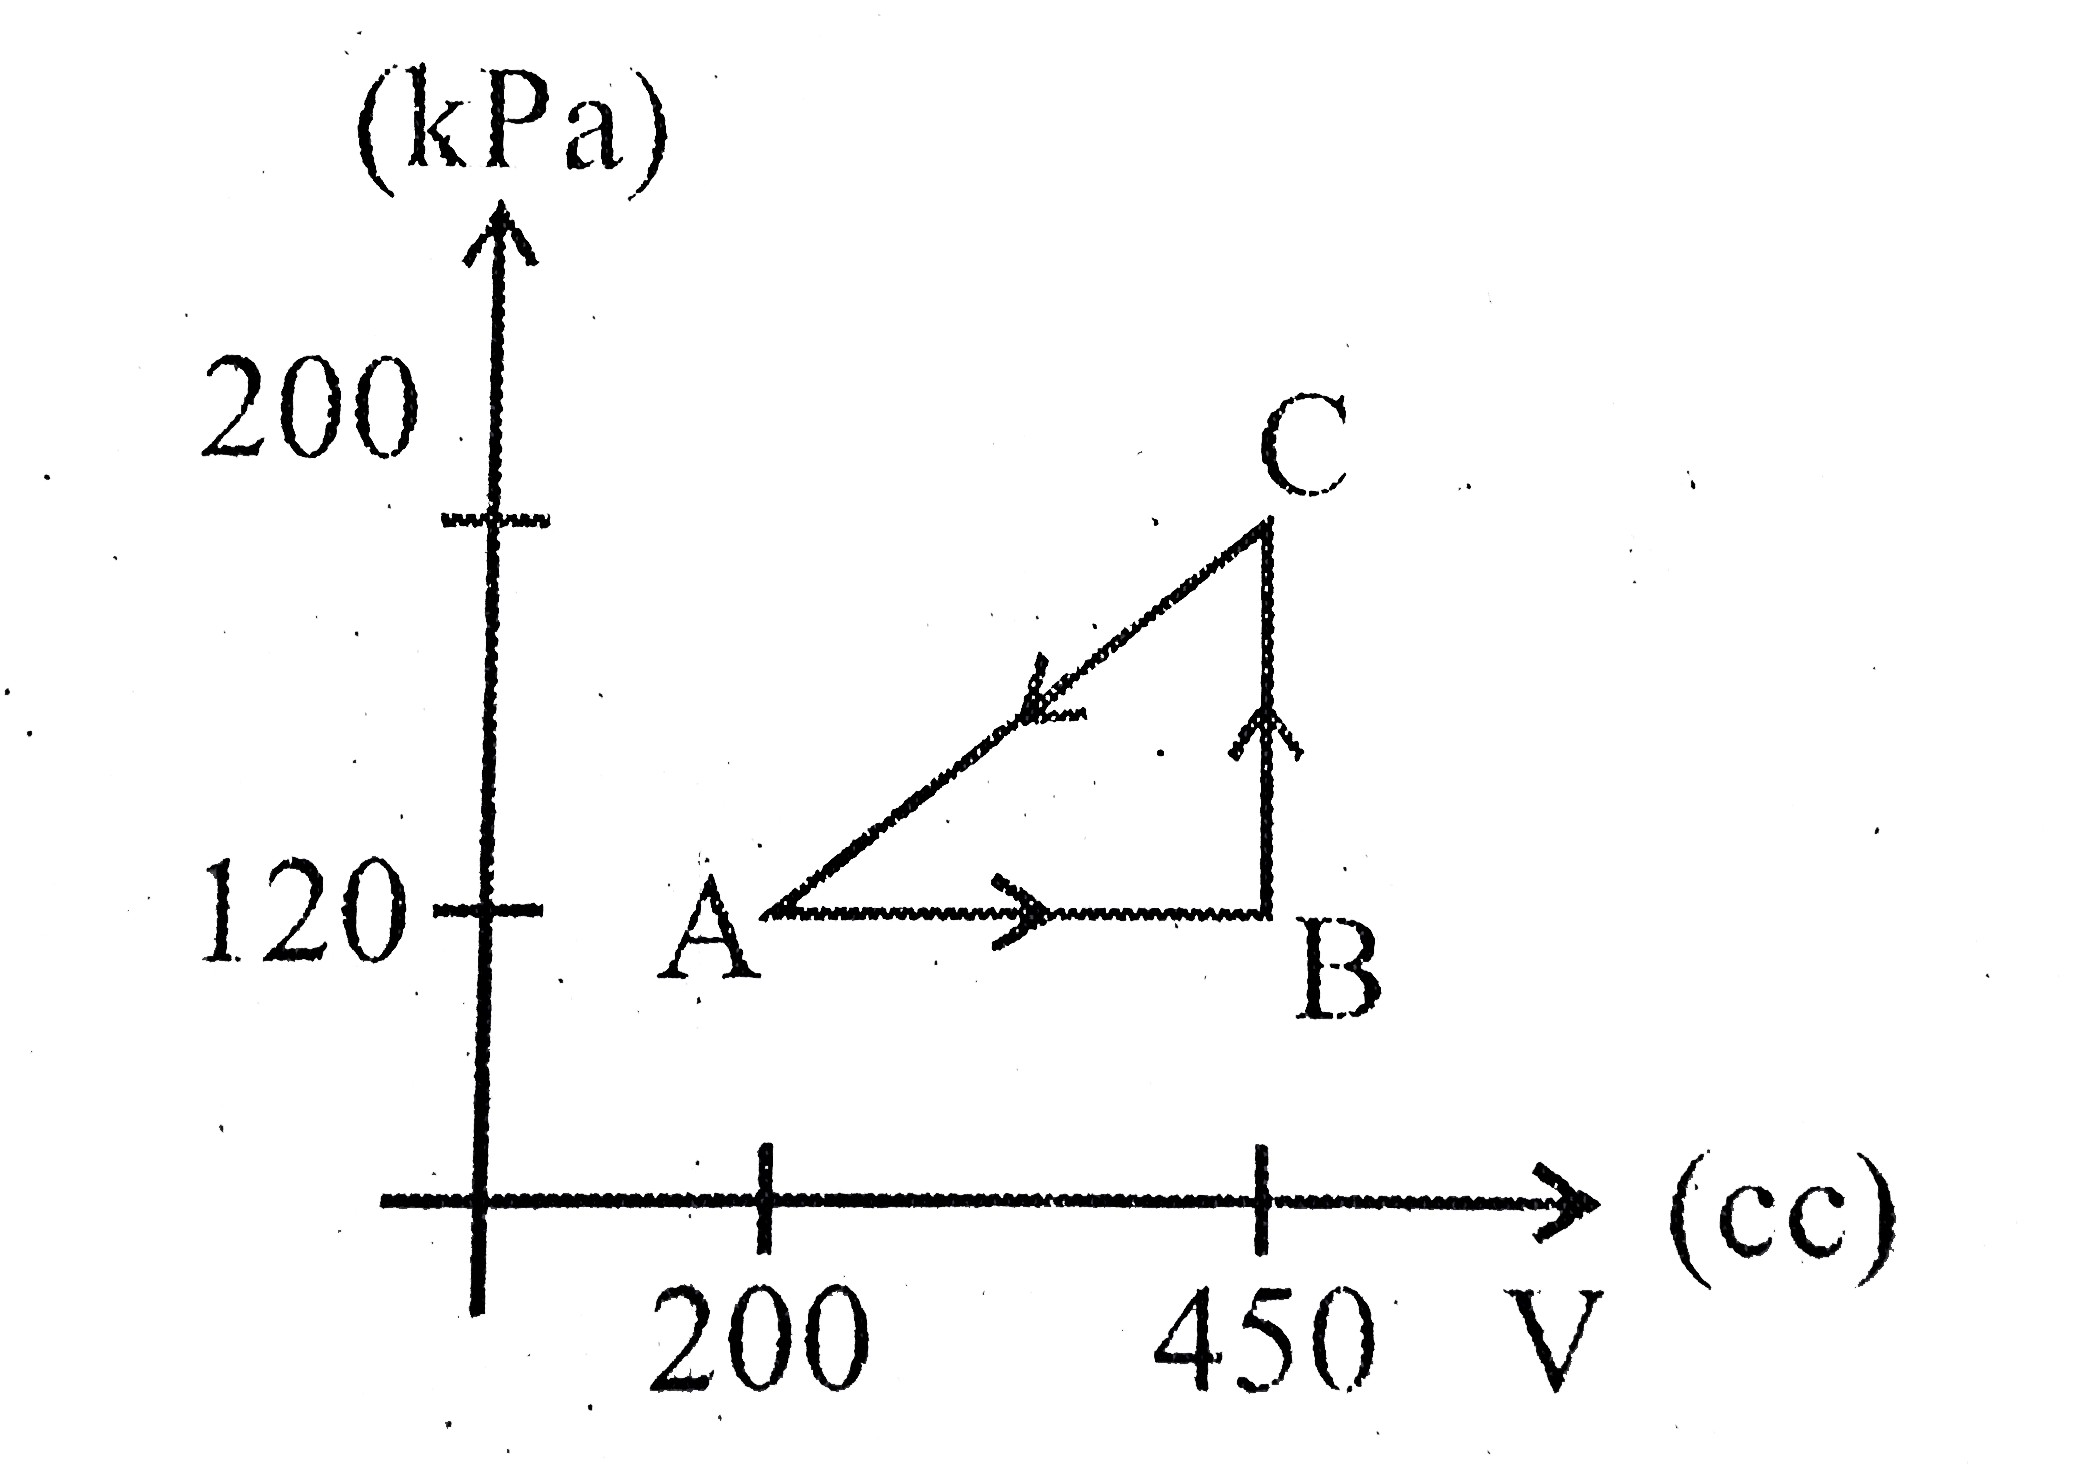
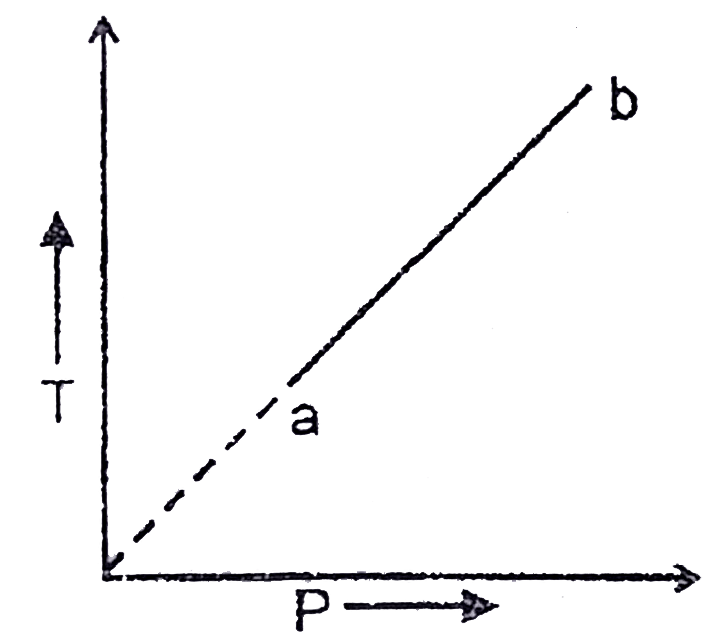
An ideal gas change from state a to state b as shown in Fig. what is the work done by the gas in the process?
 View Solution
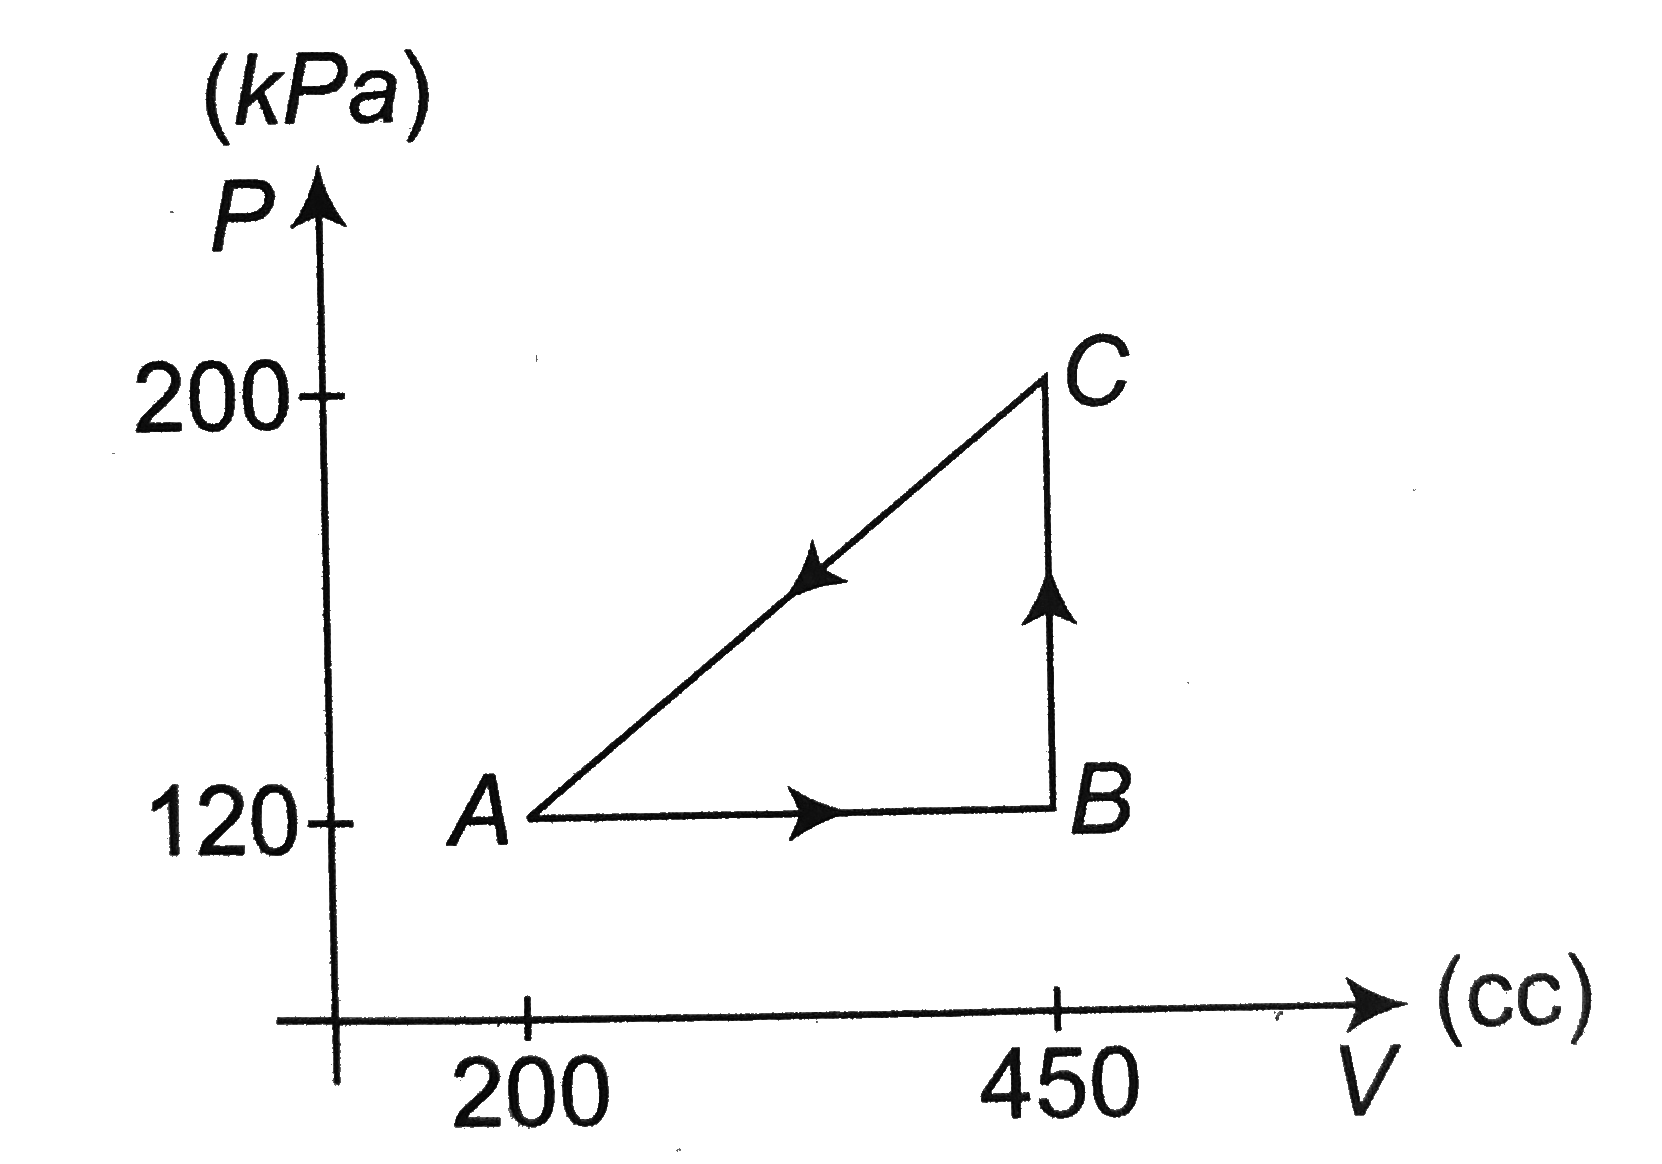
Calculate the work done by the gas in the state diagram shown.
 View Solution
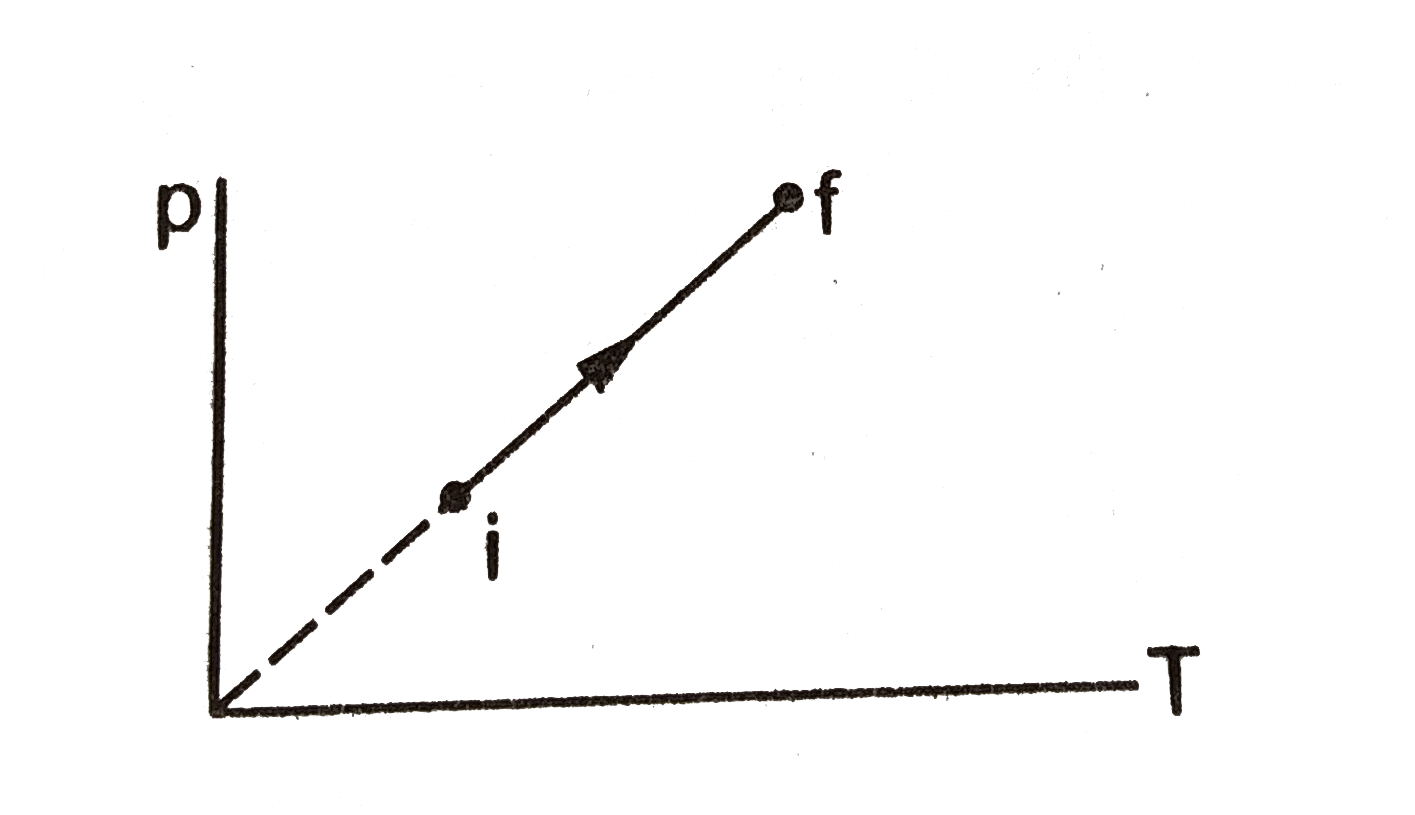
An ideal gas goes from the state i to the state ∫ as shown in .the work done by the gas during the process
 View Solution
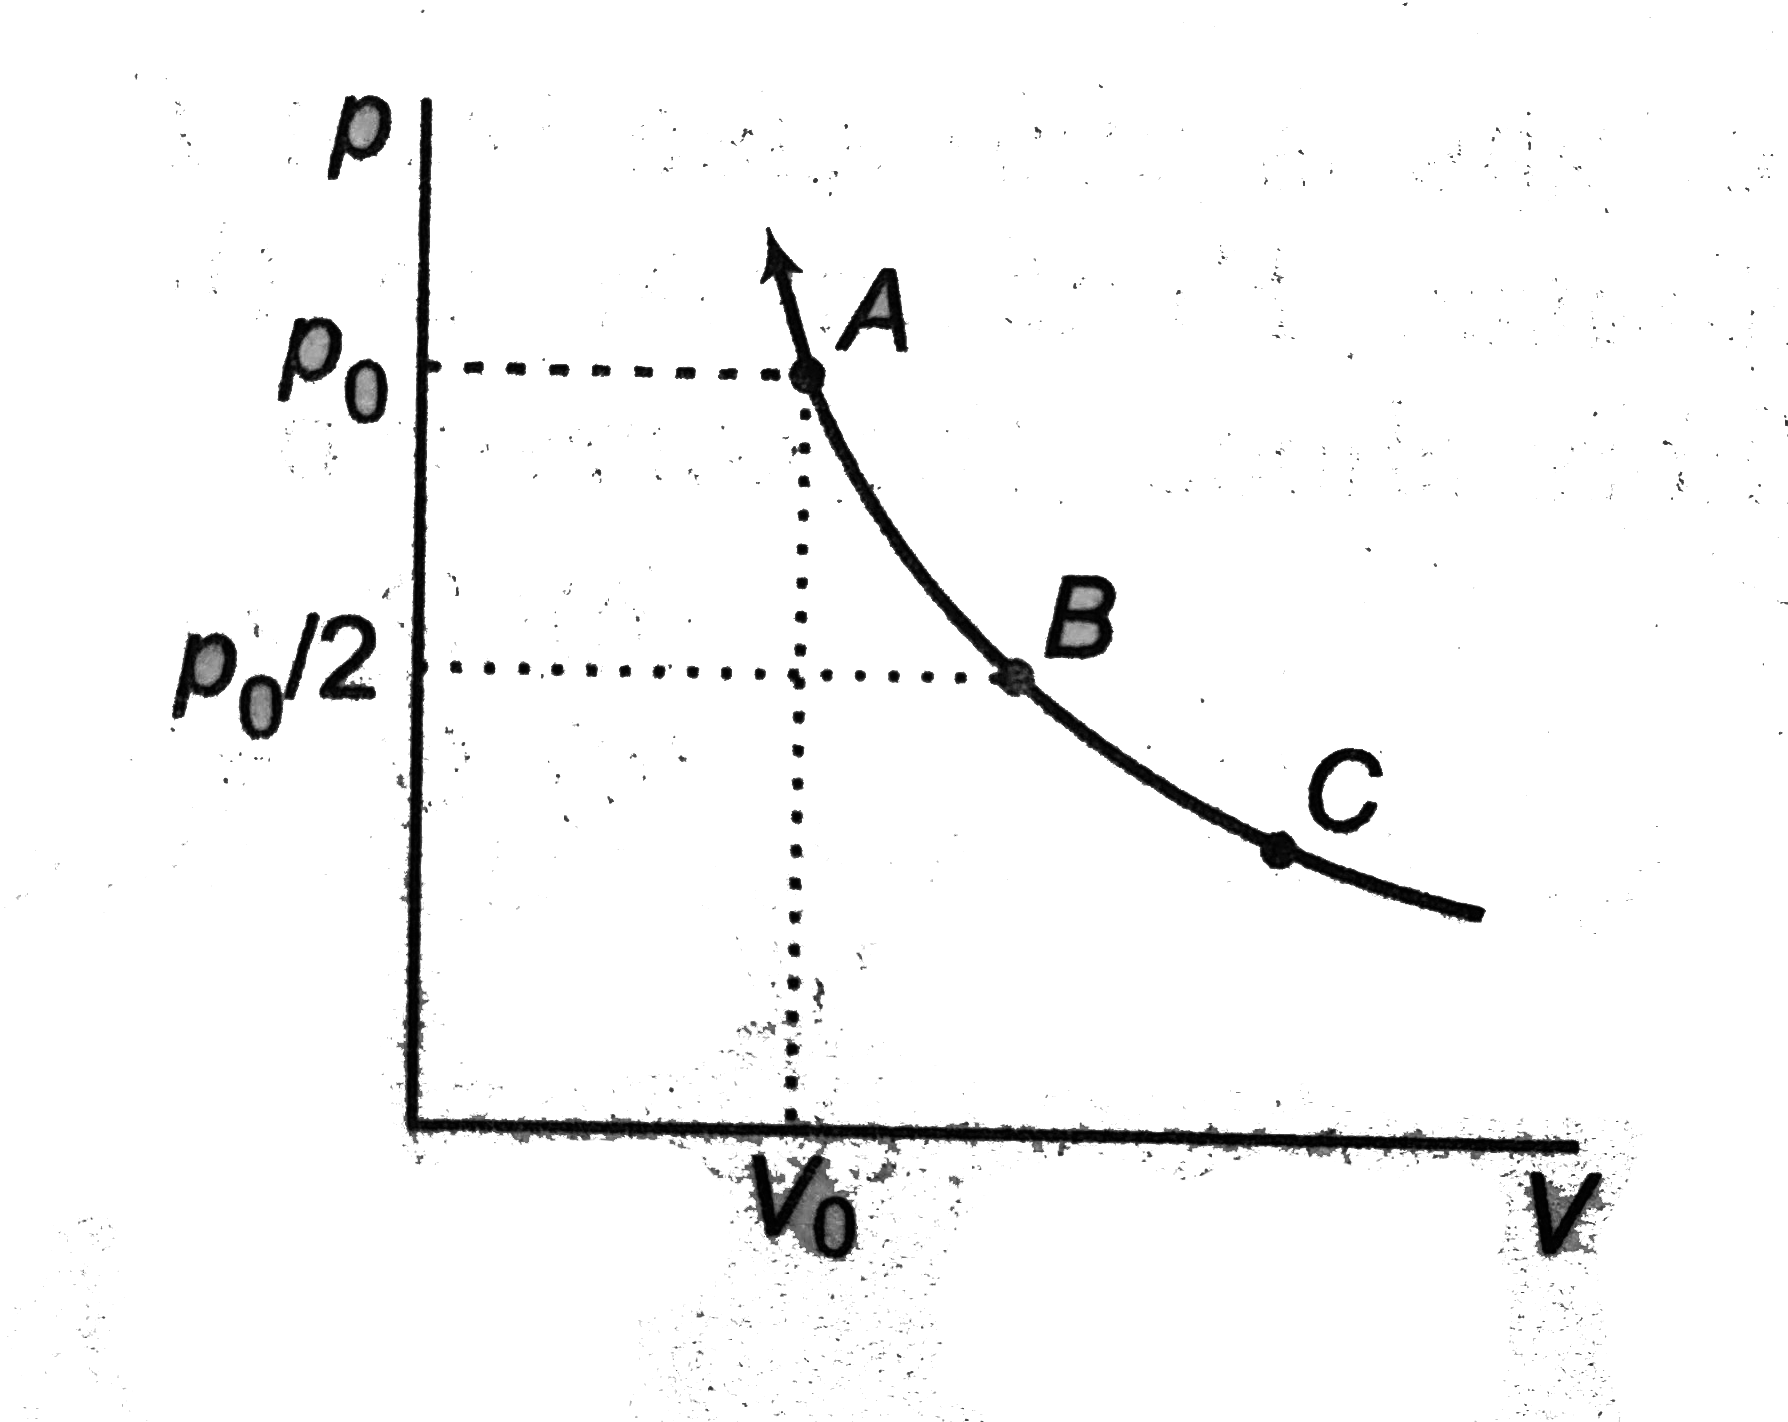
The state of an ideal gas is changed through an isothermal process at temperature T0 as shown in figure. The work done by the gas in going from state B to C is double the work done by gas in going from state A to B. If the pressure in the state B is p02, then the pressure of the gas in state C is
 View Solution
An ideal monoatomic gas undergoes a cyclic process ABCA as shown in the figure. The ratio of heat absorbed during AB to the work done on the gas during BC id
 View Solution


