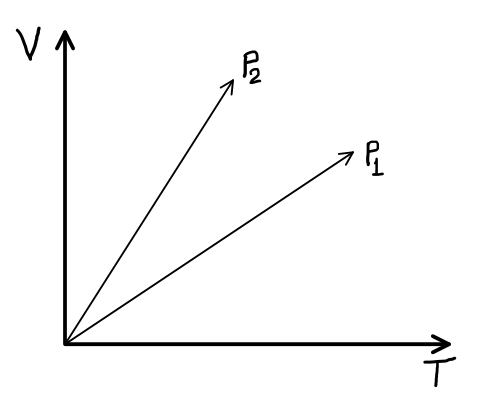
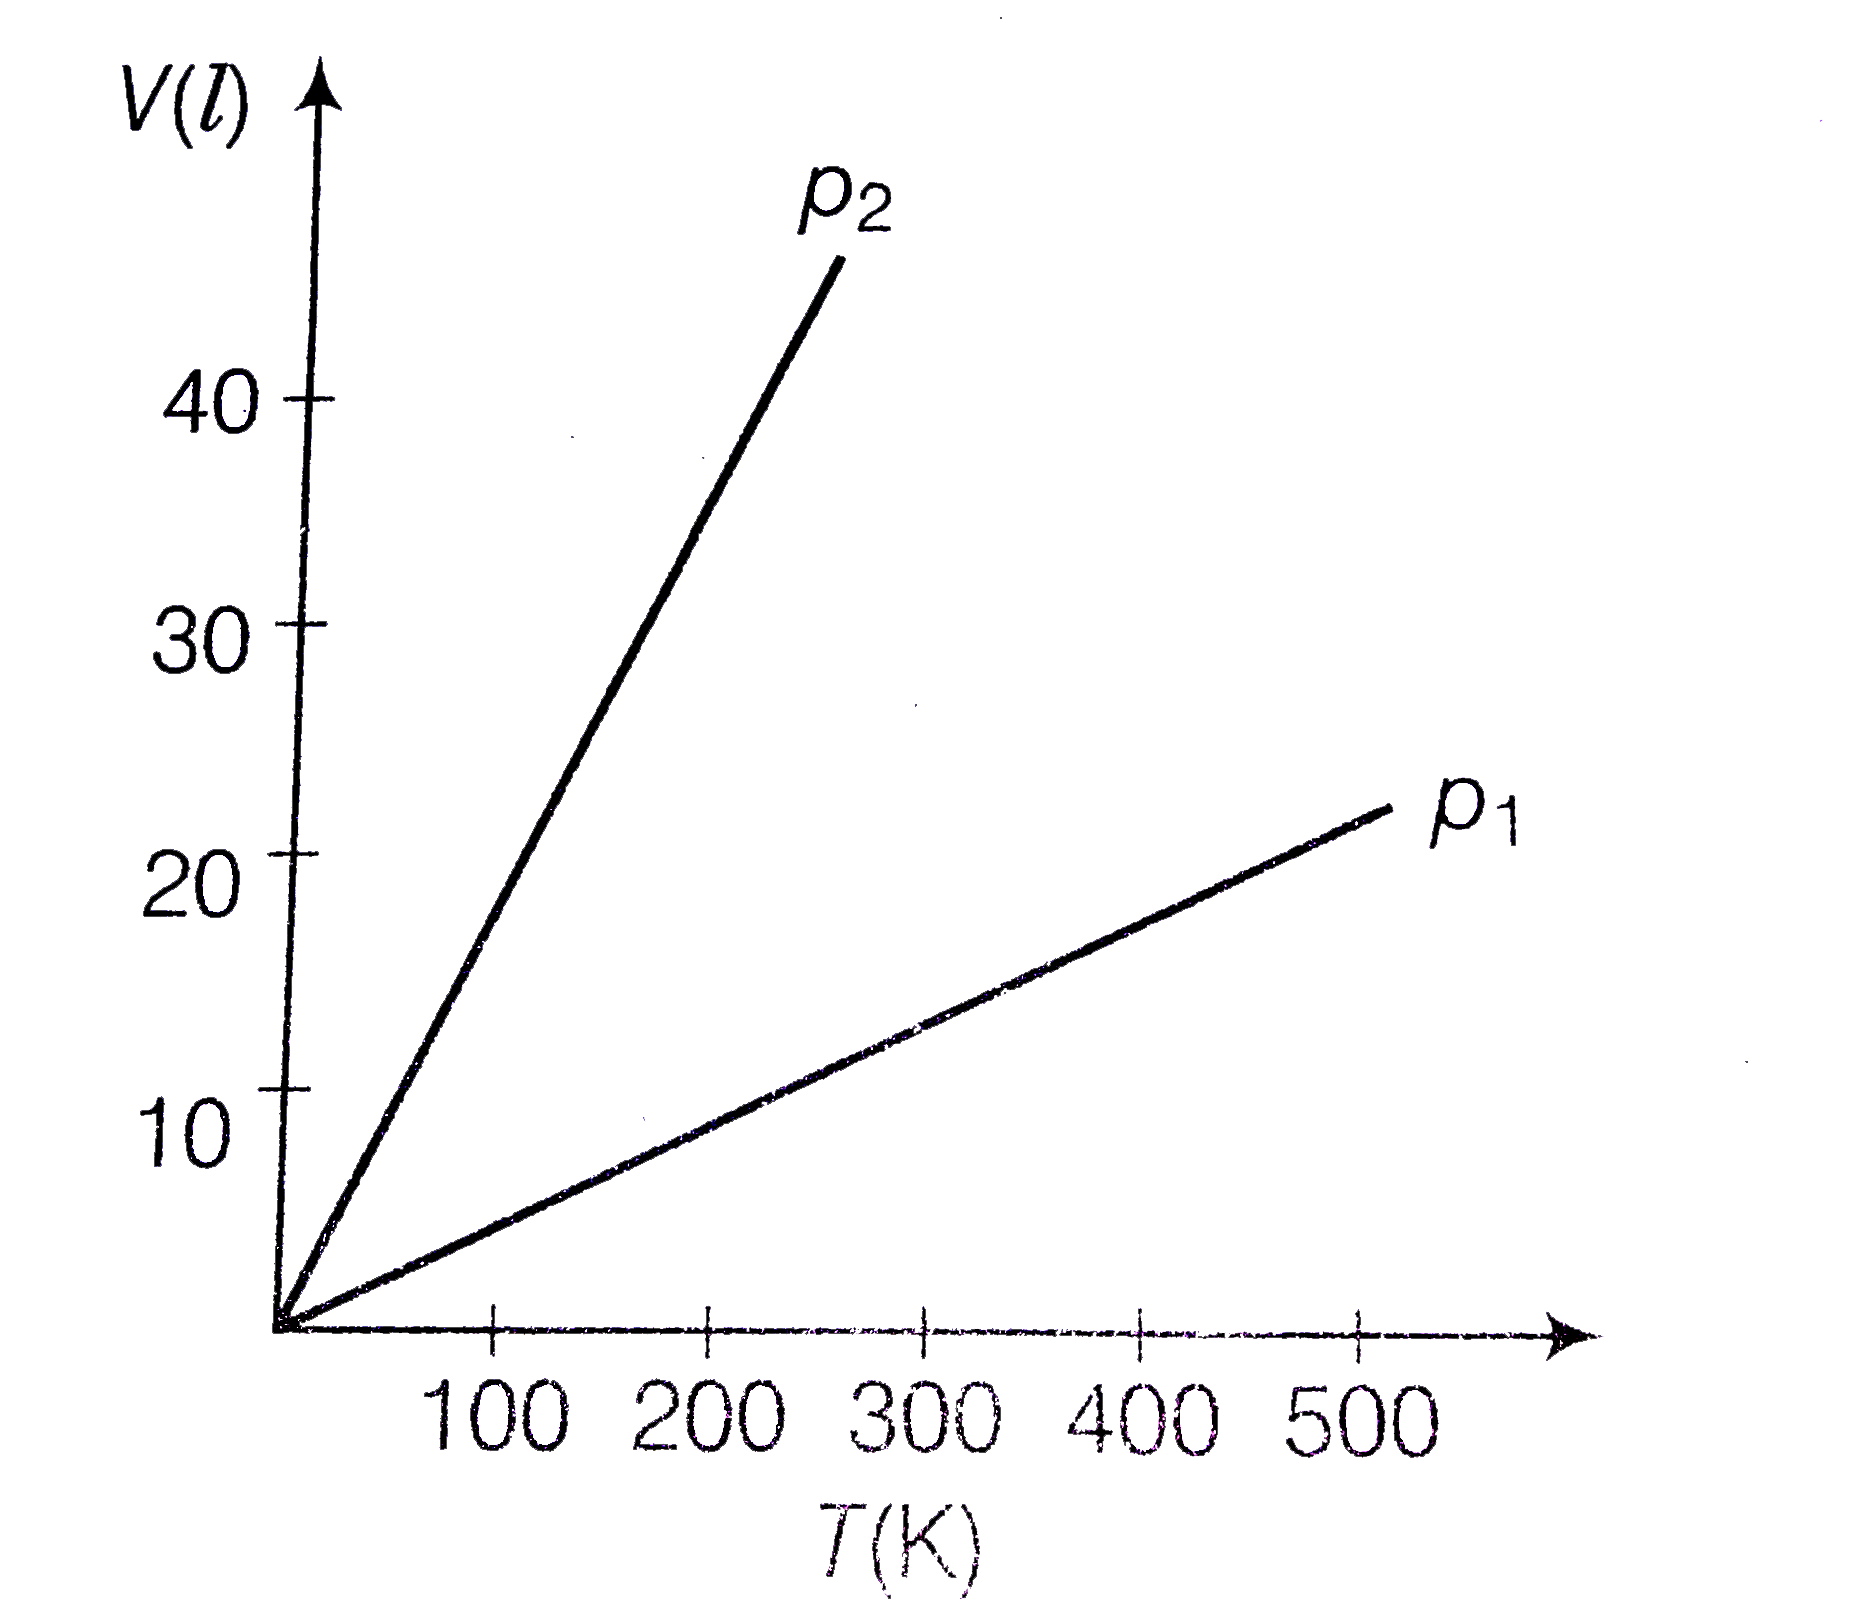
The volume V versus temperature T graphs for a certain amount of a perfect gas at two pressure p1andp2 are as shown in Fig. It follows from the graphs that p1 is greater than p2.
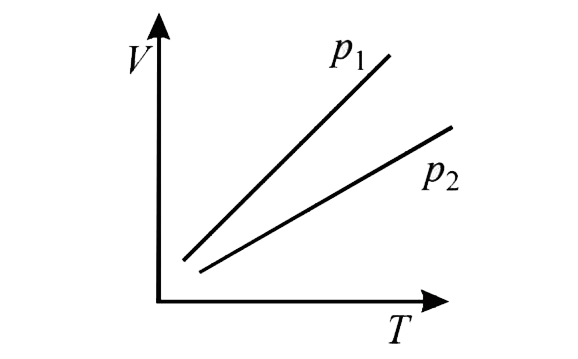
Step by step video solution for The volume V versus temperature T graphs for a certain amount of a perfect gas at two pressure p_1 and p_2 are as shown in Fig. It follows from the graphs that p_1 is greater than p_2. by Physics experts to help you in doubts & scoring excellent marks in Class 11 exams.
Updated on:21/07/2023Topper's Solved these Questions
Similar Questions
The volume V versus temperature T graphs for a cetain amount of a perfect gas at two pressure p1andp2 are as shown in Fig. It follows from the graphs that p1 is greater than p2.

View SolutionFigure shows graphs of pressure versus density for an ideal gas at two temperatures T1 and T2 Then
View Solution
Knowledge Check
For V versus T curves at constant pressure P1andP2 for and ideal gas shown in figure-
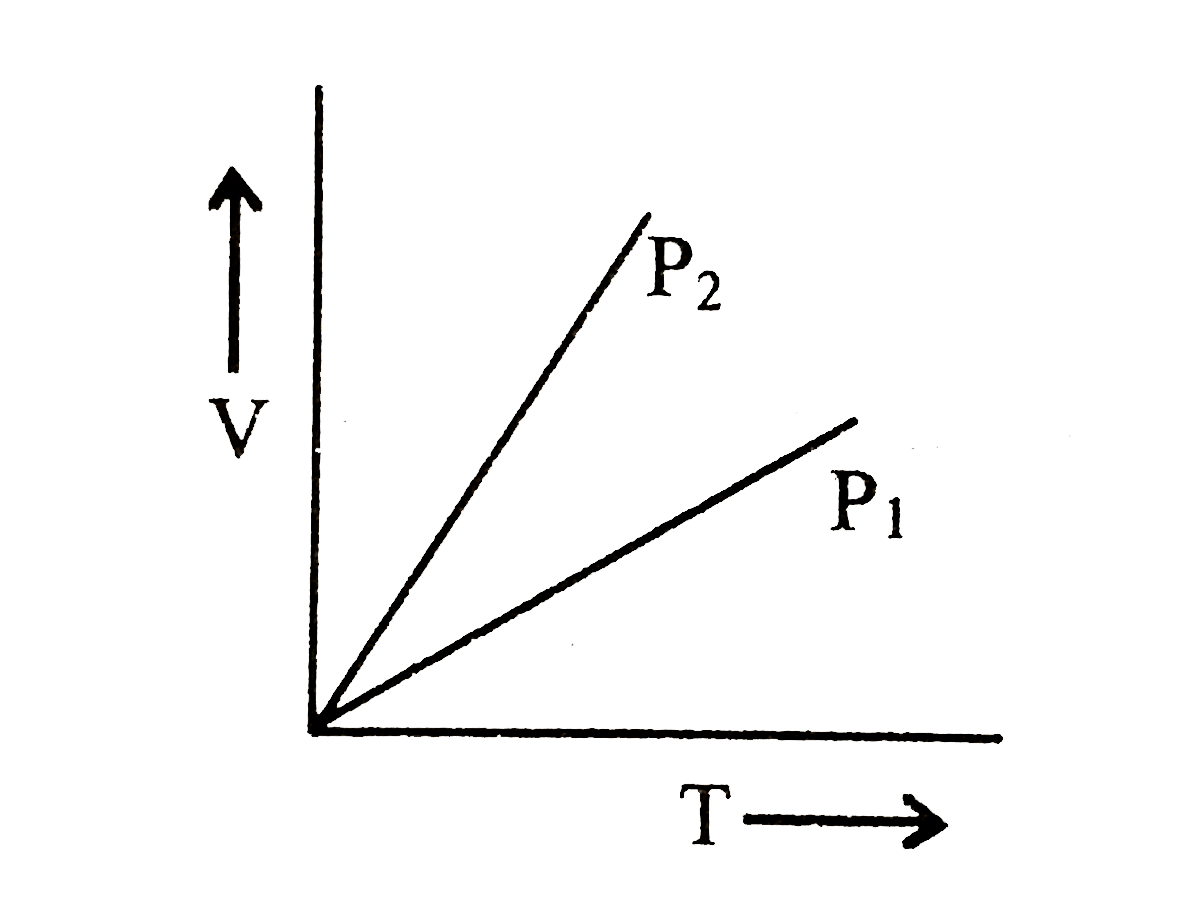 AP1>P2BP1<P2CP1=P2DP1P2
For an ideal gas V−T curves at constant pressure P1 & P2 are shown in figure, from the figure
_E01_061_Q01.png) AP1>P2BP1<P2CP1=P2DP1≤P2
AP1>P2BP1<P2CP1=P2DP1≤P2Figure shows the pressure P versus volume V graphs for a certains mass of a gas at two constant temperature T1andT2. Which of the following interface is correct?
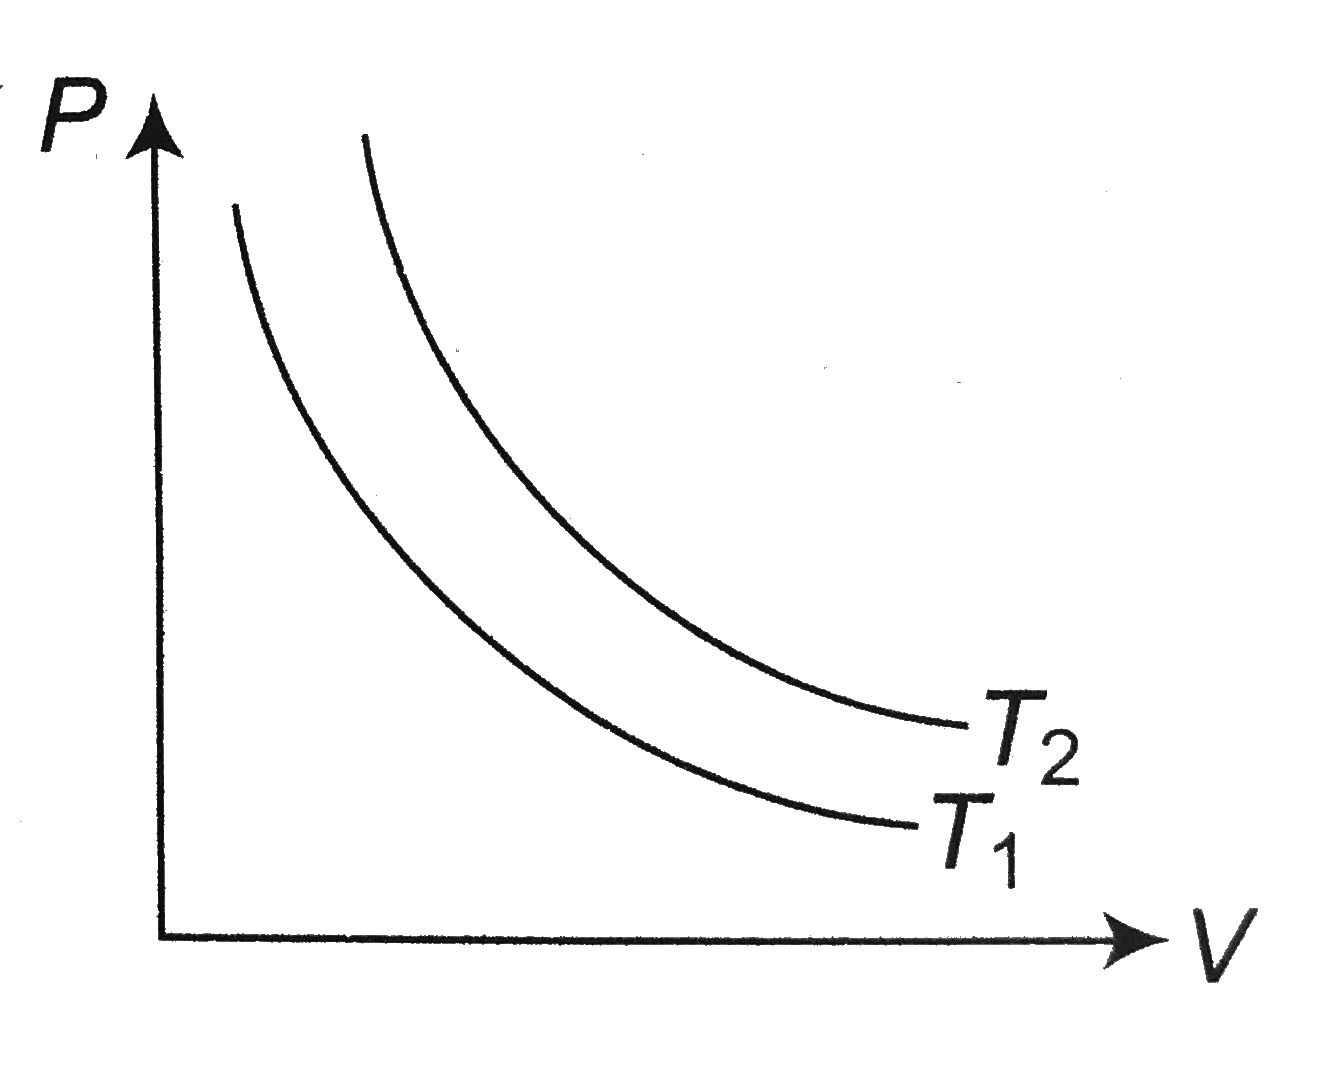 AT1=T2BT1>T2CT1<T2Dno inference can be drawn due to insufficient information
Pressure p, volume V and temperature T for a certain gas are related by
p=αT−βT2V
where, α and β are constants. Find the work done by the gas if the temperature changes from T1 to T2 while the pressure remains the constant.
View SolutionVolume versus temperature graphs for a given mass of an ideal gas are shown in Fig. at two different values of constant pressure. What can be inferred about relation between P1andP2?
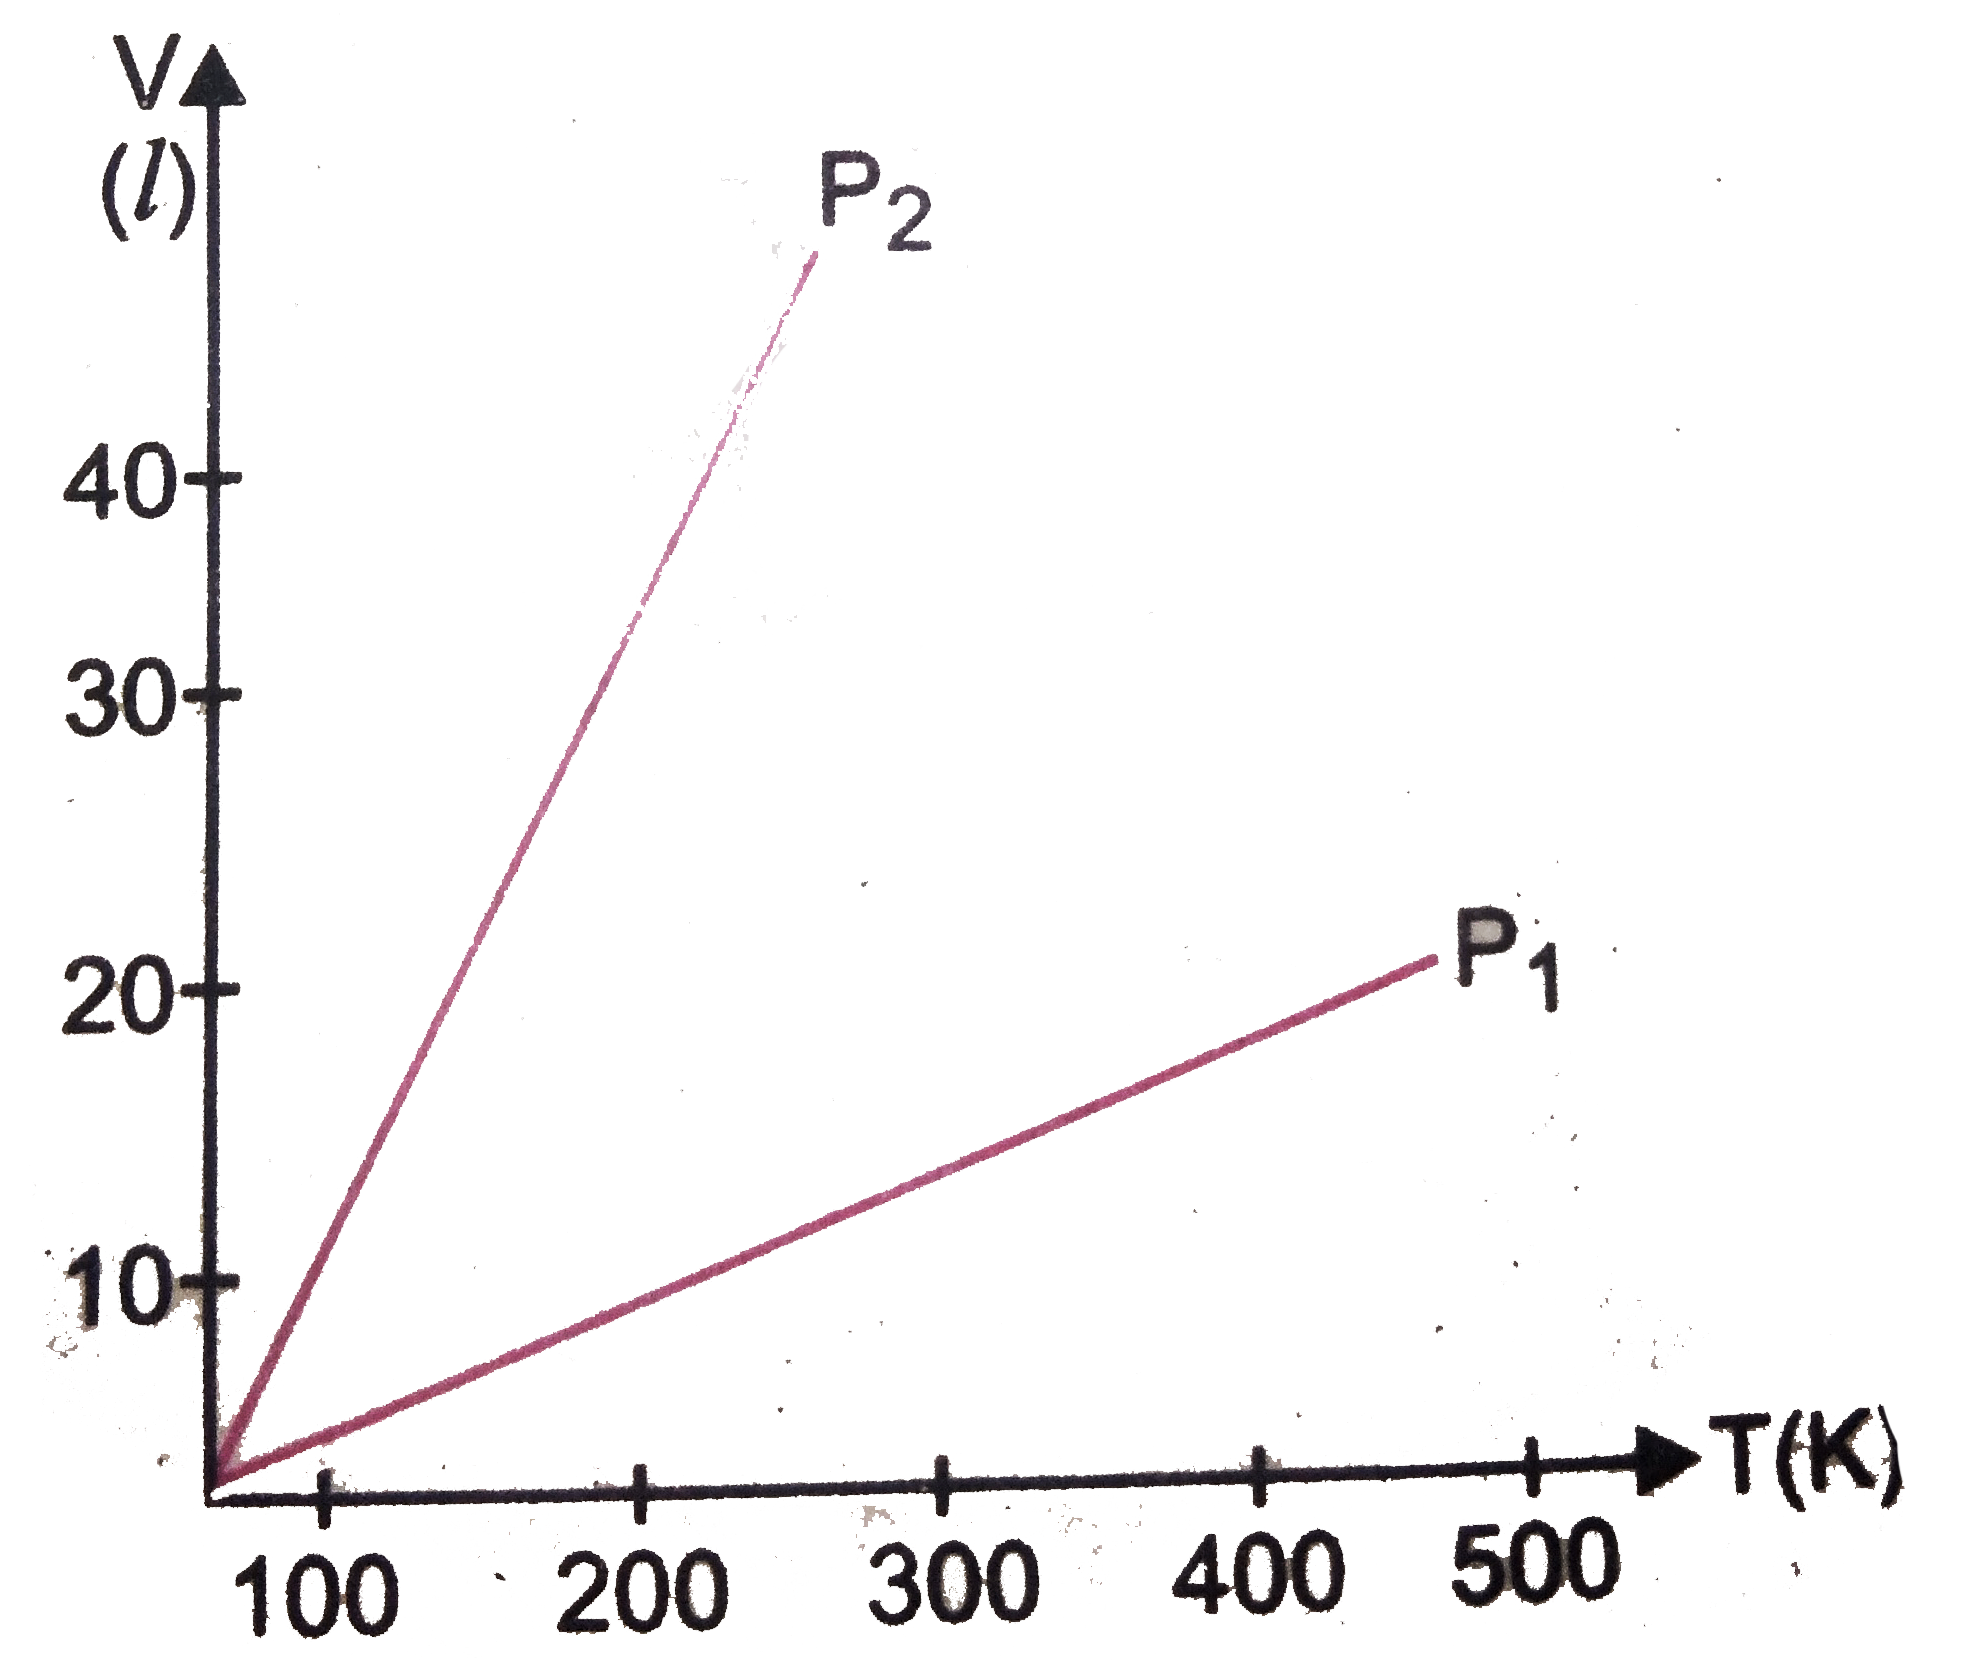
View SolutionFigure shows the volume versus temperature graph for the same mass of a gas (assumed ideal) corresponding to two different pressure P1andP2. Then
View SolutionVolume versus temperature graphs for a given mass of an ideal gas are shown in figure. At two different values of constant pressure. What can be inferred about relation between P1 and P2 ?
View SolutionPressure P, volume V and temperature T for a certain gas are related by P=AT−BT2V, where A and B are constants .The work done by the gas as its temperature change from T1 to T2 while pressure remaining constant is
View Solution
