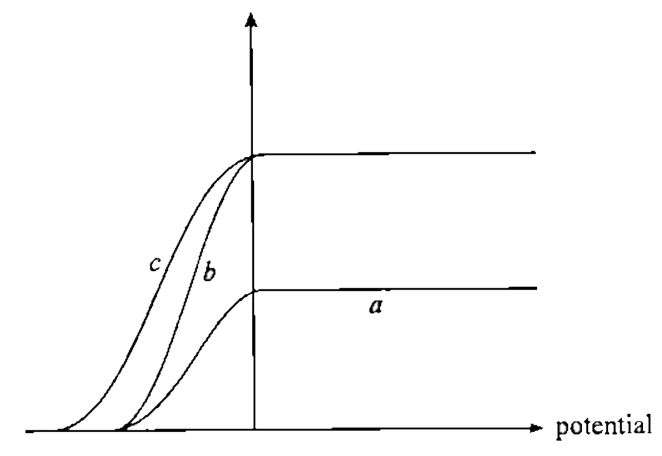
Two photocathodes are illuminated by the light emitted by a single source. The dependence of photocurrent versus voltages between cathode and anode is shown by curves 1 and 2 as shown in the figure. (I/I_(max) represents ratio of photocurrent to saturation current):
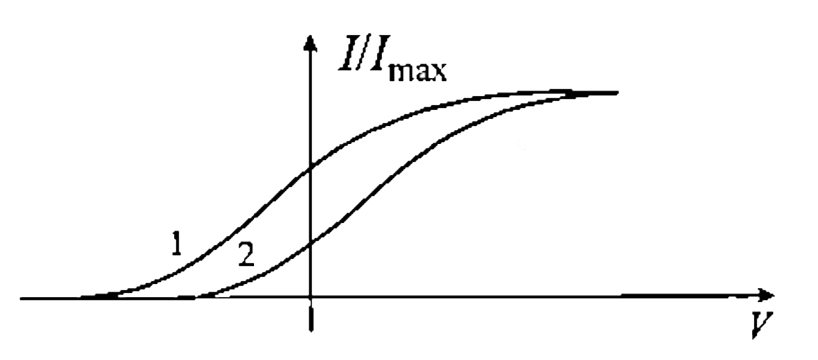
Photocathode 1 has higher work function than 2
Photocathode 2 has higher work function than 1
Saturation current may be different for 1 and 2
saturation current must be same for 1 and 2
Step by step video & image solution for Two photocathodes are illuminated by the light emitted by a single source. The dependence of photocurrent versus voltages between cathode and anode is shown by curves 1 and 2 as shown in the figure. (I/I_(max) represents ratio of photocurrent to saturation current): by Physics experts to help you in doubts & scoring excellent marks in Class 12 exams.
Updated on:21/07/2023Topper's Solved these Questions
- PHOTOELECTRIC EFFECT AND MATTER WAVESBOOK - PHYSICS GALAXY - ASHISH ARORACHAPTER - PHOTOELECTRIC EFFECT AND MATTER WAVESEXERCISE - Unsolved numerical problems
42 Videos
- PHOTOELECTRIC EFFECT AND MATTER WAVESBOOK - PHYSICS GALAXY - ASHISH ARORACHAPTER - PHOTOELECTRIC EFFECT AND MATTER WAVESEXERCISE - Numerical MCQs
60 Videos
- NUCLEAR PHYSICS AND RADIOACTIVITYBOOK - PHYSICS GALAXY - ASHISH ARORACHAPTER - NUCLEAR PHYSICS AND RADIOACTIVITYEXERCISE - Concptual MCQs
48 Videos
- THERMODYNAMICS LAWS & SPECIFIC HEATS OF GASES BOOK - PHYSICS GALAXY - ASHISH ARORACHAPTER - THERMODYNAMICS LAWS & SPECIFIC HEATS OF GASES EXERCISE - Practice Exercise 3.4
11 Videos
Similar Questions
Knowledge Check
In the circuit as shown in figure, the ratio of current i1/i2 is
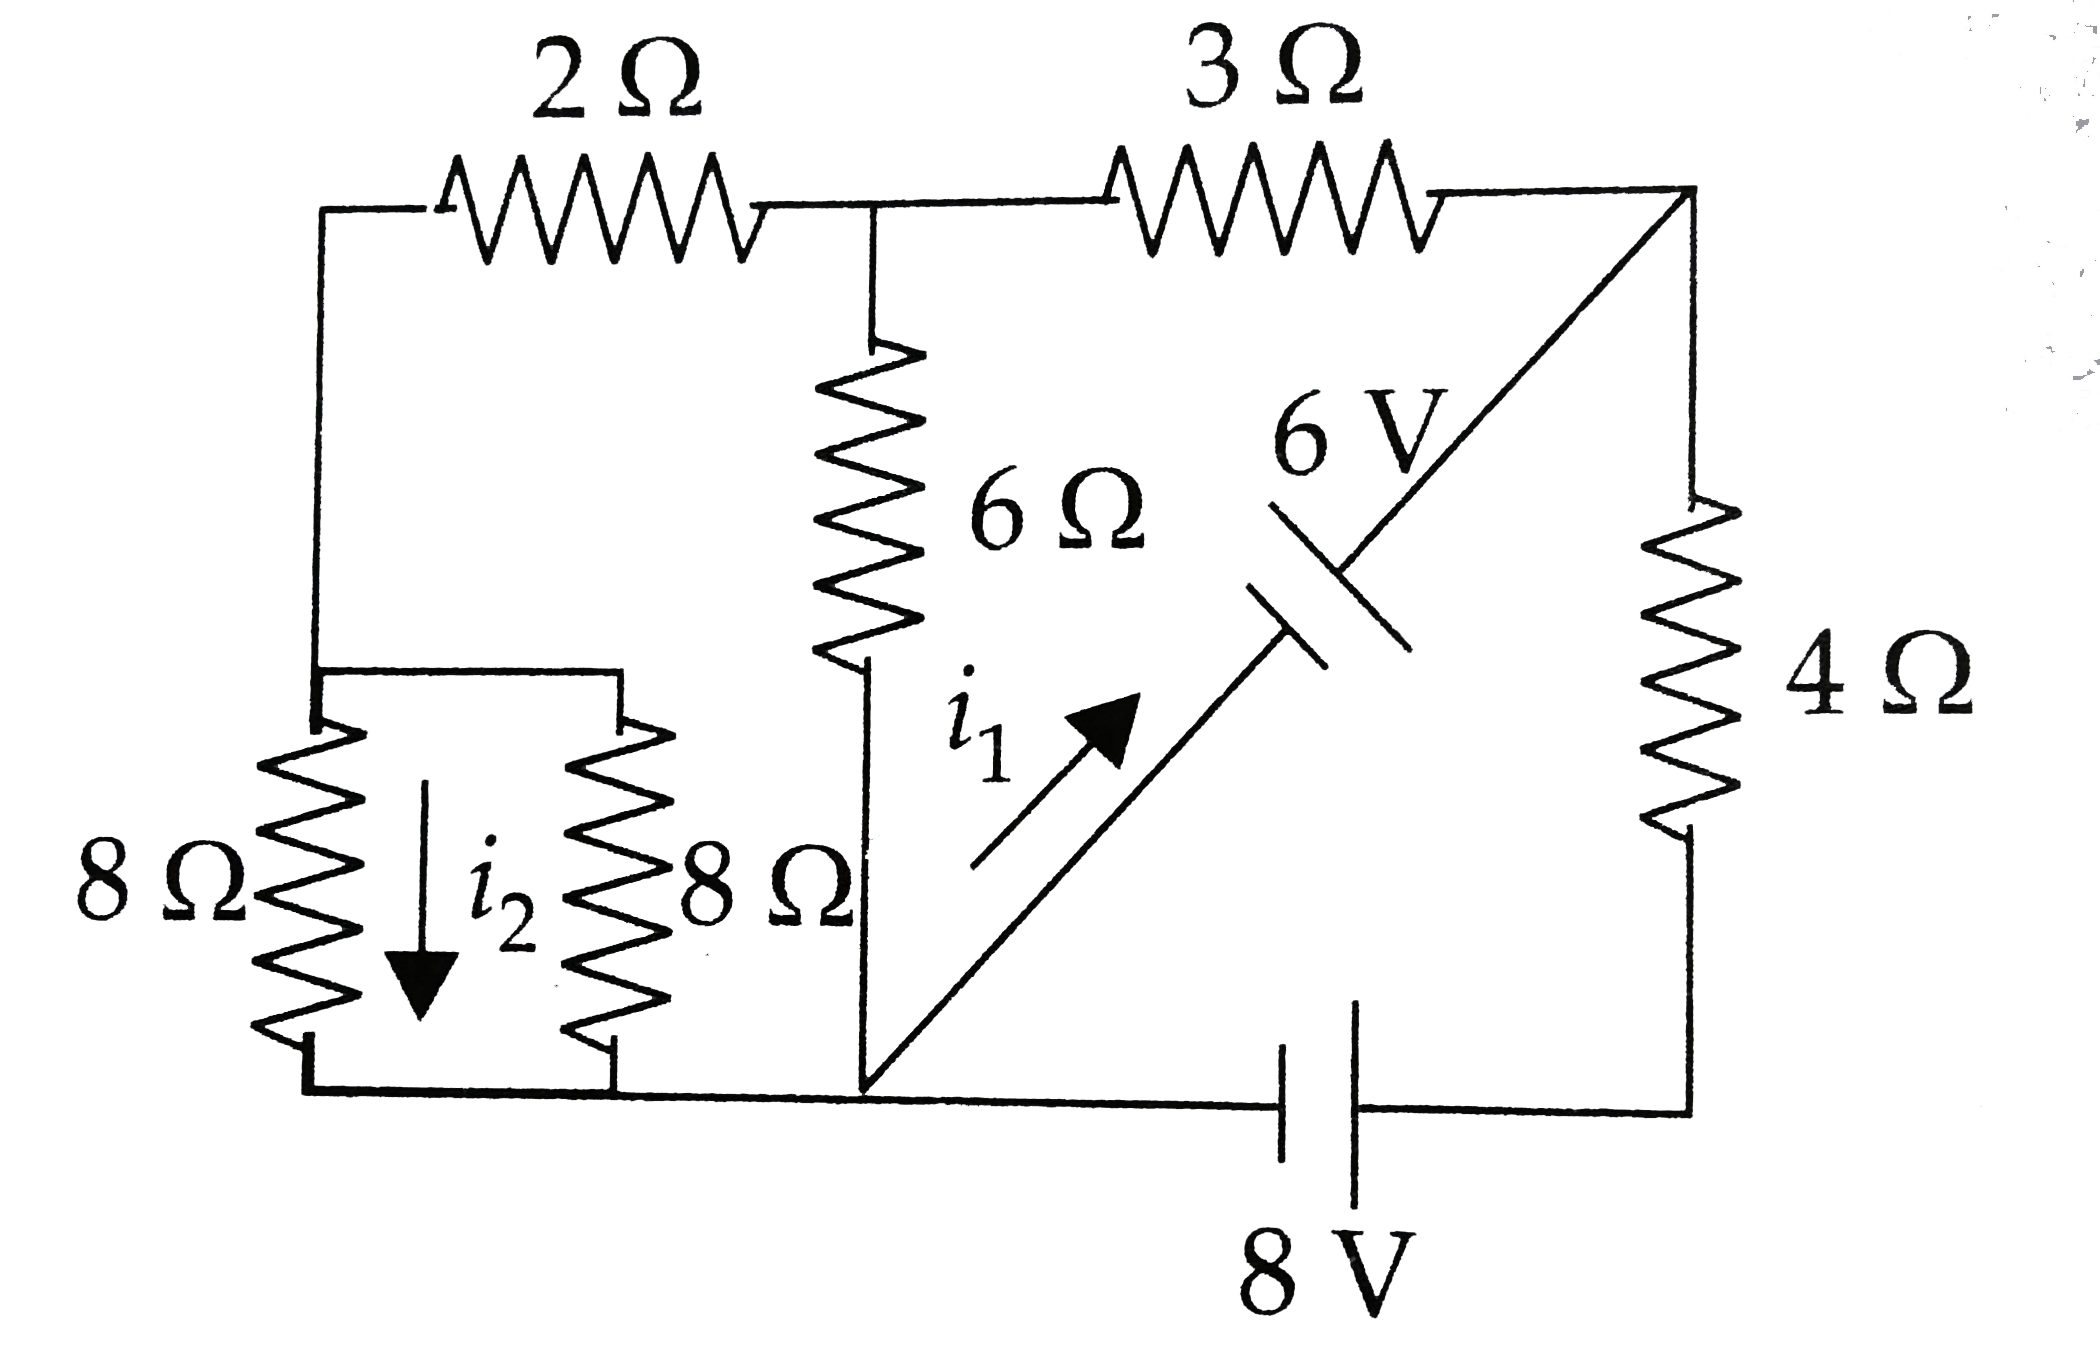 A4/3B1/2C2Dnone of these
From the given between current I and voltage V shown in figure , indentify the portion corresponding to negative resistance
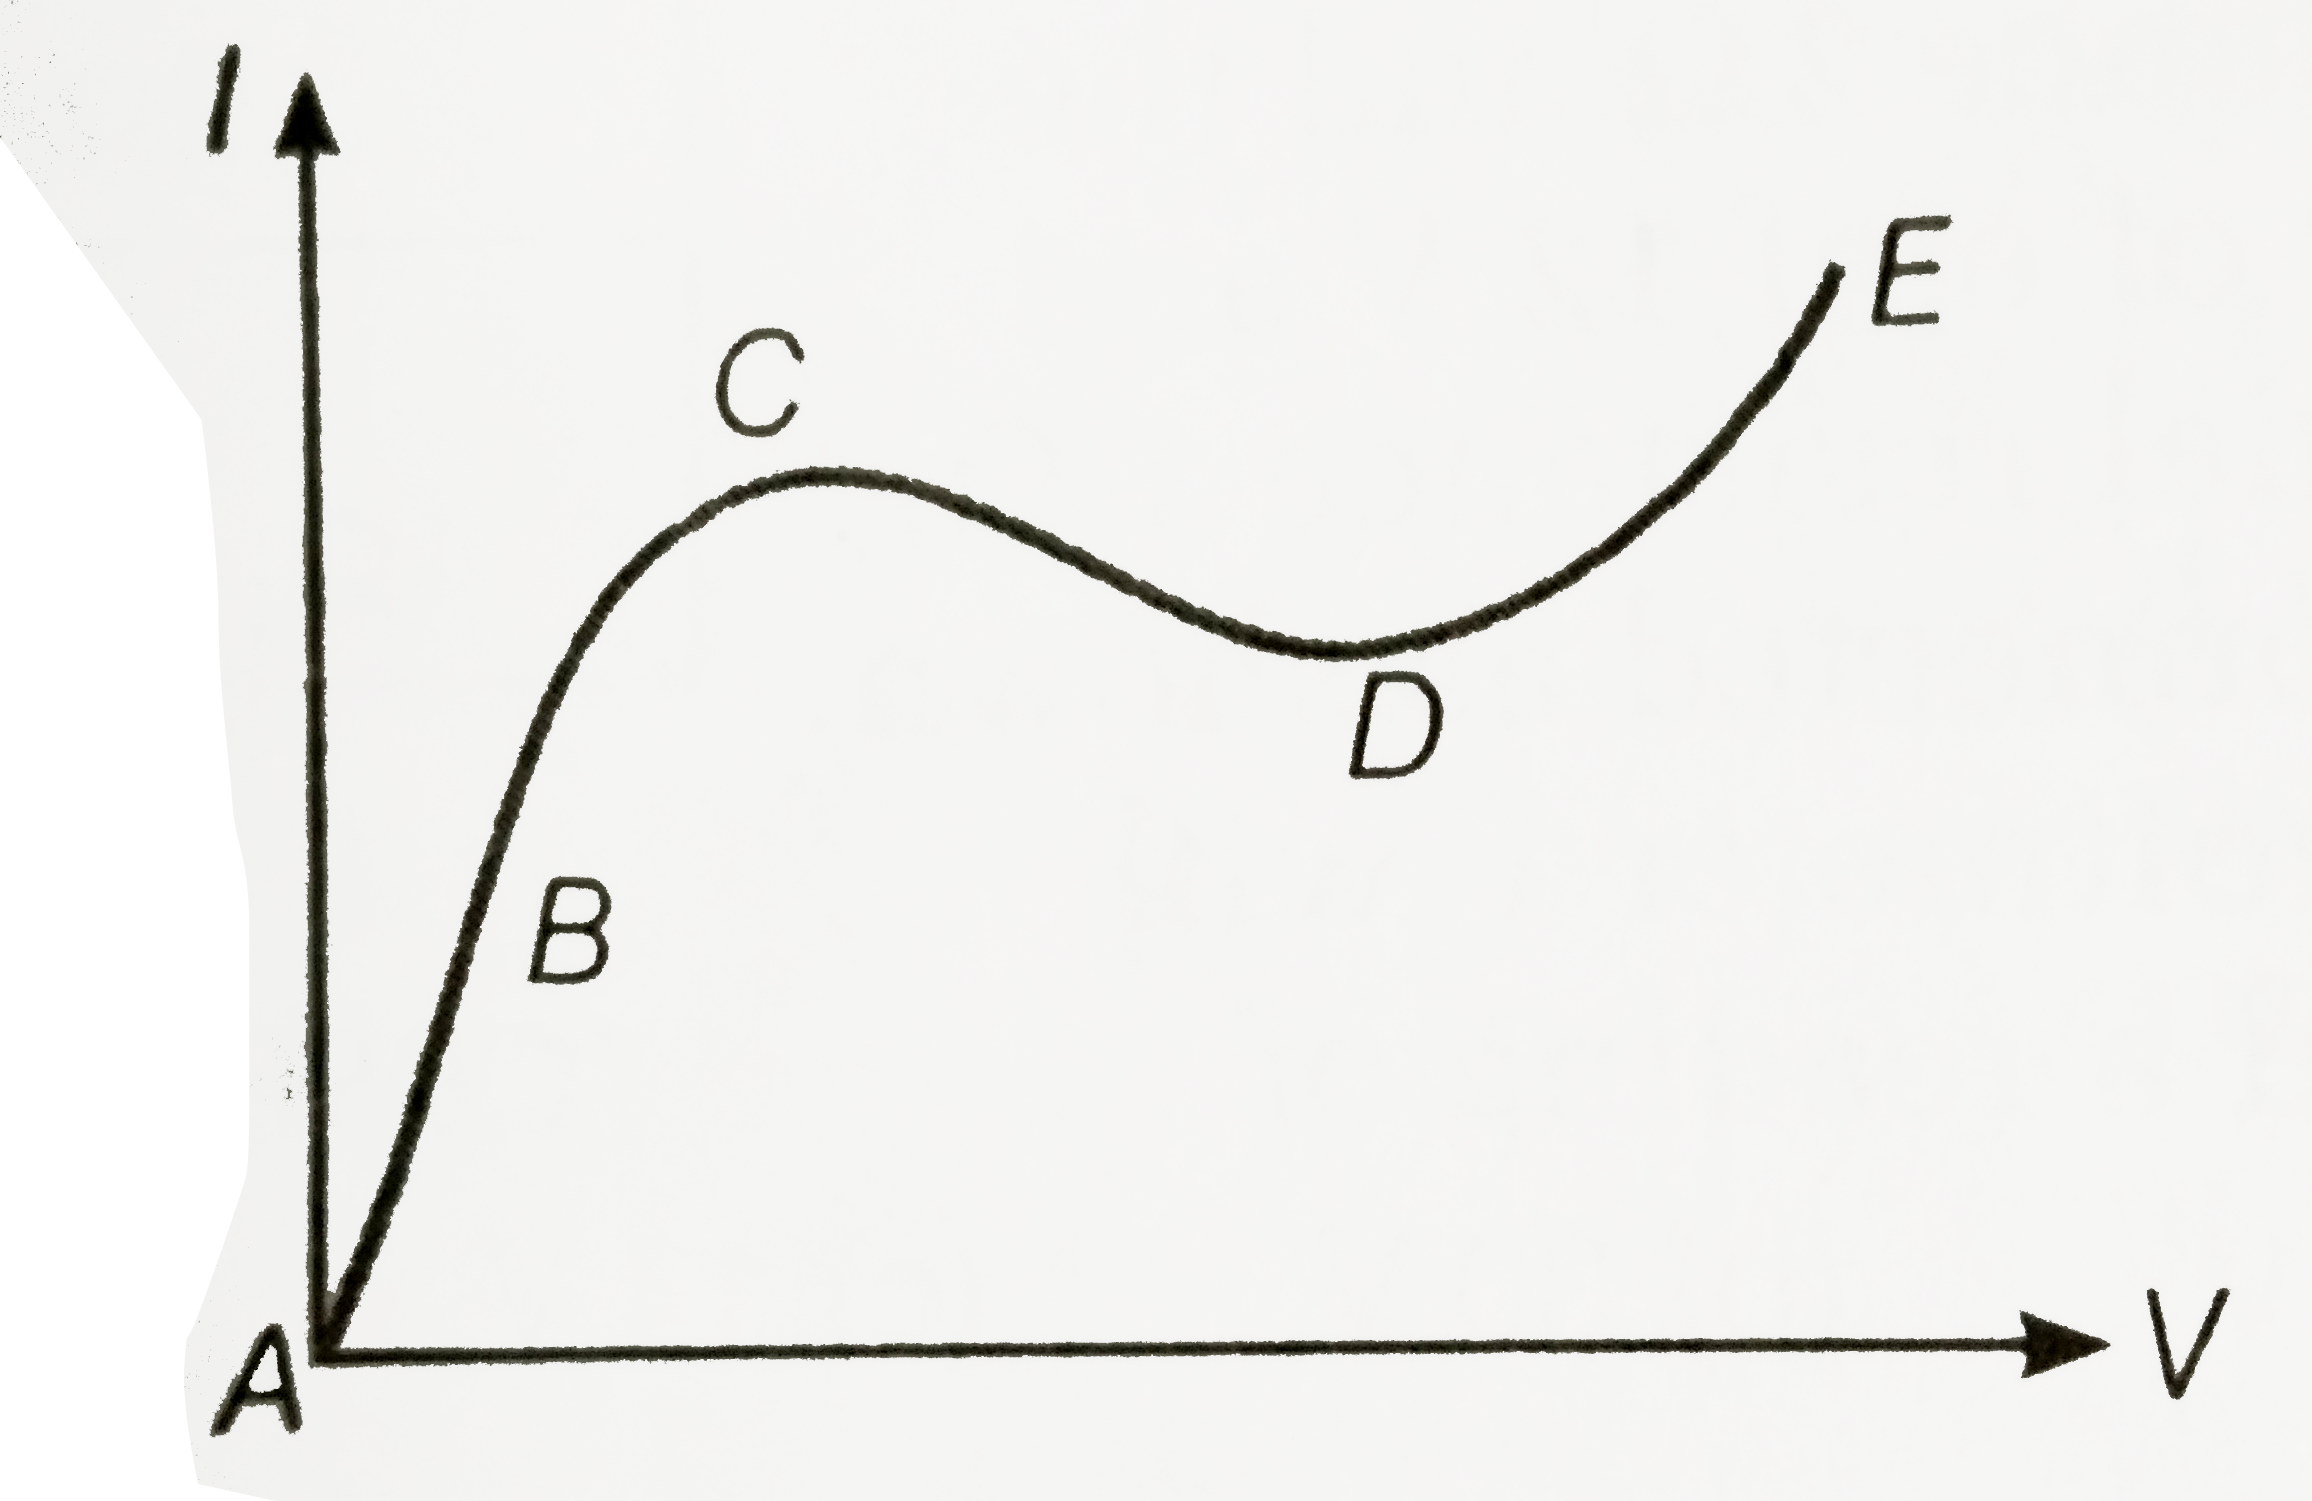 ADEBCDCBCDAB
The current (I) and voltage (V) graphs for a given metallic wire at two different temperature (T1) and (T2) are shown in fig. It is concluded that
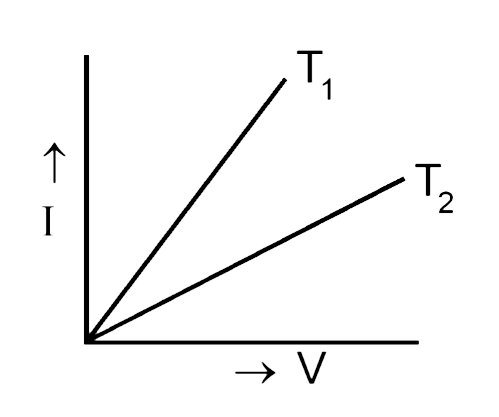 AT1=T2BT1>T2CT1<T2DNone of these
Graph showing the variation of current versus voltage for a material GaAs is shown in figure. Identify the region of (i) negative resistance (ii) where Ohm's law is obeyed.
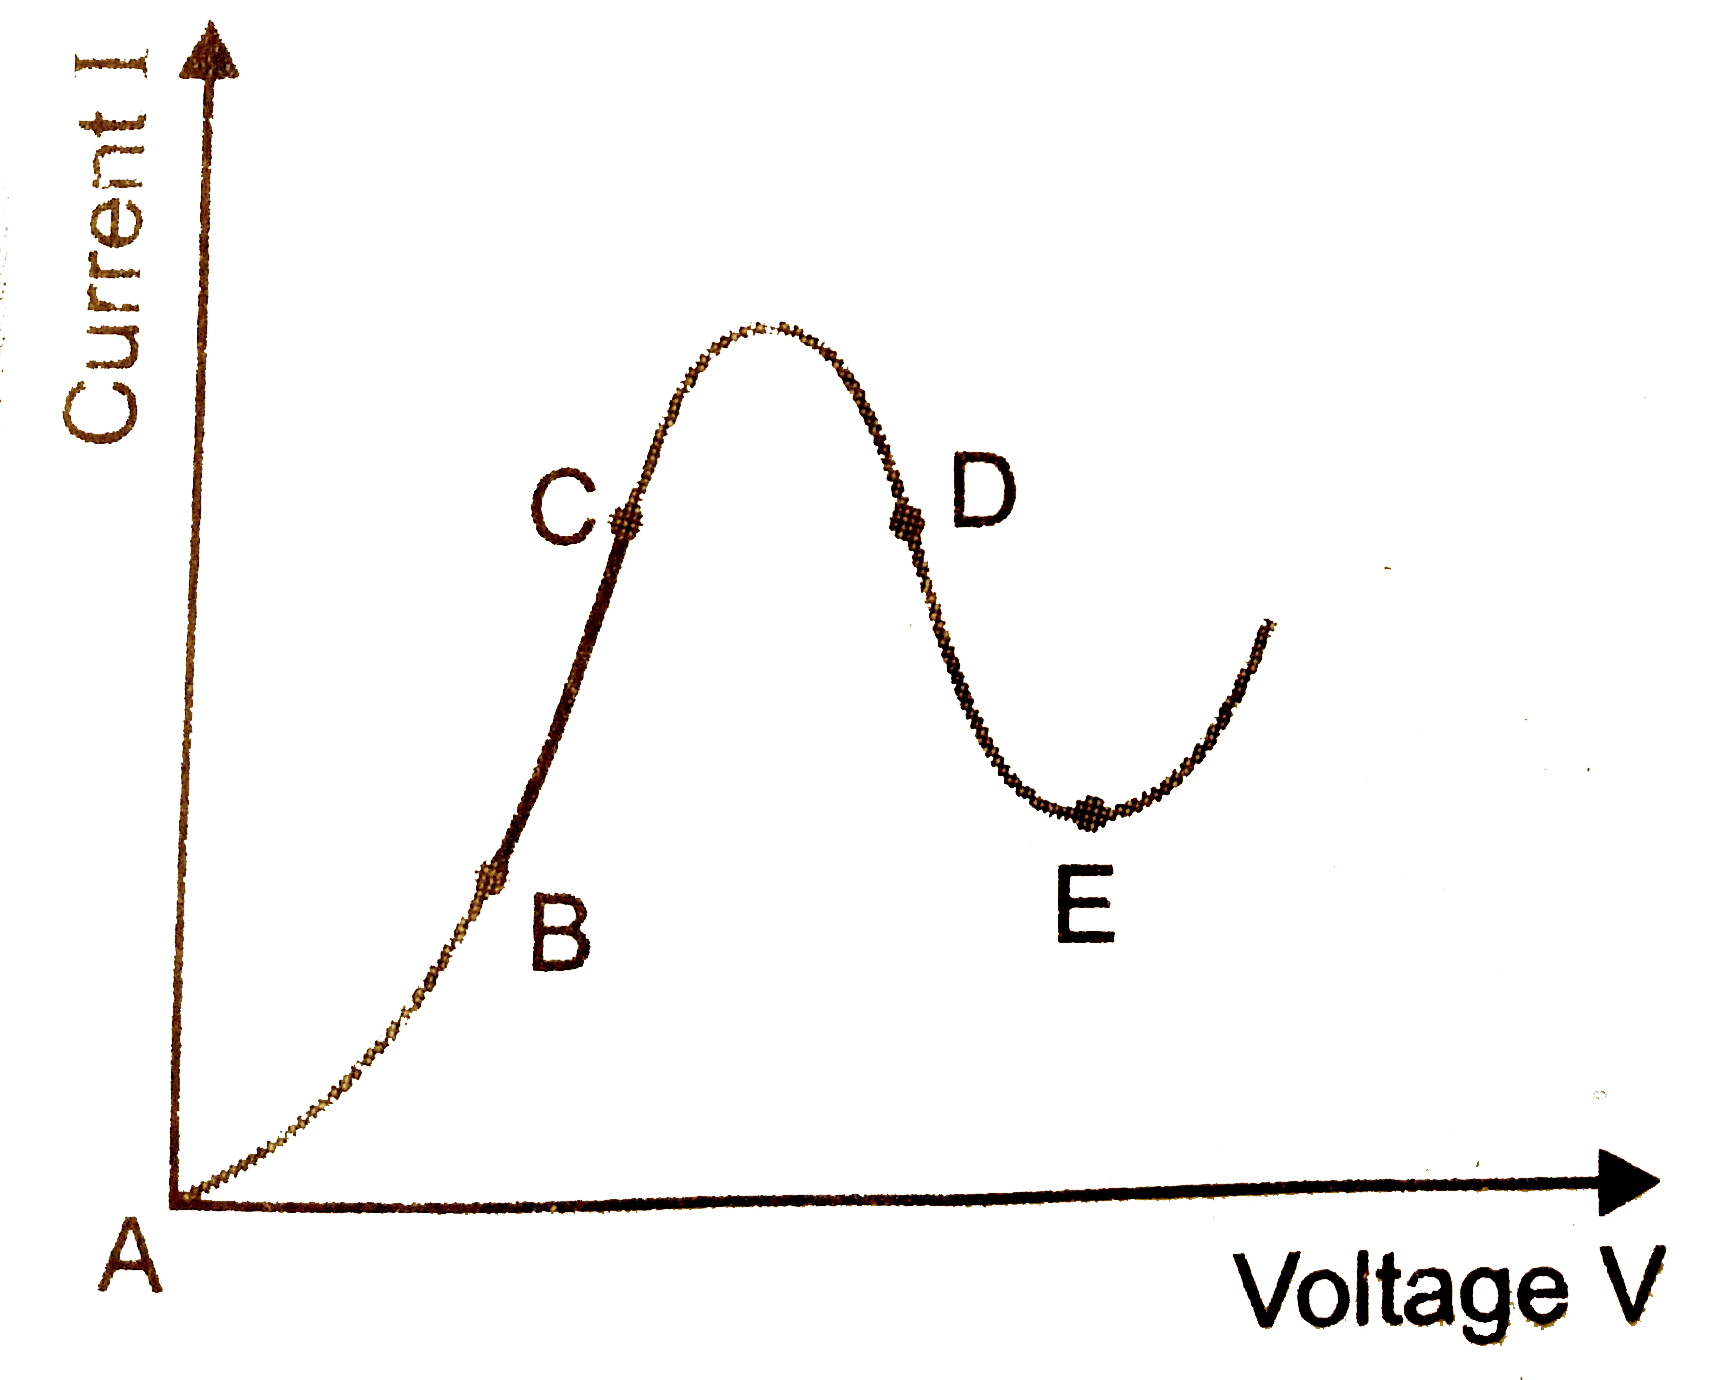
View Solution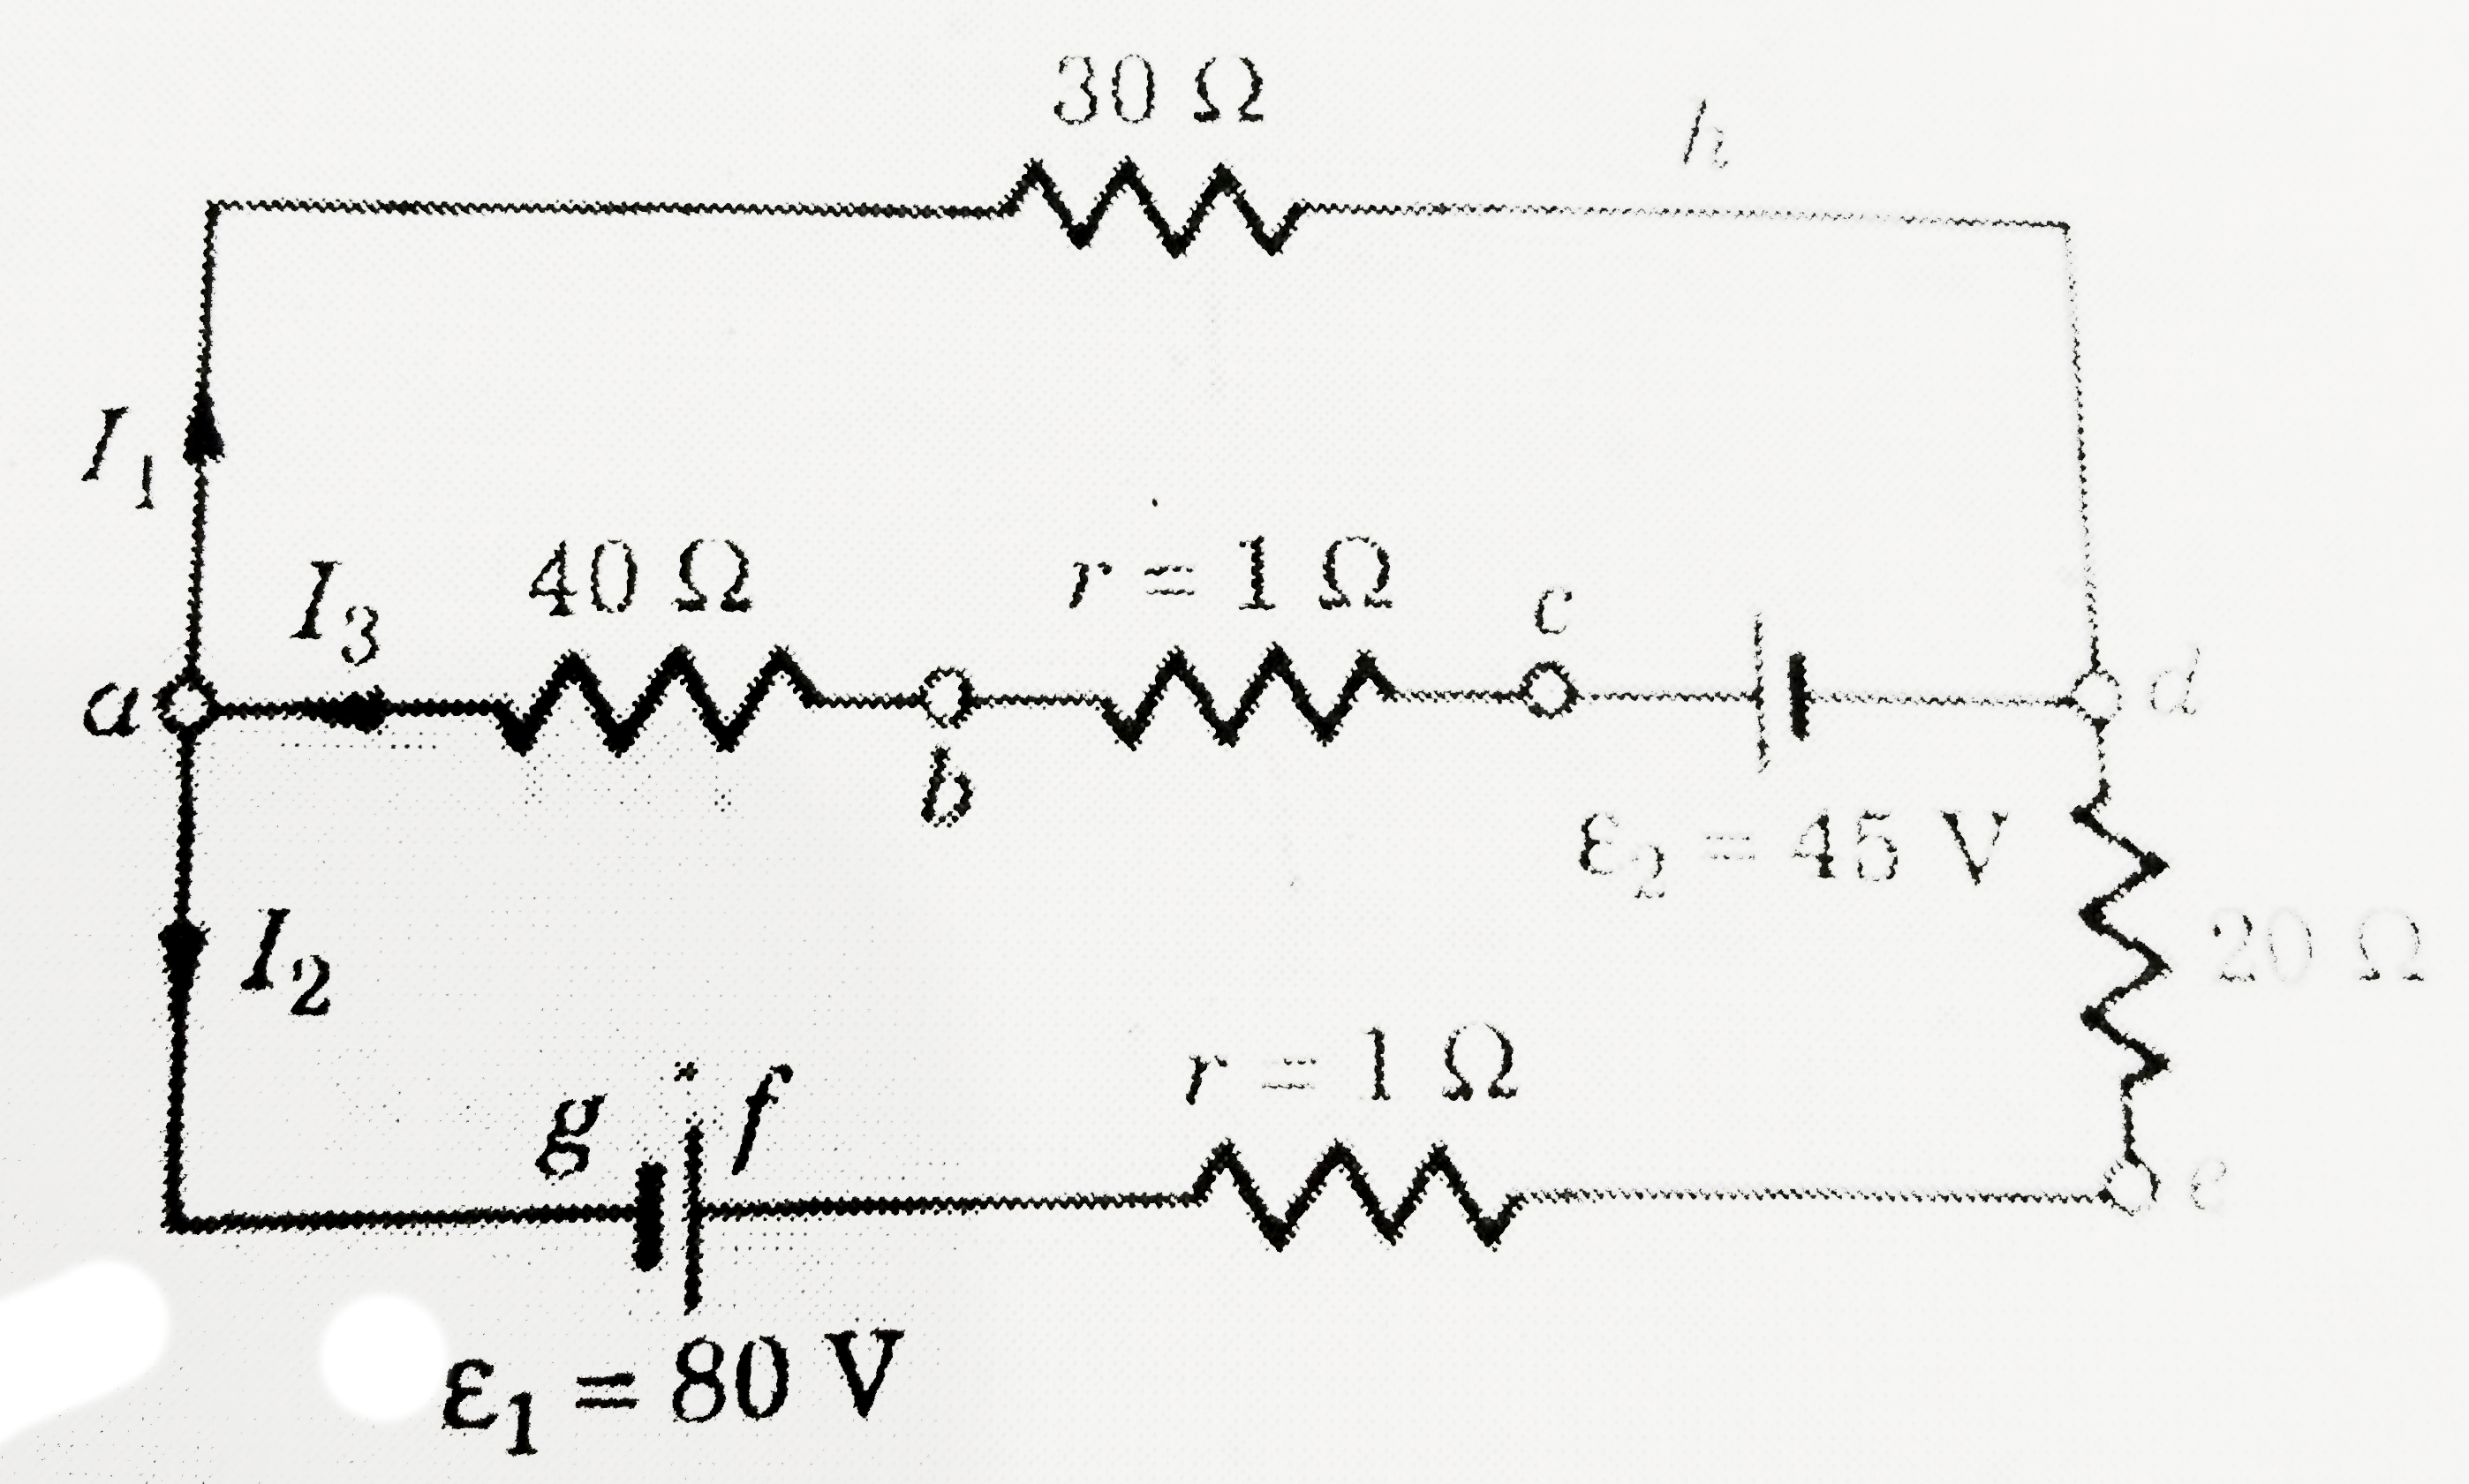
Determine the currents I1,I2andI3 from the network shown in figure.
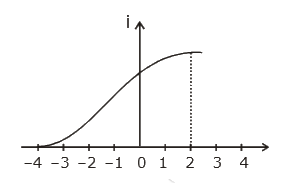
View SolutionFigure represents the graph of photo current I versus applied voltage (V). The maximum kinetic energy of the emitted photoelectrons is
View SolutionThe voltage V and current I graph for a conductor at two different temperatures T1 and T2 are shown in the figure. The relation between T1 and T2 is
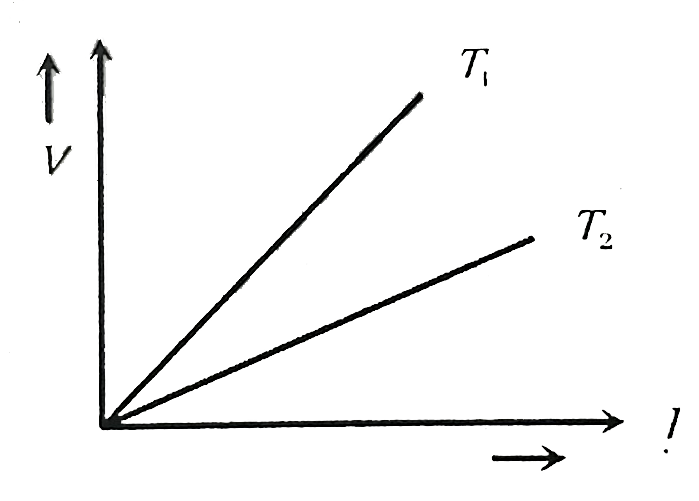
View SolutionThe voltage V and current I v graphs for a conductor at two different temperatures T1andT2 are shown in the figure. The relation between T1andT2 is

View Solution

