Which graph shows the correct variation of angle of incidence and angle of minimum deviation
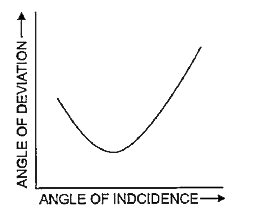
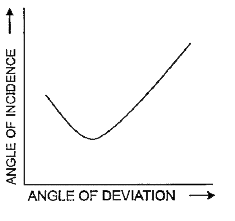
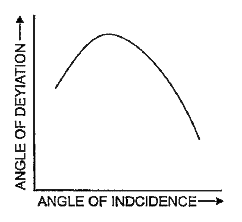
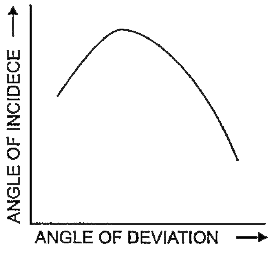
The correct Answer is:A
plot of angular deviation on Y axis and angle of incidence on X axis
Topper's Solved these Questions
Similar Questions
Knowledge Check
Which of the following graphs is the correct angle of incidence vs. angle of deviation graph?
A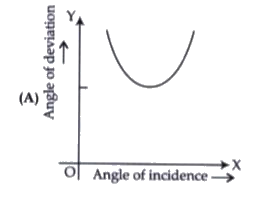 B
B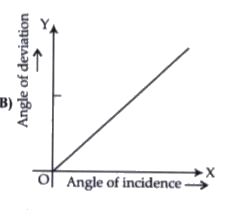 C
C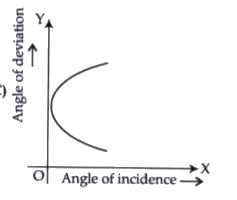 D
D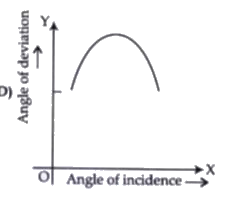
The relation between angle of incidence i, angle of prism A and angle of minimum deviation for a triangular prism is.
Ai=A+δmBi=A+δm2Cδm=i+ADδm=i−A
Plot a graph to show the variation of the angle of deviation as a function of angle of incidence for light rays passing through a prism. Write the relation for the refractive index of the prism in terms of the angle of minimum deviation and the angle of the prism.
View SolutionIn determining the angle of minimum deviation for a given prism, a graph is plotted between the angle of incidence (j) and the angle of deviation (δ). Which of the following graphs will correctly
View SolutionDefine refractive index of a transparent medium. A ray of light passes through a triangular prism. Plot a graph showing the variation of angle of deviation with the angle of incidence. Hence derive prism formula.
View SolutionWrite the relationship between angle of incidence 'i', angle of prism 'A' and angle of minimum deviation for a triangular prism.
View SolutionDefine refractive index of a transparent medium. A ray of light passes through a triangular prism. Plot a graph showing the variation of the angle of deviation with the angle of incidence.
View SolutionDefine refractive index of a transparent medium. A ray of light passes through a triangular prism. Plot a graph showing the variation of angle of deviation with the angle of incidence.
View Solution
