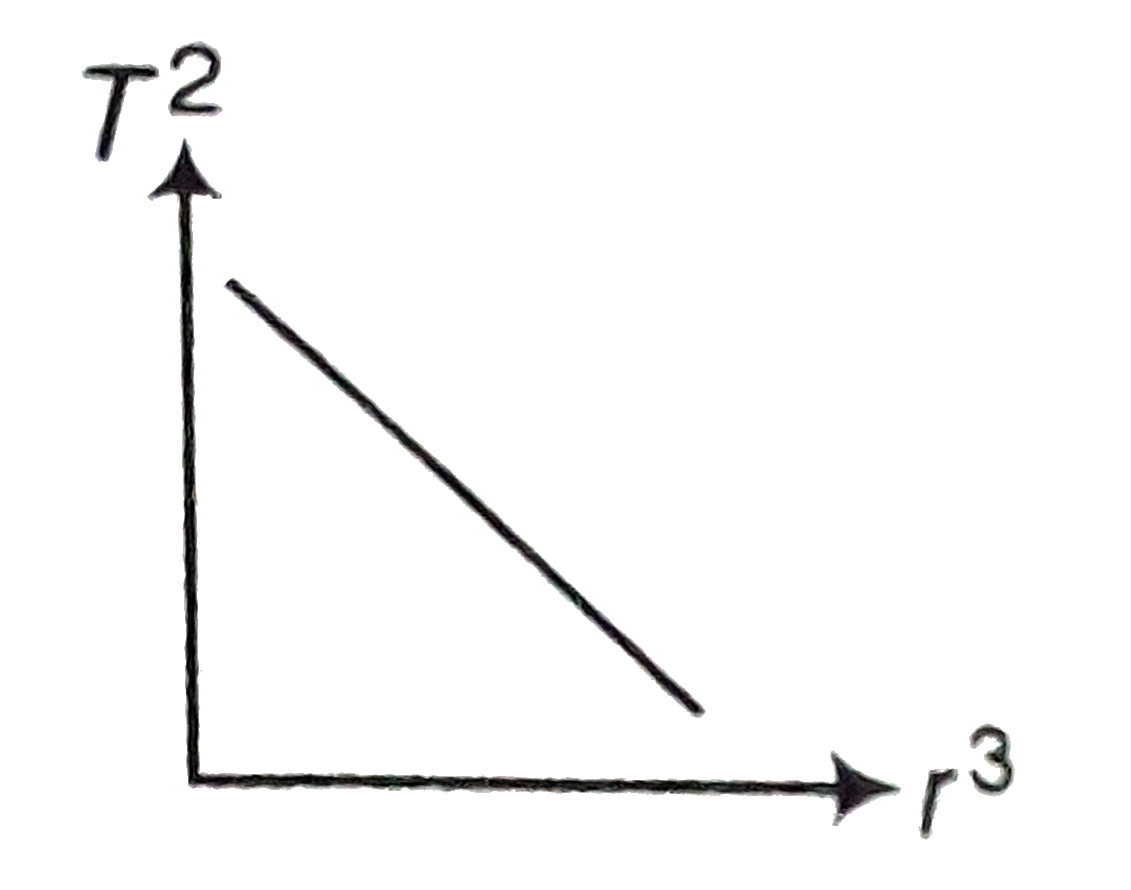
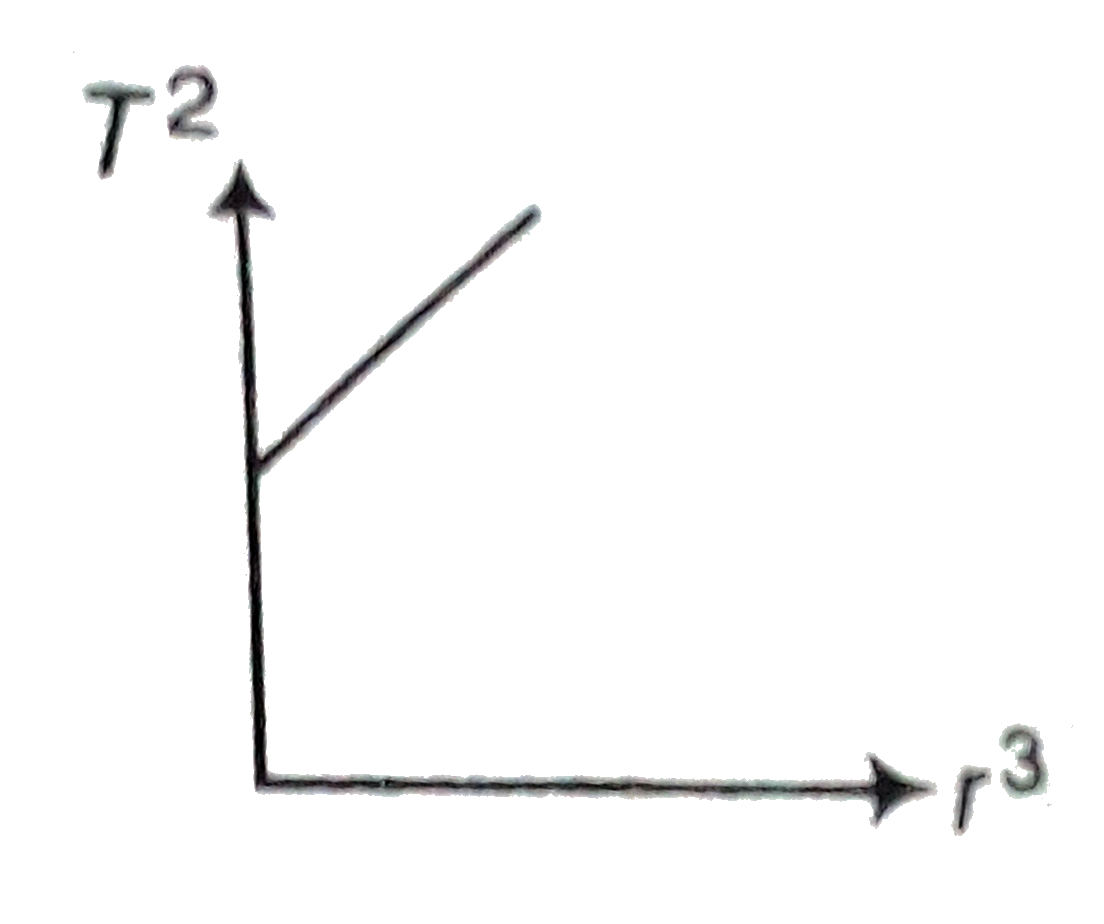
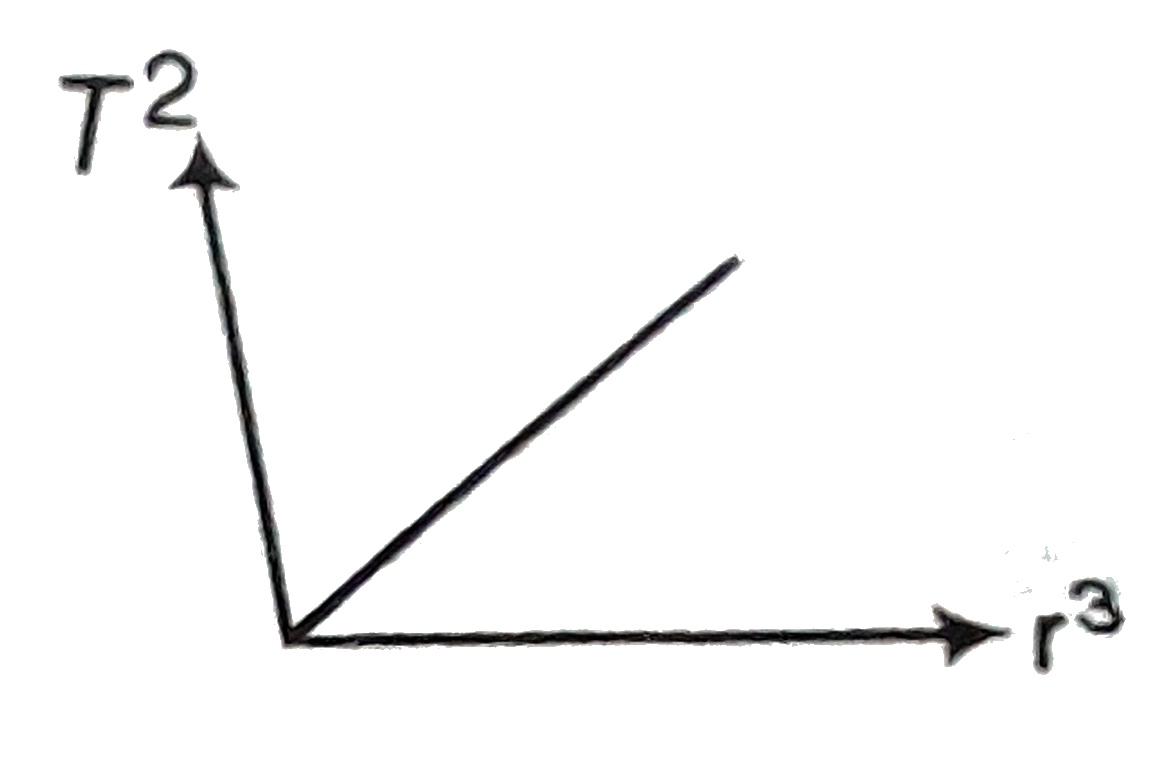
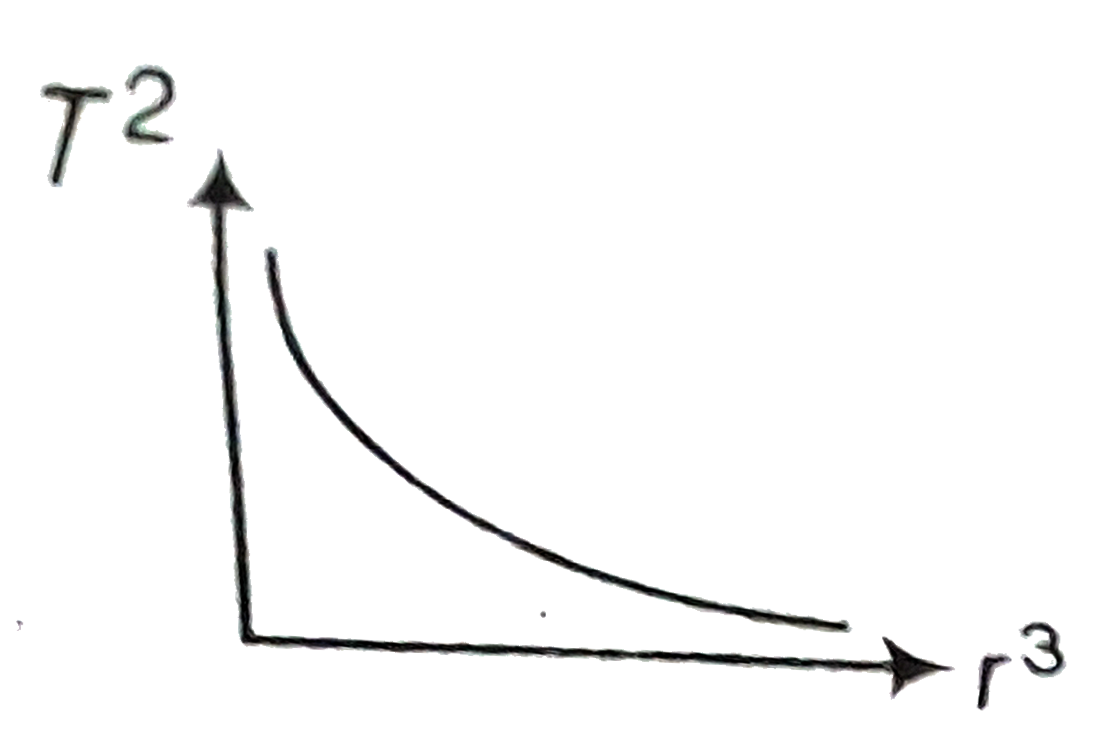
Which of the following graphs between the square of the time period and cube of the distance of the planet from the sun is correct ?
A
B
C
D
Video Solution
Text Solution
The correct Answer is:D
According to kepler s third law T2∝r3 , at r=0 T=0 It shows that the graph between T2 and r3 is straight line passing through origin
|
Topper's Solved these Questions
- GRAVITATION BOOK - MHTCET PREVIOUS YEAR PAPERS AND PRACTICE PAPERSCHAPTER - GRAVITATION EXERCISE - Exercise 2
36 Videos
- GRAVITATION BOOK - MHTCET PREVIOUS YEAR PAPERS AND PRACTICE PAPERSCHAPTER - GRAVITATION EXERCISE - MHT CET Corner
20 Videos
- GRAVITATION BOOK - MHTCET PREVIOUS YEAR PAPERS AND PRACTICE PAPERSCHAPTER - GRAVITATION EXERCISE - MHT CET Corner
20 Videos
- FRICTION IN SOLID AND LIQUIDSBOOK - MHTCET PREVIOUS YEAR PAPERS AND PRACTICE PAPERSCHAPTER - FRICTION IN SOLID AND LIQUIDSEXERCISE - EXERCISE 2 (Miscellaneous Problems)
24 Videos
- INTERFERENCE AND DIFFRACTION OF LIGHT BOOK - MHTCET PREVIOUS YEAR PAPERS AND PRACTICE PAPERSCHAPTER - INTERFERENCE AND DIFFRACTION OF LIGHT EXERCISE - MHT CET Corner
24 Videos
Similar Questions
Knowledge Check
Which of the following is the farthest planet to the Sun?
AMarsBJupiterCVenusDEarthWhich of the following graph depicts relation between time period (T) and radius of orbit (r) of a planet ?
A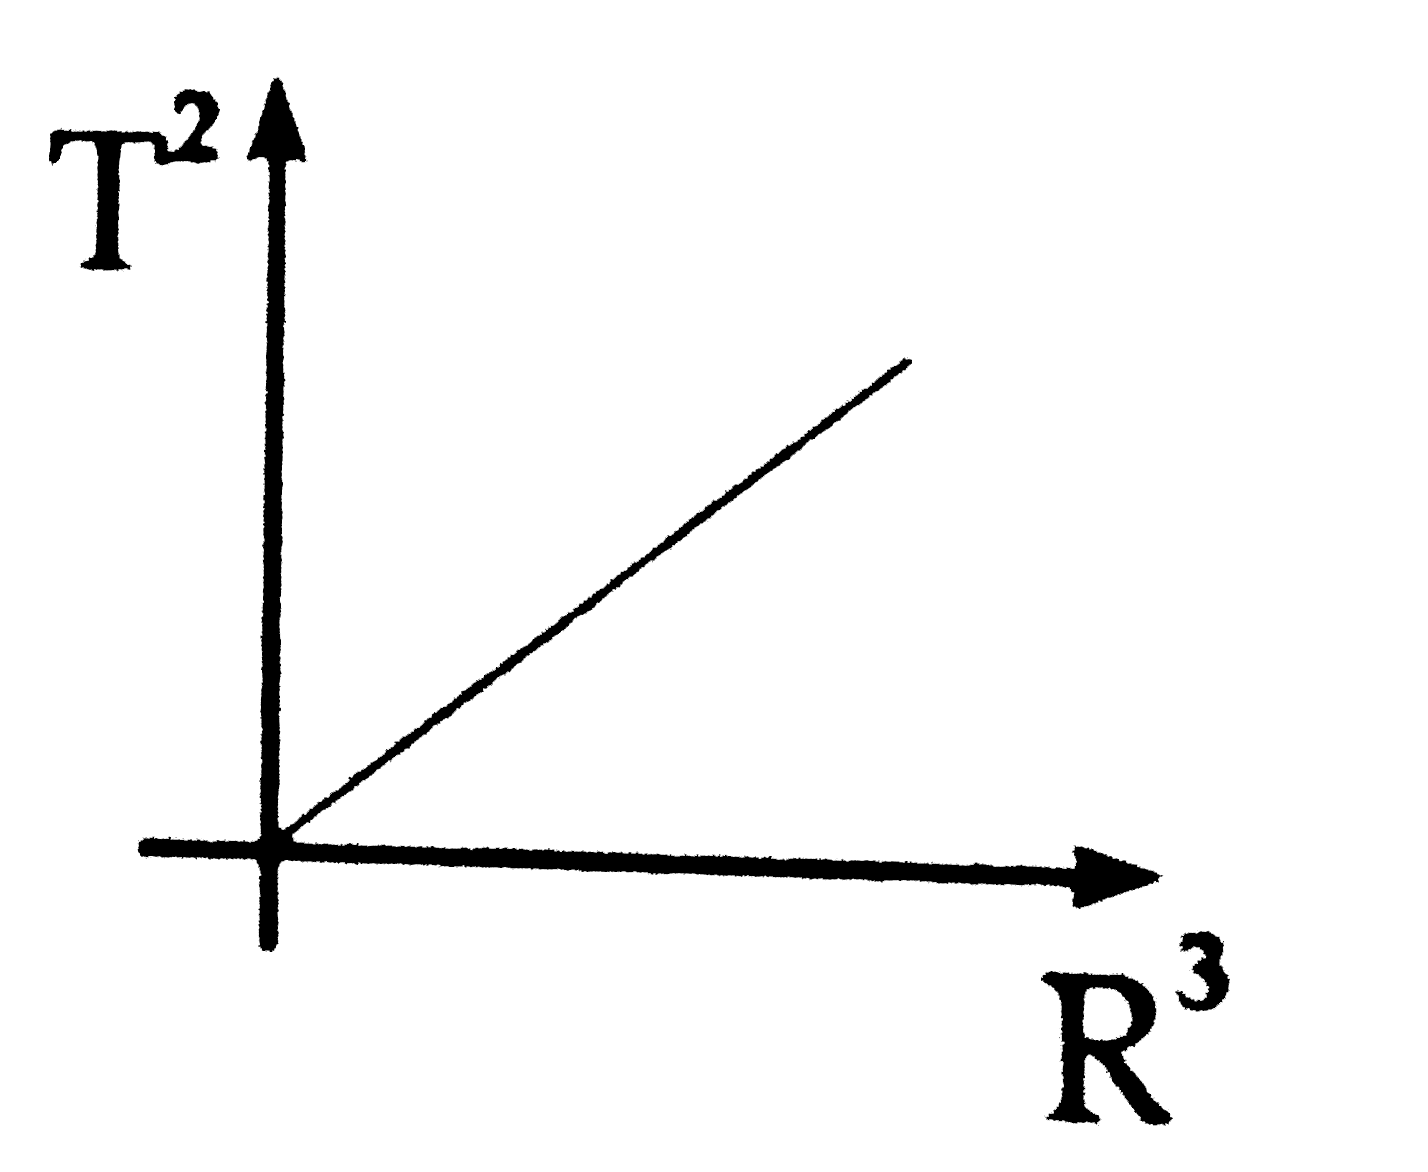 B
B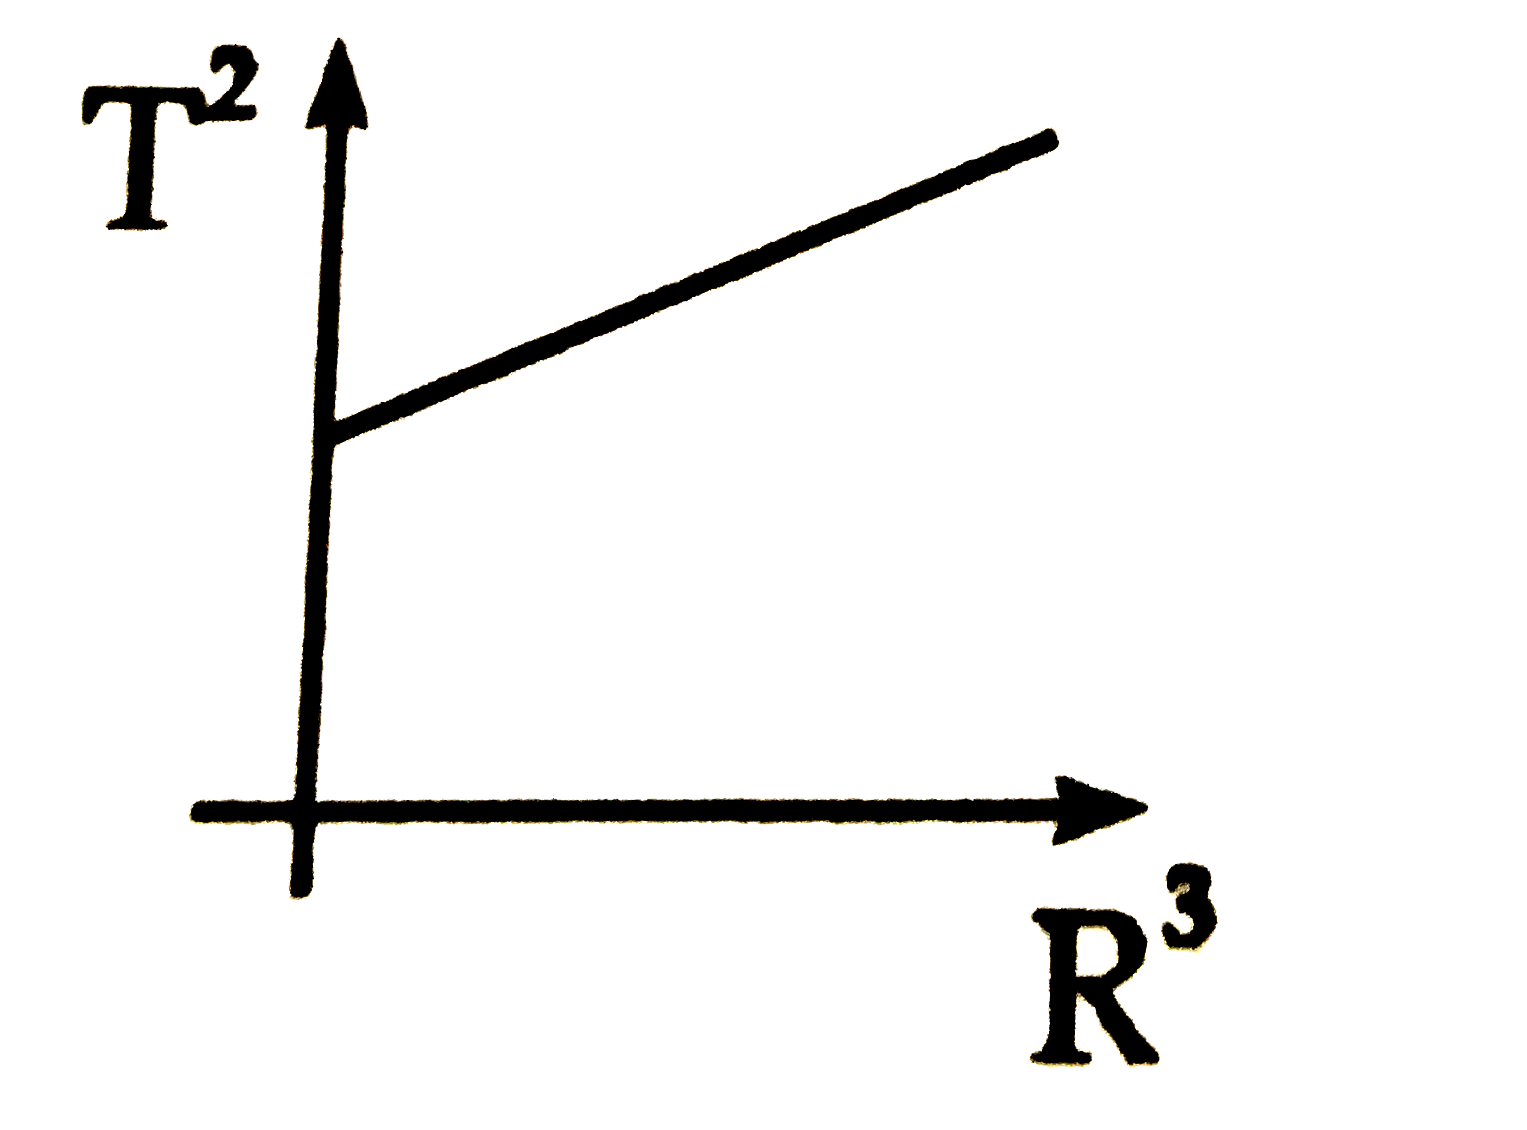 C
C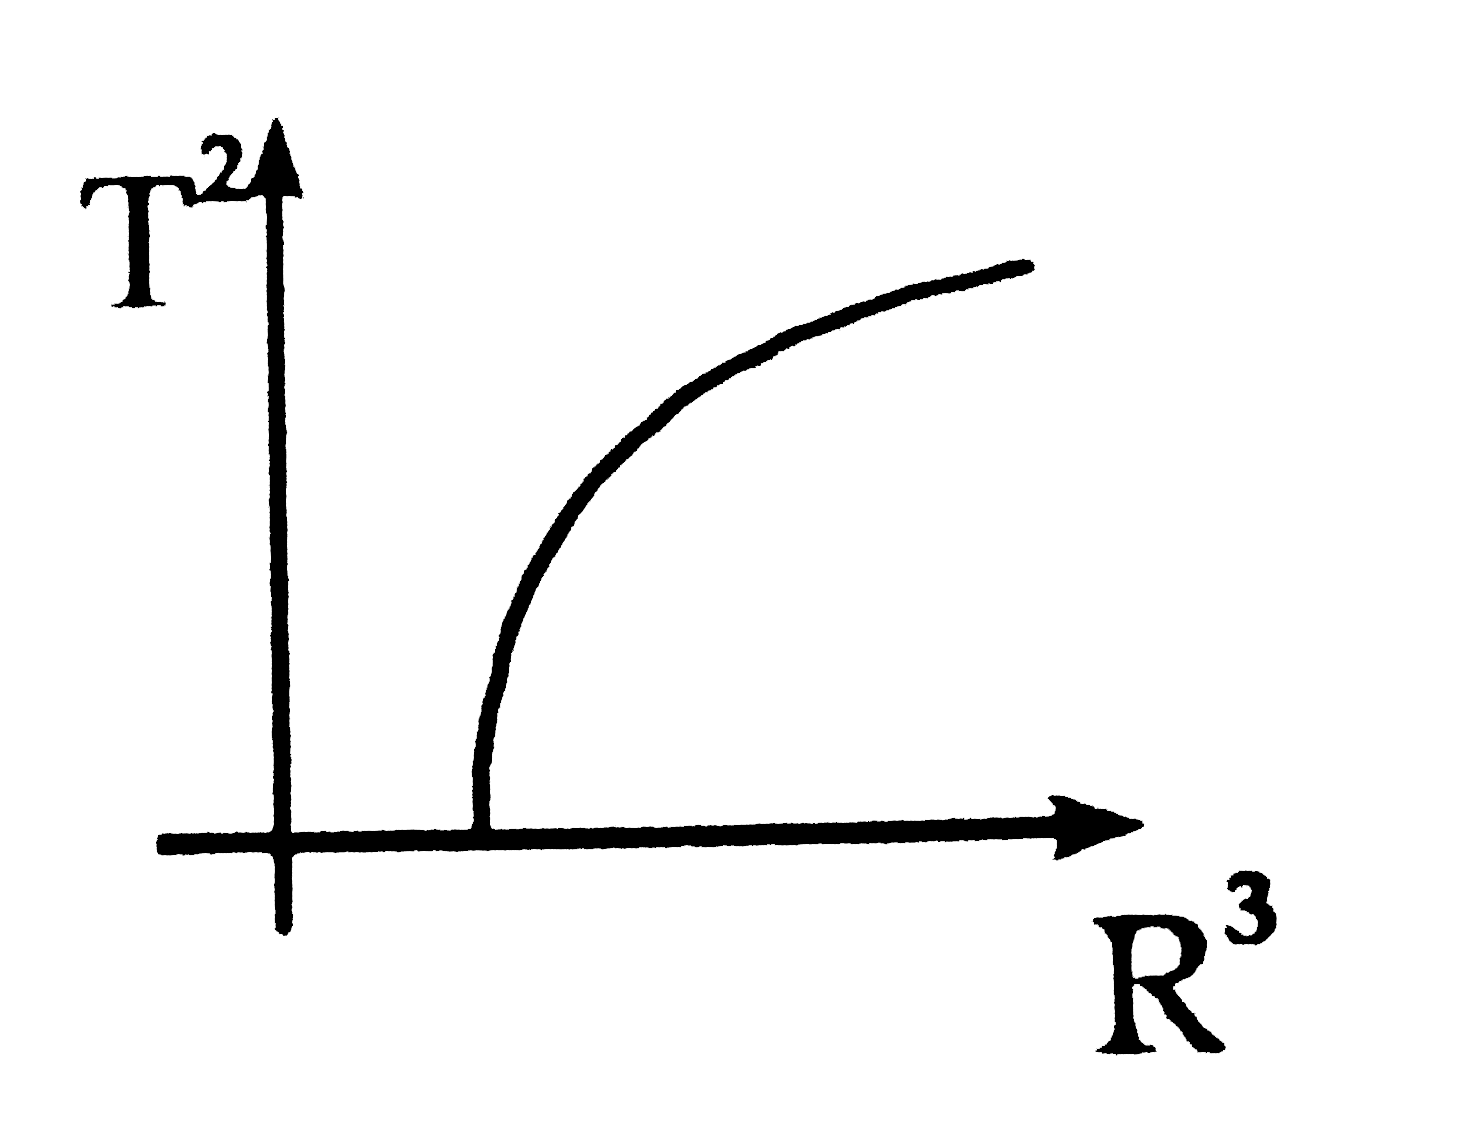 D
D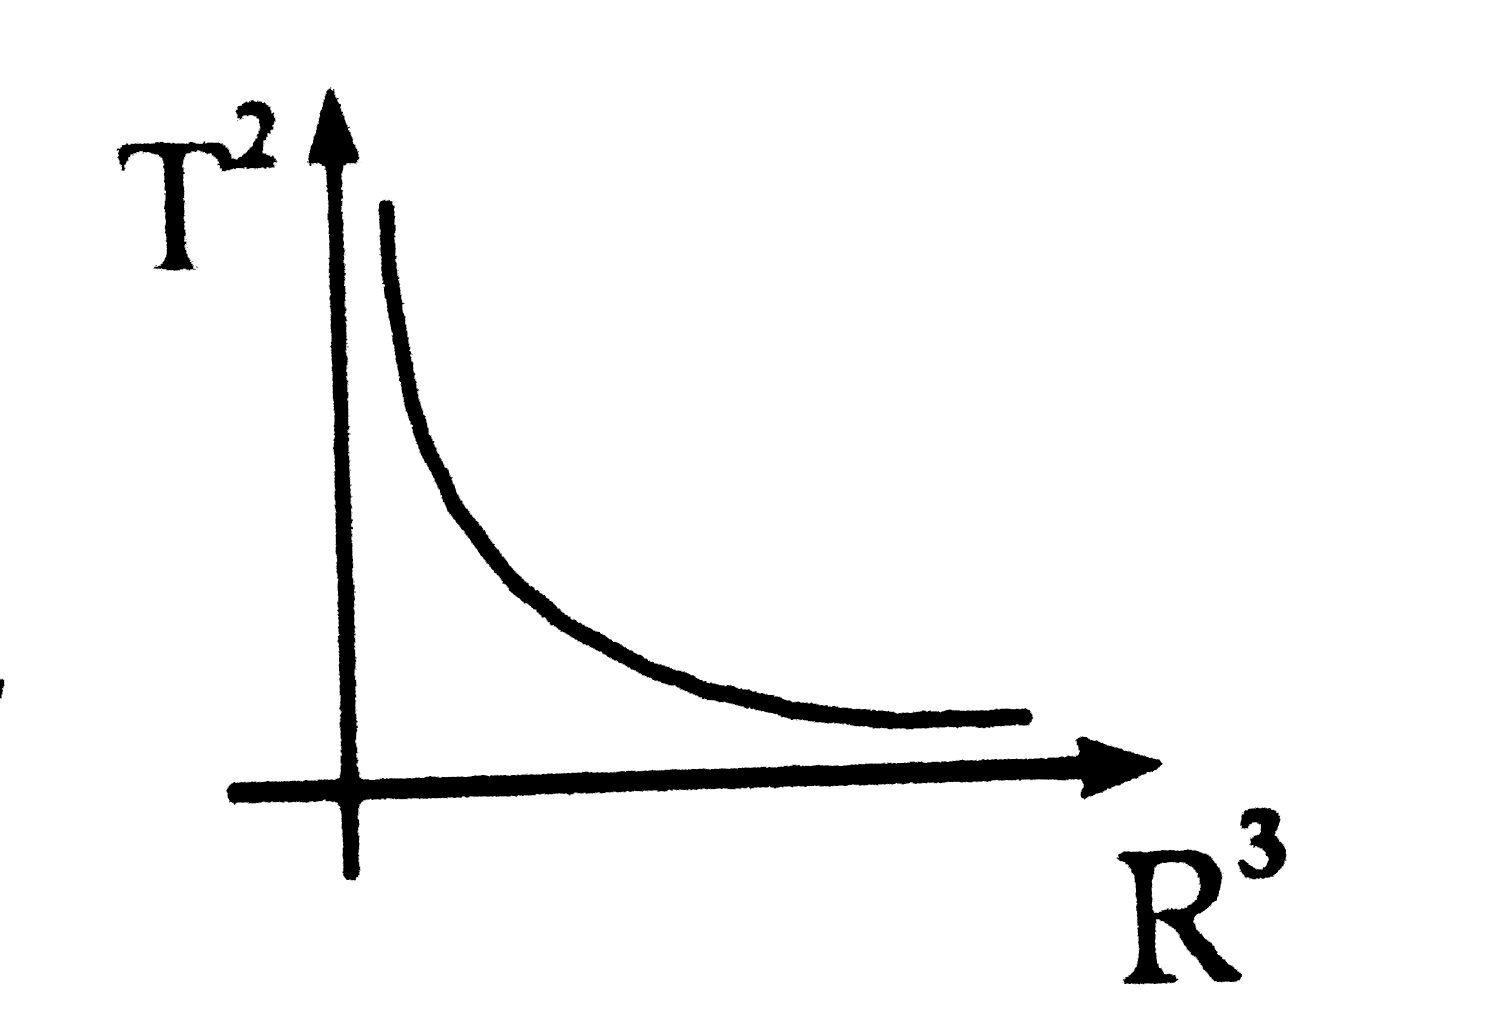
Which of the following is not a planet of the Sun ?
ASiriusBMercuryCSaturnDEarth
Which of the following is not a planet of the Sun ?
View SolutionWhich of the following planet is farthest from Sun?
View SolutionThe graph between the length and square of the period of a simple pendulum is a
View SolutionThe period of revolution of a planet around the sun is 8 times that of the earth. If the mean distance of that planet from the sun is r, then mean distance of earth from the sun is
View SolutionWhich of the following graphs represents the motion of the planet moving about the Sun. T is the periode of revolution and r is the average distance (from centre to centre) between the sun and the planet
View Solution
