Which of the following P−V diagrams best represents an isothermal process?
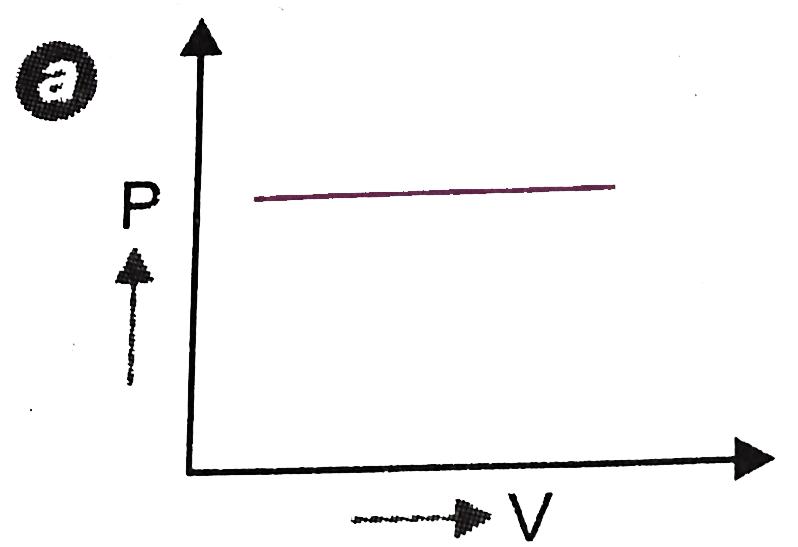
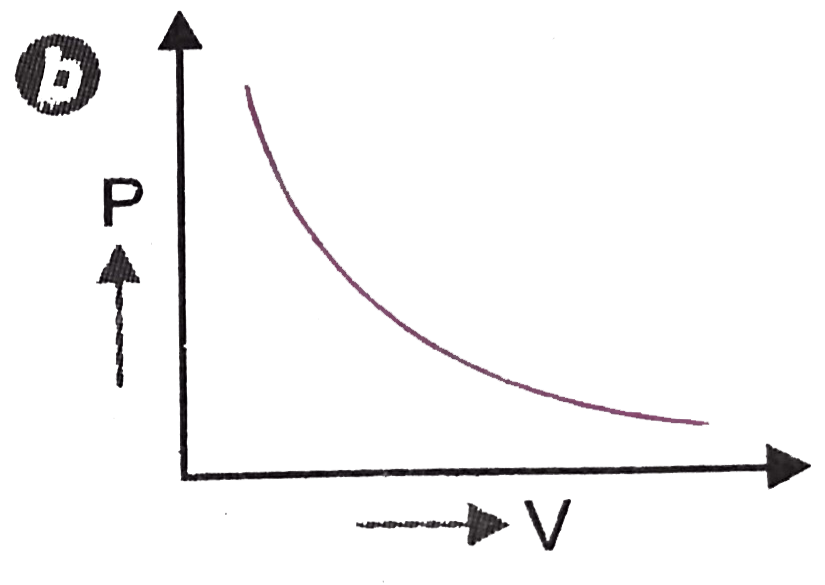
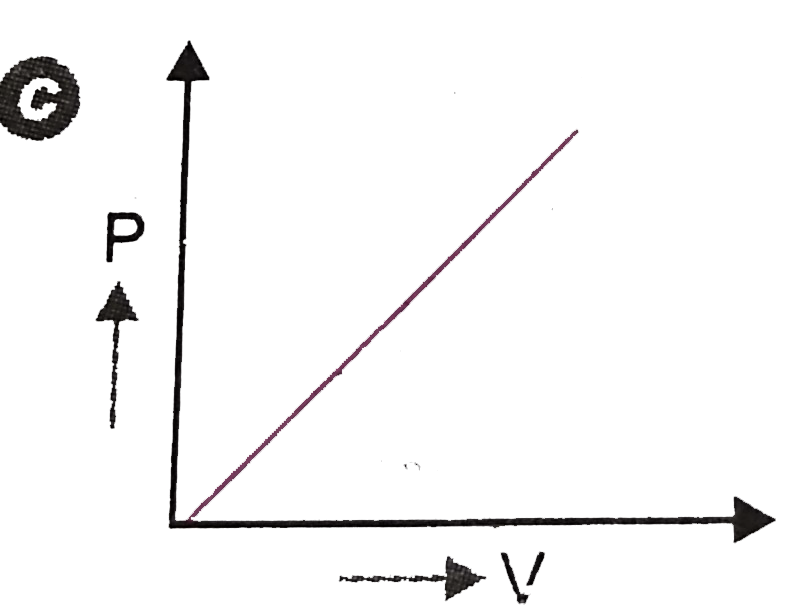
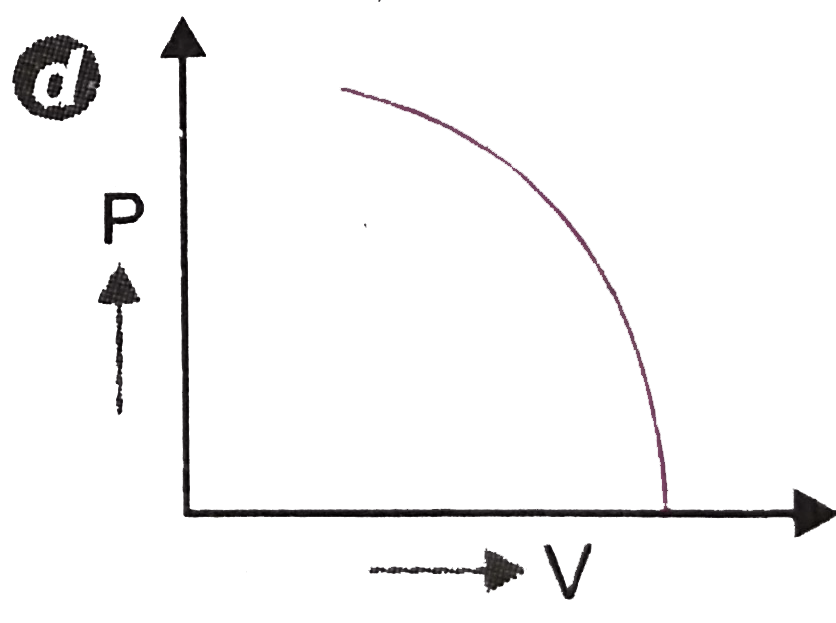
The correct Answer is:B
To determine which P−V diagram best represents an isothermal process, we need to understand the characteristics of such a process.
1. Understanding Isothermal Process:
- An isothermal process is defined as a thermodynamic process in which the temperature remains constant. For an ideal gas, this means that the product of pressure (P) and volume (V) is constant as well, according to the equation \(PV = nRT\), where \(n\) is the number of moles and \(R\) is the ideal gas constant.
2. Relationship Between Pressure and Volume:
- Since temperature (T) is constant, we can express the relationship between pressure and volume as:
\(
PV = \text{constant}
\)
- Rearranging this gives:
\(
P = \frac{C}{V}
\)
- This indicates that pressure is inversely proportional to volume. As volume increases, pressure decreases, and vice versa.
3. Analyzing the Options:
- Option A: If the diagram shows pressure constant while volume changes, this does not represent an isothermal process.
- Option B: If the diagram shows a curve where pressure decreases as volume increases, this indicates an inverse relationship, which is characteristic of an isothermal process.
- Option C: If the diagram shows pressure and volume both increasing together, this does not represent an isothermal process.
- Option D: If the diagram indicates that when pressure is zero, volume is also zero, this is incorrect as it contradicts the inverse relationship; when pressure is zero, volume should be infinite.
4. Conclusion:
- The only option that accurately represents the relationship \(P \propto \frac{1}{V}\) is Option B, where pressure decreases as volume increases, indicating an isothermal process.
Final Answer:
Option B represents the isothermal process in the P−V diagram.
- An isothermal process is defined as a thermodynamic process in which the temperature remains constant. For an ideal gas, this means that the product of pressure (P) and volume (V) is constant as well, according to the equation \(PV = nRT\), where \(n\) is the number of moles and \(R\) is the ideal gas constant.
- Since temperature (T) is constant, we can express the relationship between pressure and volume as:
\(
PV = \text{constant}
\)
- Rearranging this gives:
\(
P = \frac{C}{V}
\)
- This indicates that pressure is inversely proportional to volume. As volume increases, pressure decreases, and vice versa.
- Option A: If the diagram shows pressure constant while volume changes, this does not represent an isothermal process.
- Option B: If the diagram shows a curve where pressure decreases as volume increases, this indicates an inverse relationship, which is characteristic of an isothermal process.
- Option C: If the diagram shows pressure and volume both increasing together, this does not represent an isothermal process.
- Option D: If the diagram indicates that when pressure is zero, volume is also zero, this is incorrect as it contradicts the inverse relationship; when pressure is zero, volume should be infinite.
- The only option that accurately represents the relationship \(P \propto \frac{1}{V}\) is Option B, where pressure decreases as volume increases, indicating an isothermal process.
Option B represents the isothermal process in the P−V diagram.
Topper's Solved these Questions
- THERMODYNAMICSBOOK - PRADEEPCHAPTER - THERMODYNAMICSEXERCISE - Interger Type questions
11 Videos
- THERMODYNAMICSBOOK - PRADEEPCHAPTER - THERMODYNAMICSEXERCISE - Assertion- Reason Type Questions
19 Videos
- THERMODYNAMICSBOOK - PRADEEPCHAPTER - THERMODYNAMICSEXERCISE - Multiple choice questions (NCERT)
10 Videos
- SYSTEMS OF PARTICLES AND ROTATIONAL MOTIONBOOK - PRADEEPCHAPTER - SYSTEMS OF PARTICLES AND ROTATIONAL MOTIONEXERCISE - Assertion- Reason Type questions
20 Videos
- WORK, ENERGY AND POWERBOOK - PRADEEPCHAPTER - WORK, ENERGY AND POWEREXERCISE - Assertion-Reason Type Questions
24 Videos
Similar Questions
Knowledge Check
Which of the following P-V curve best represents. As isothermal process?
A B
B C
C D
D
Which of the following P-V curve best represents. As isothermal process?
A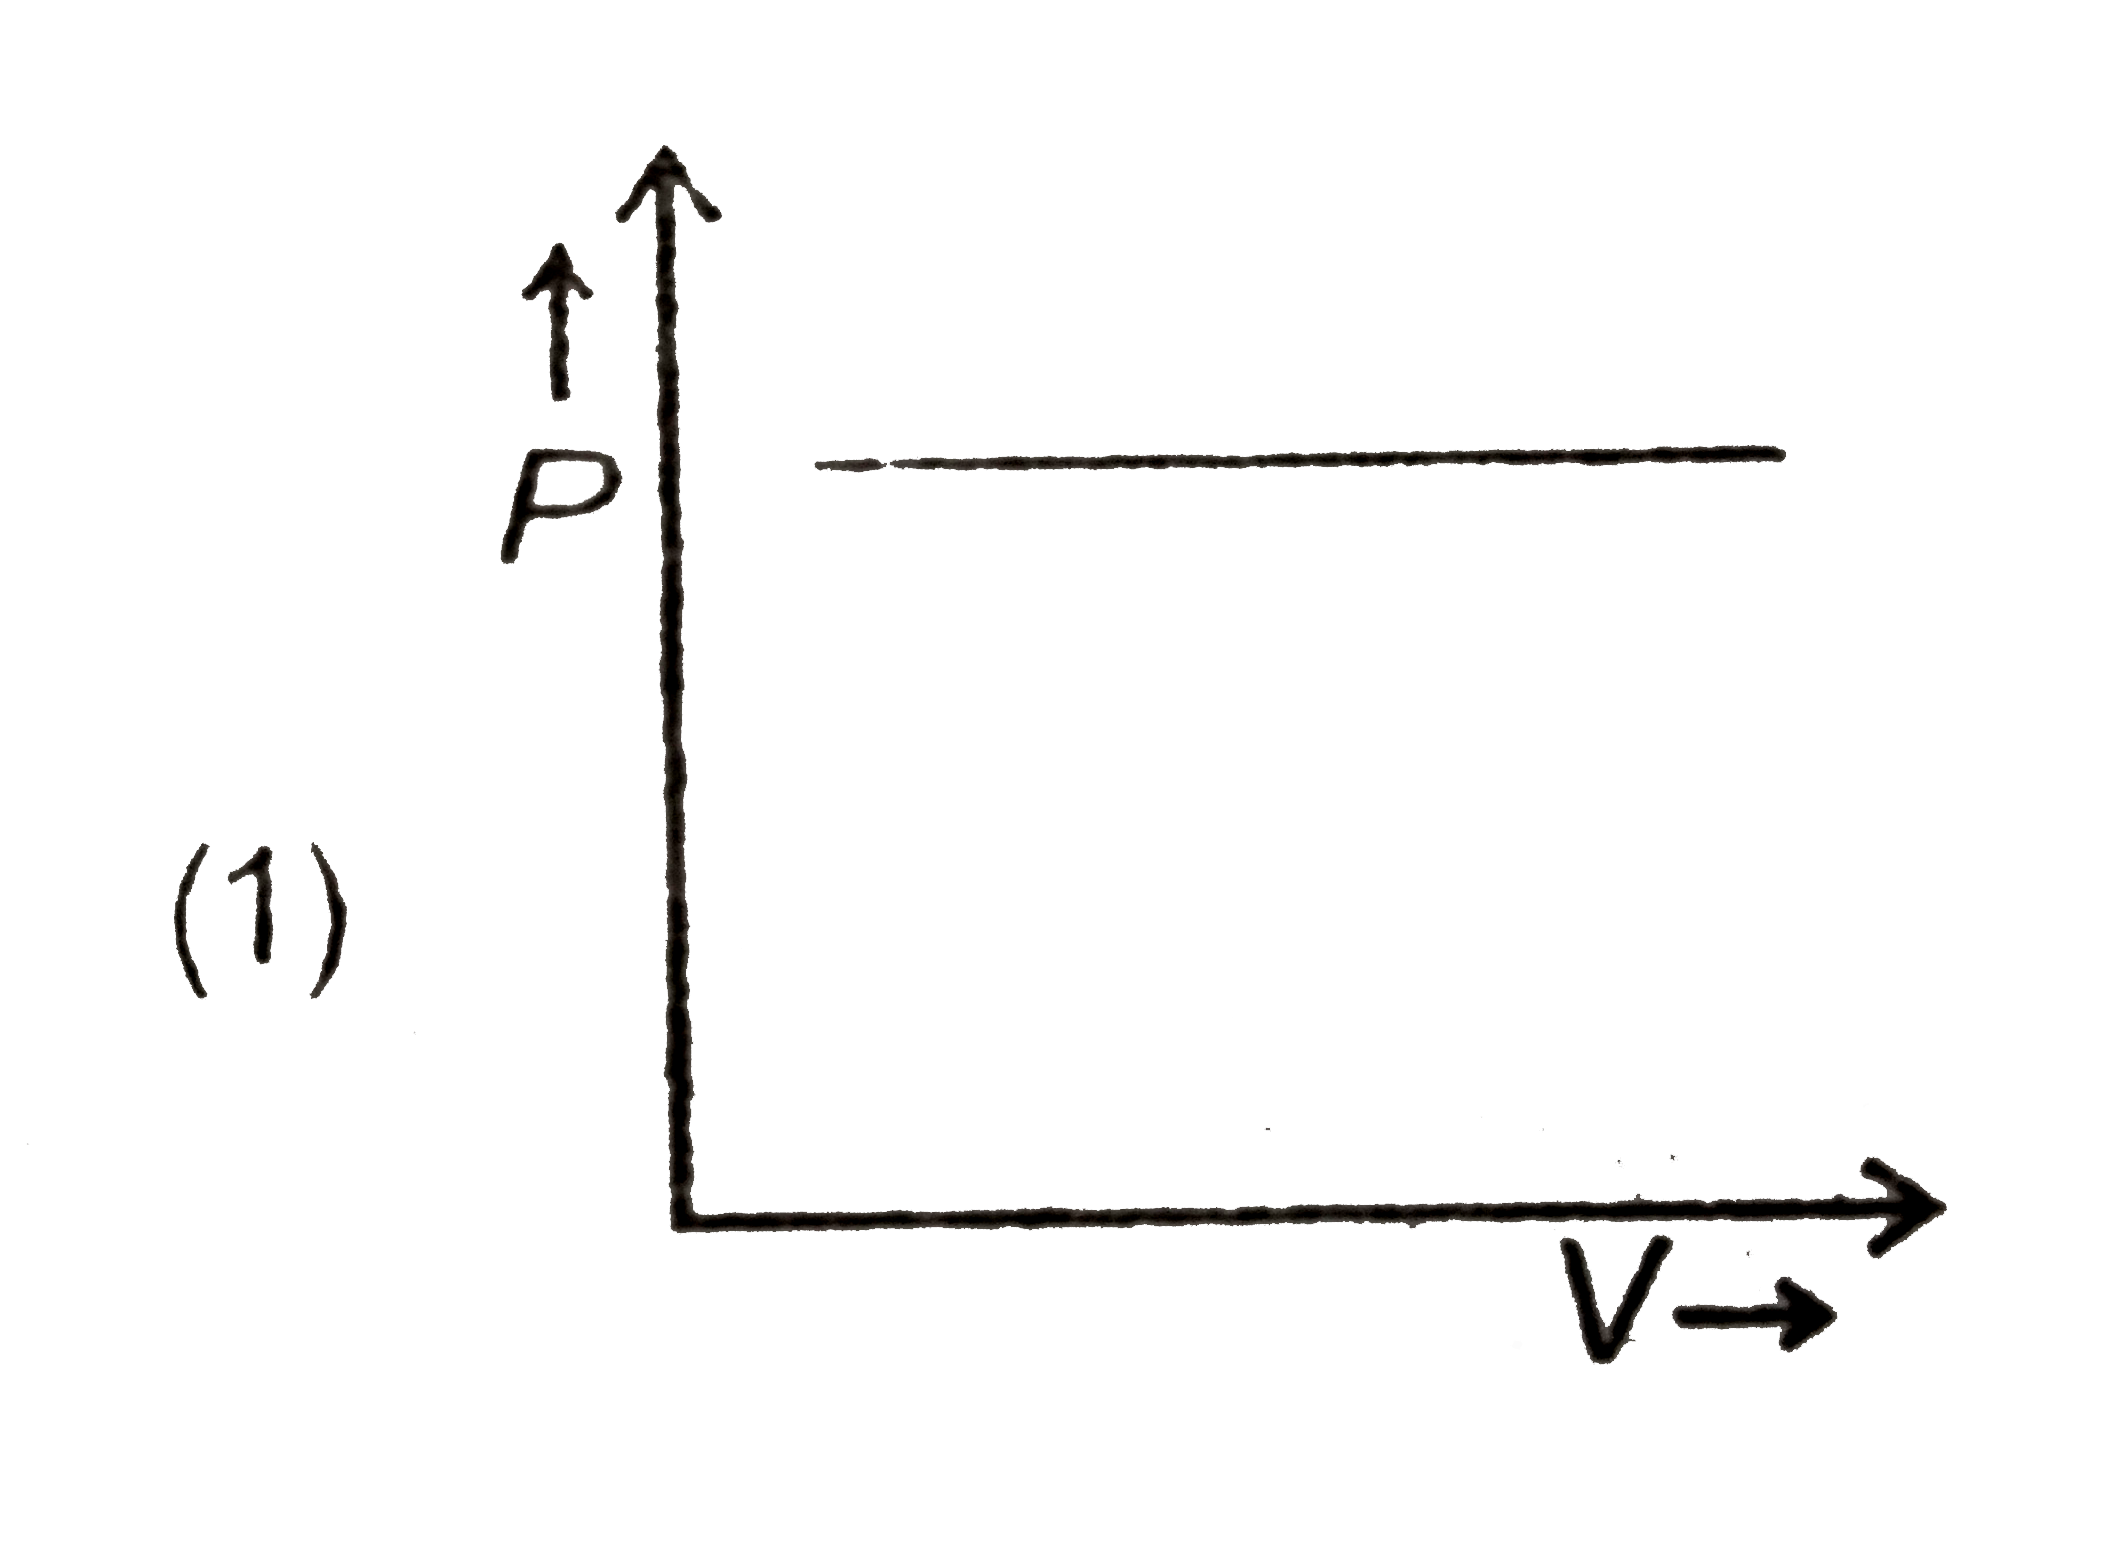 B
B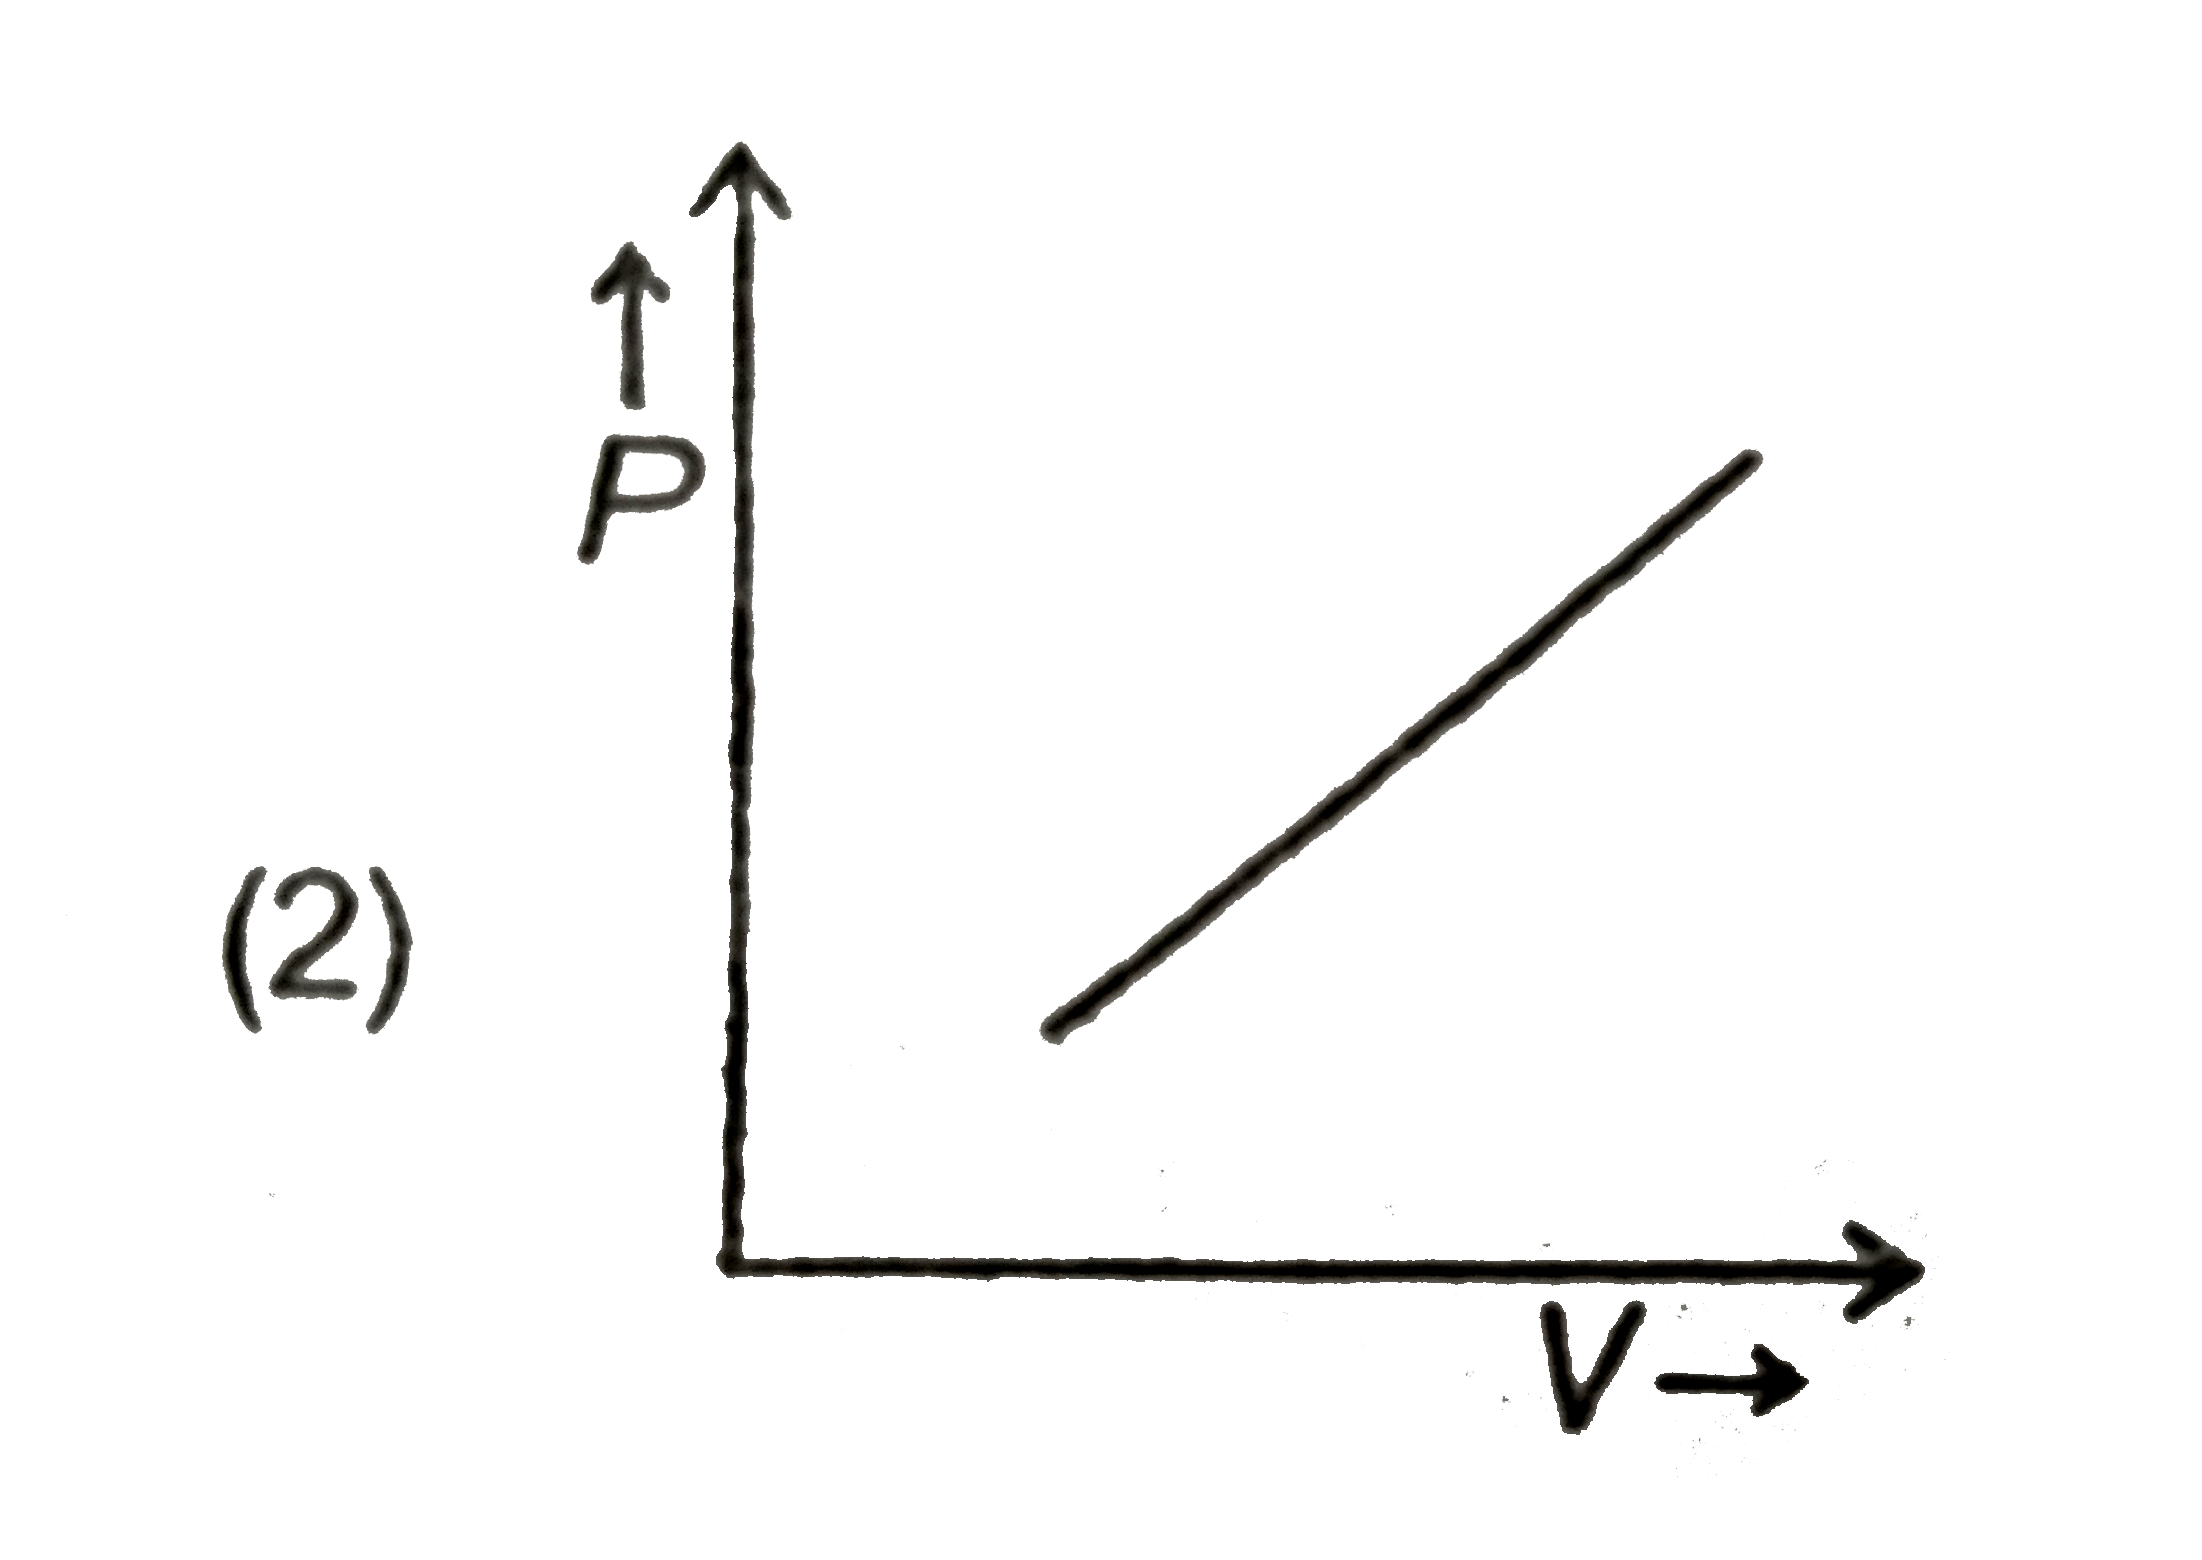 C
C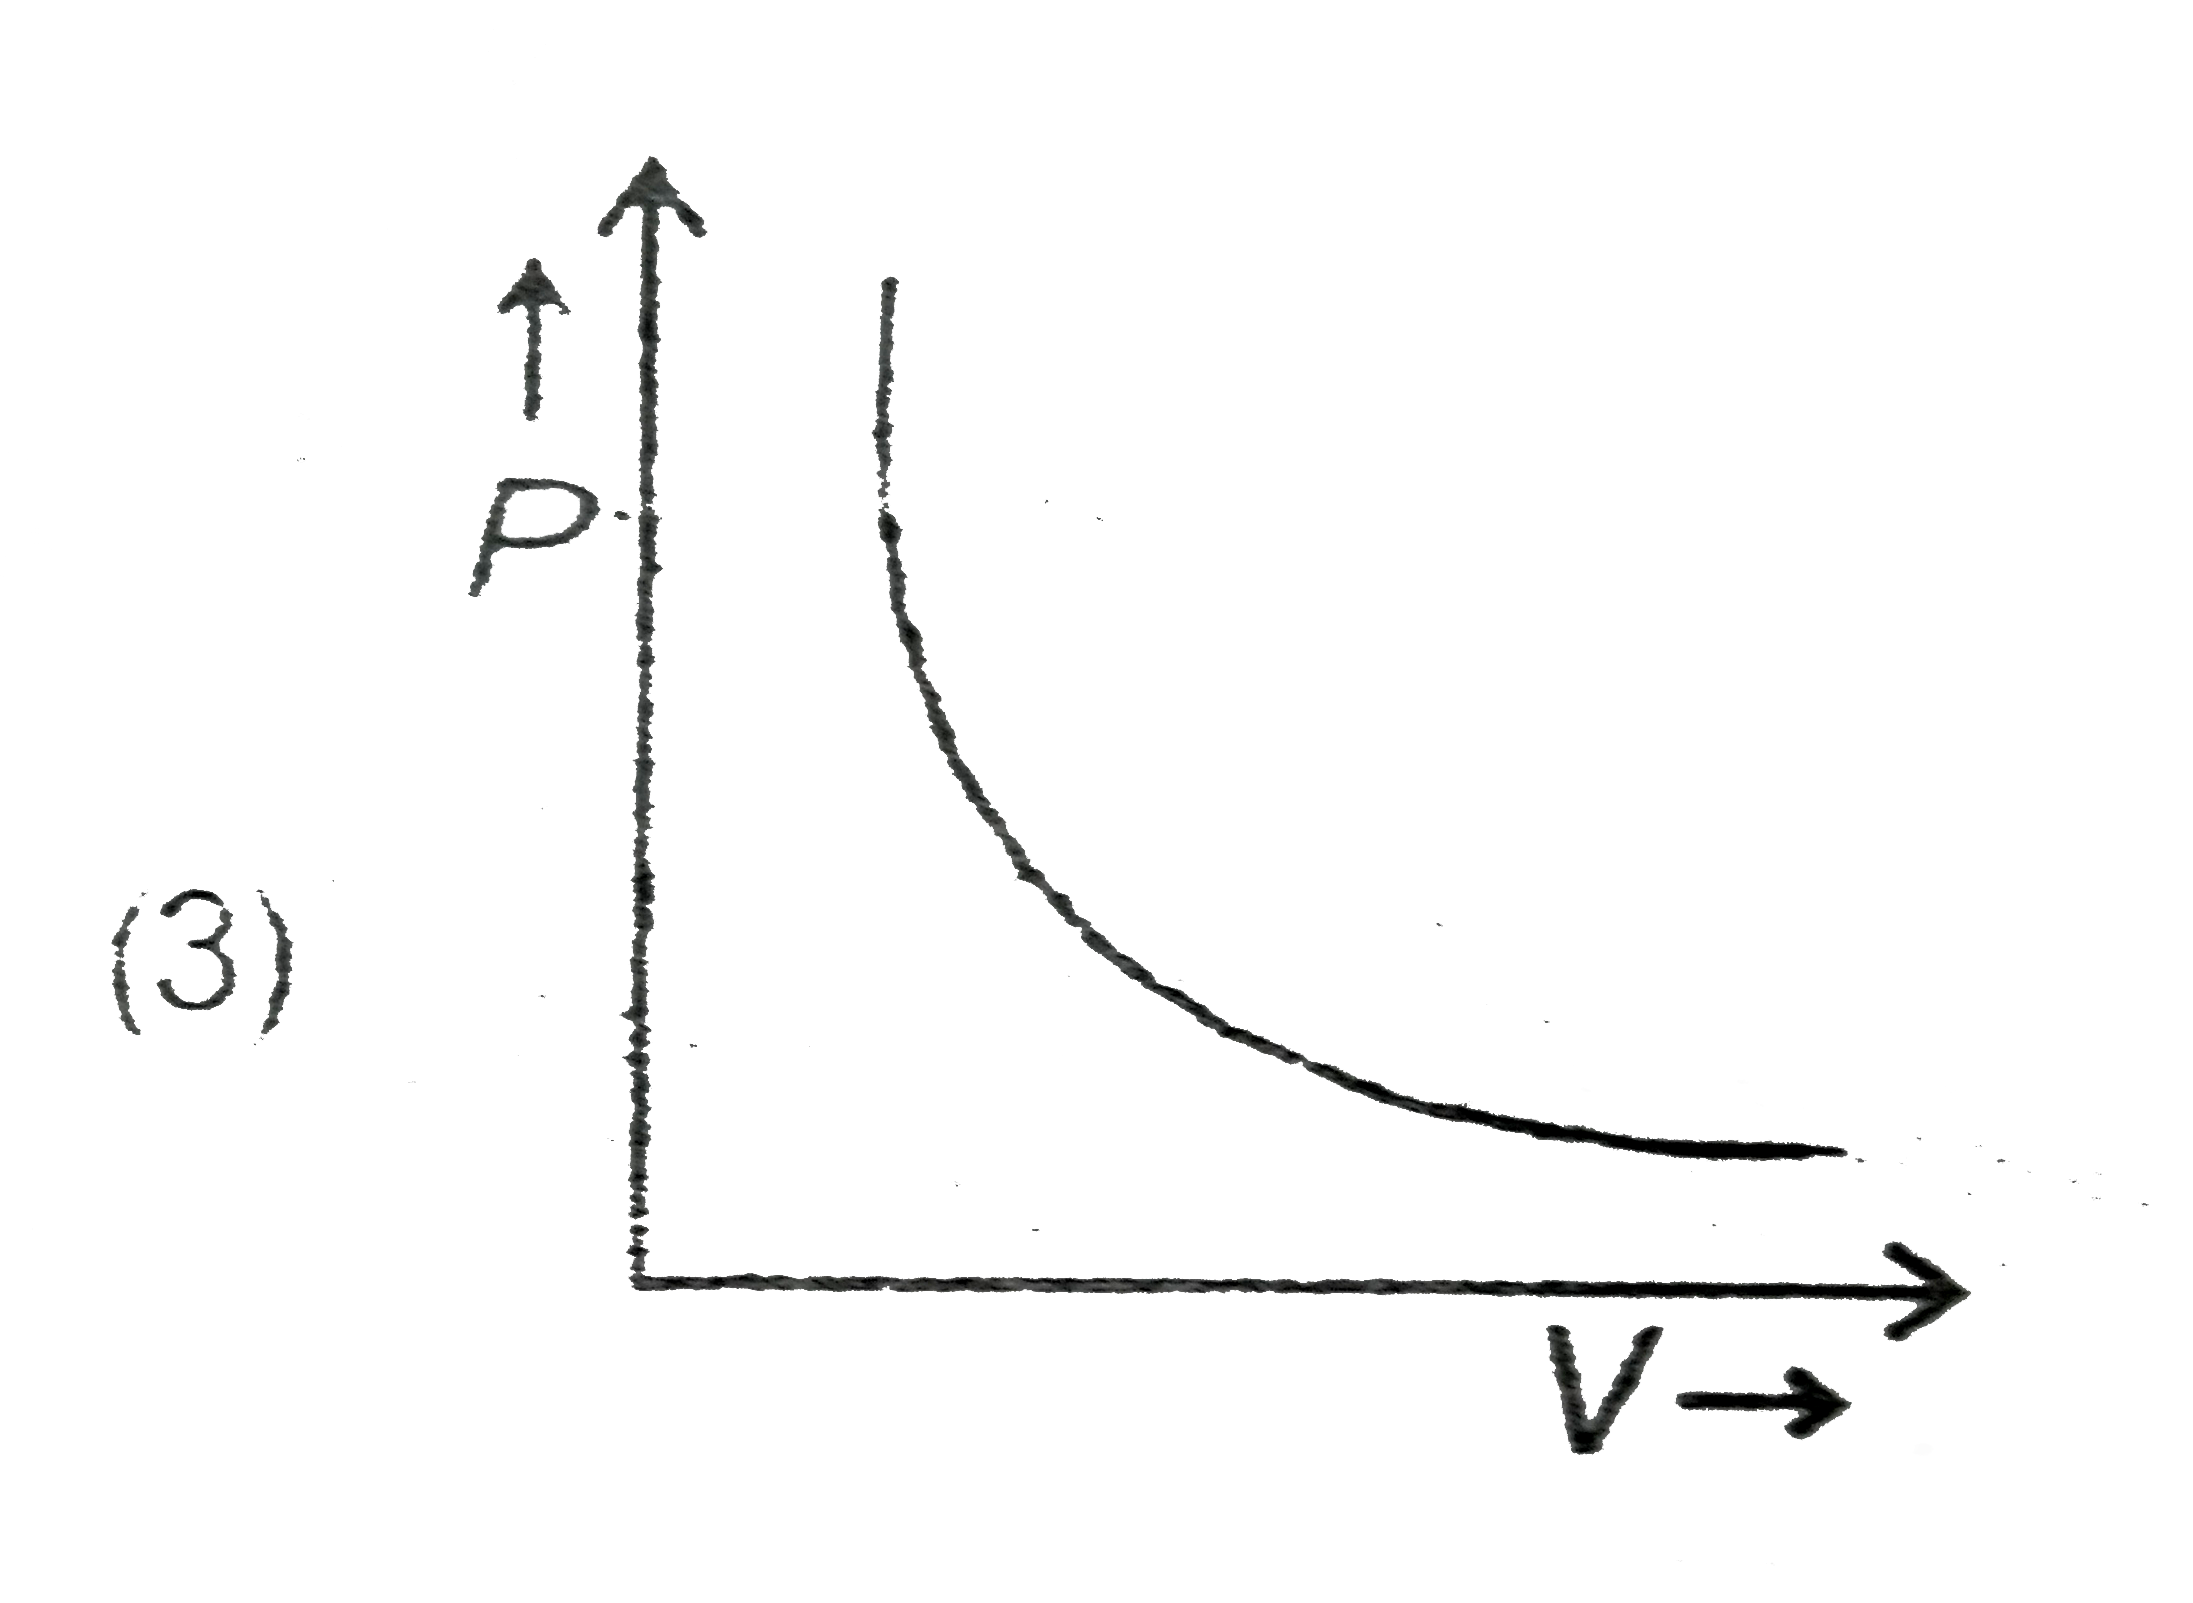 D
D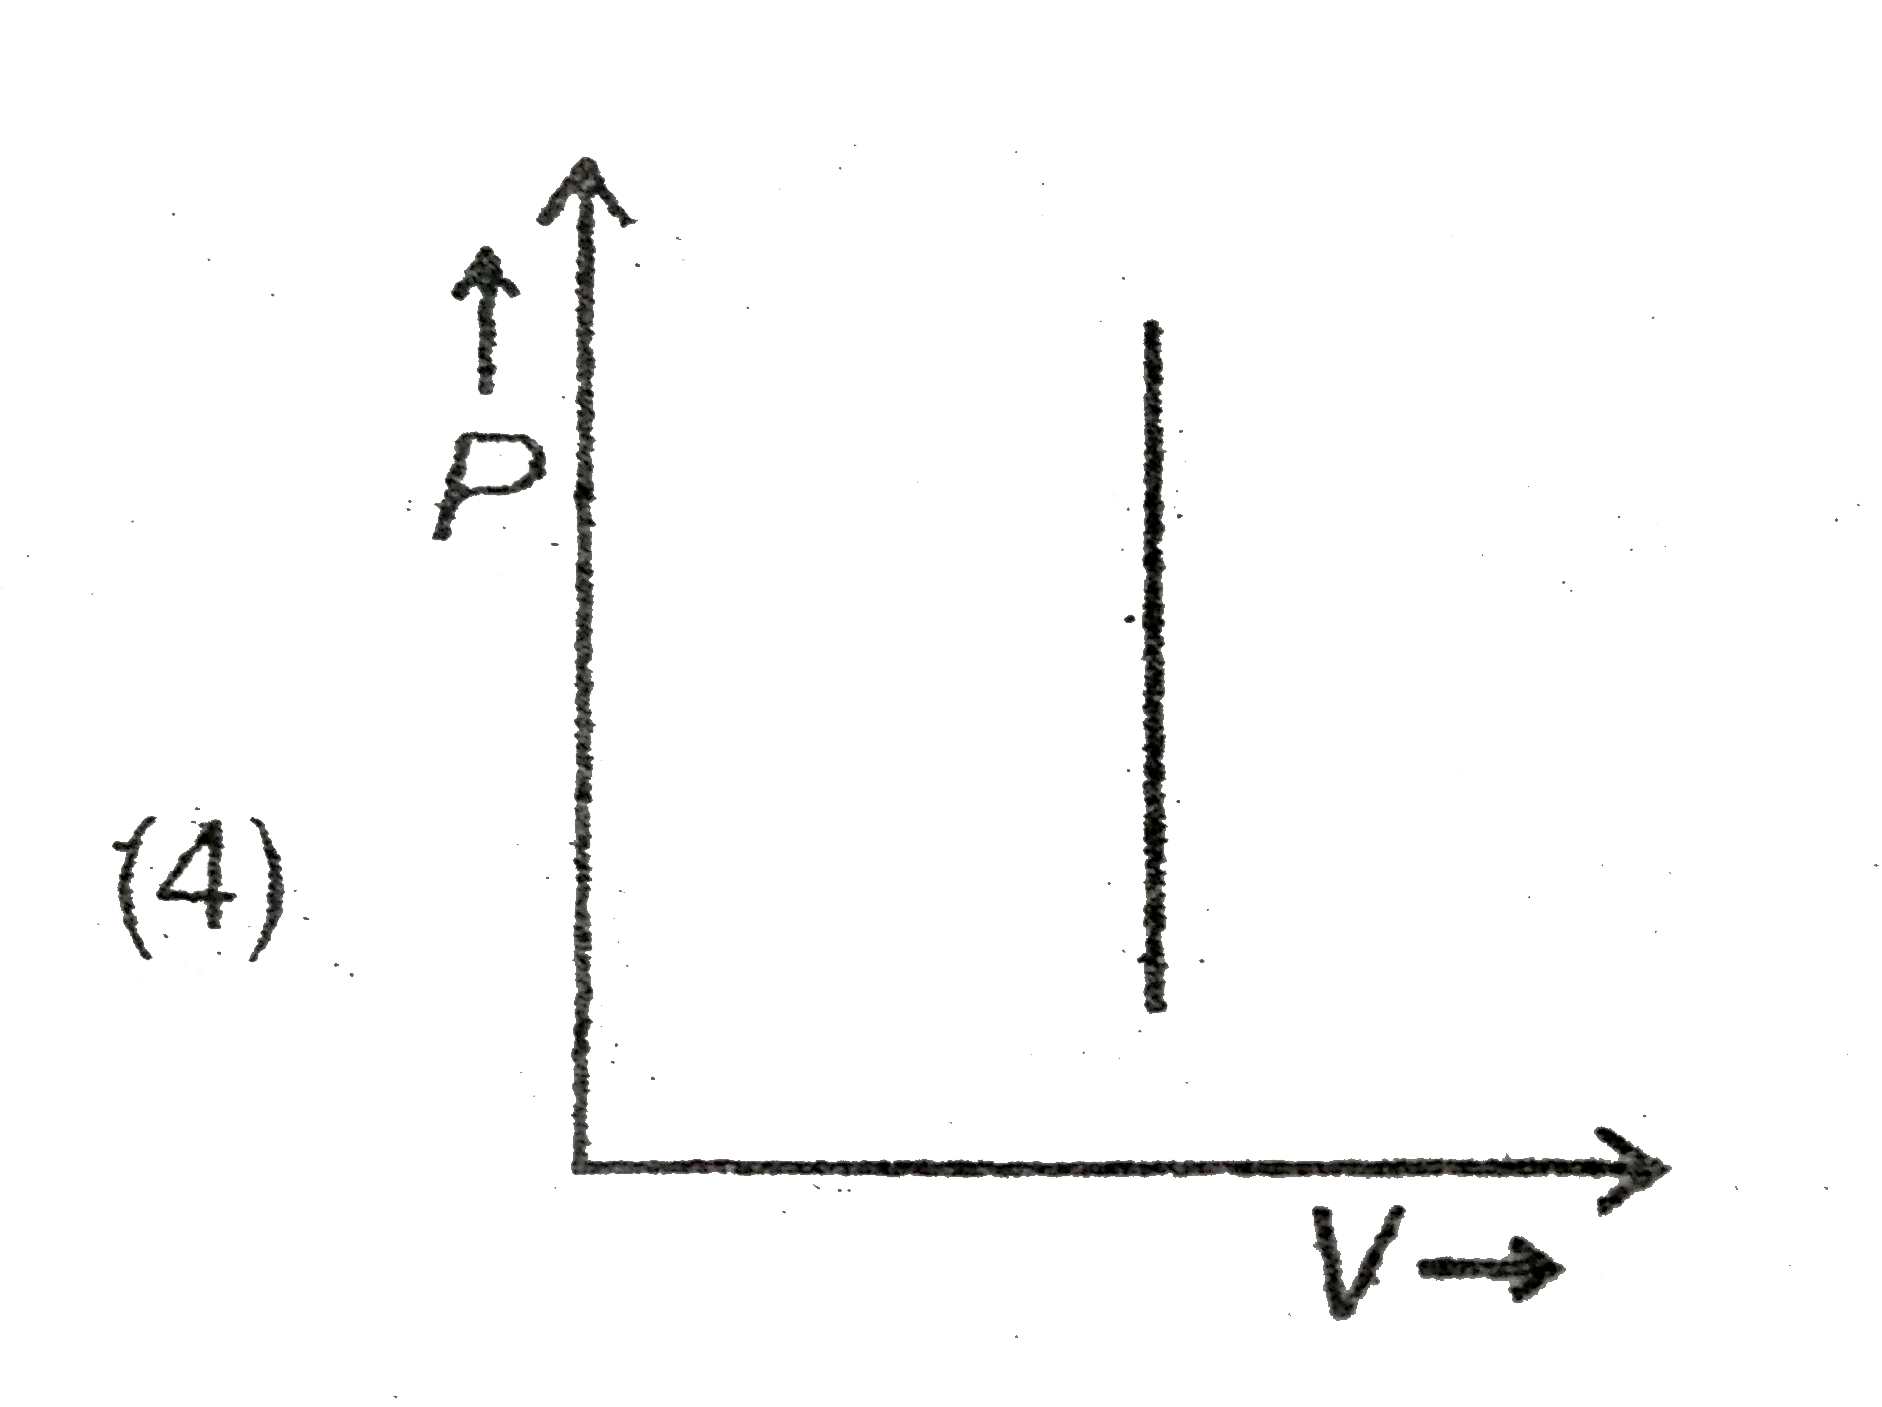
Which of the following P-V diagram represent the graph of isometric process?
A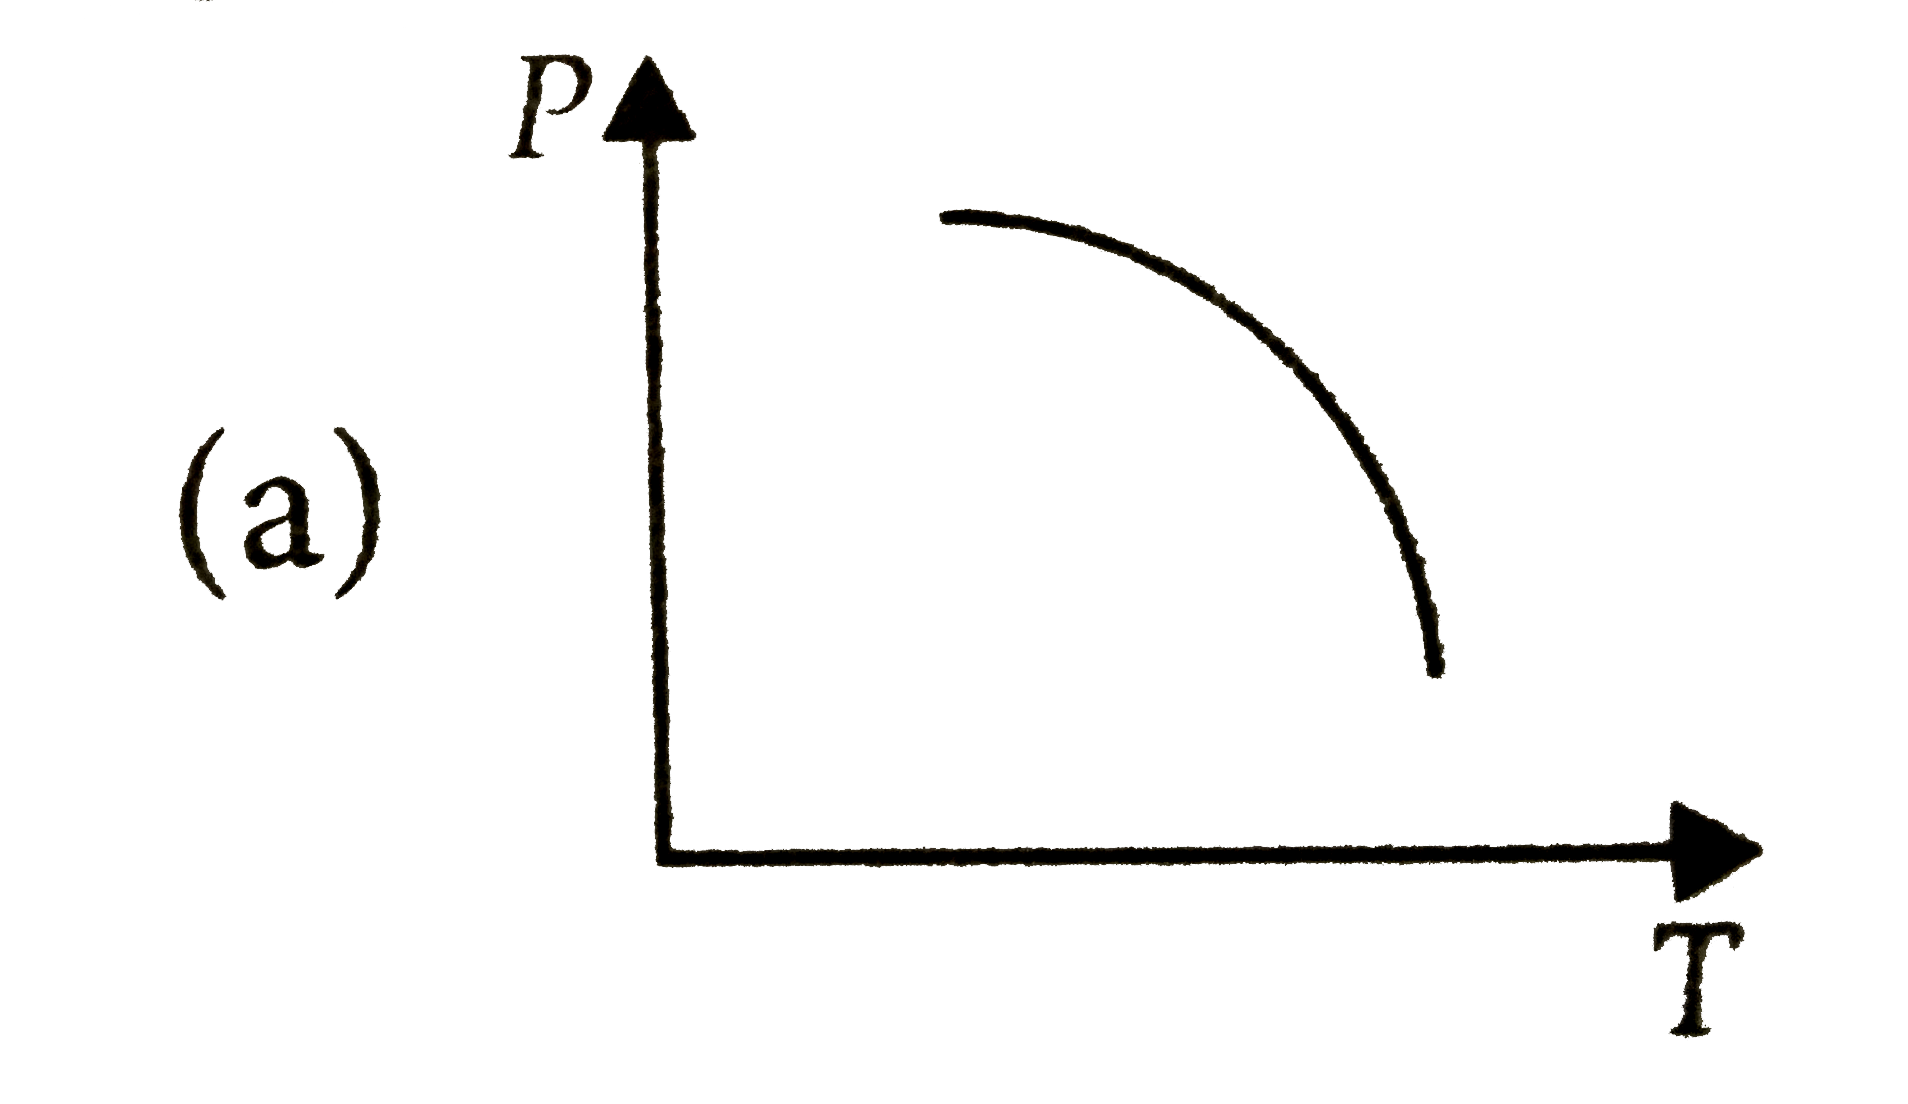 B
B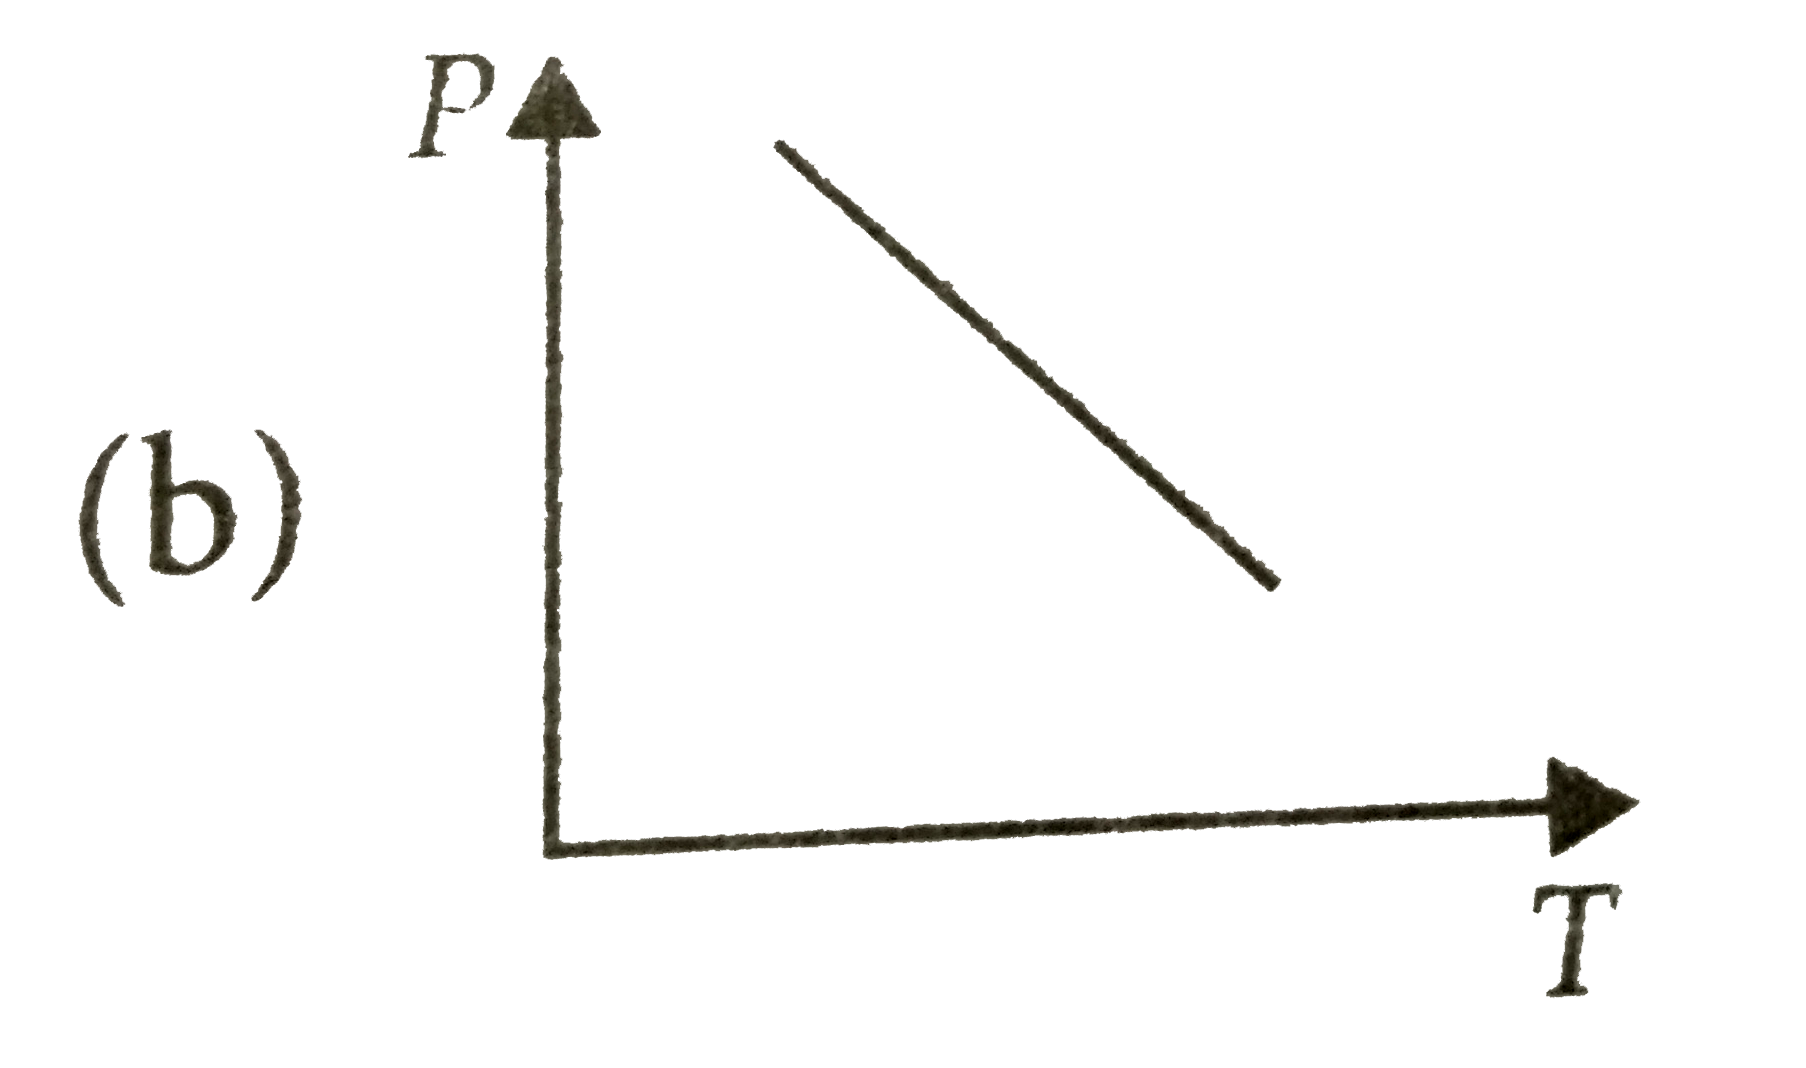 C
C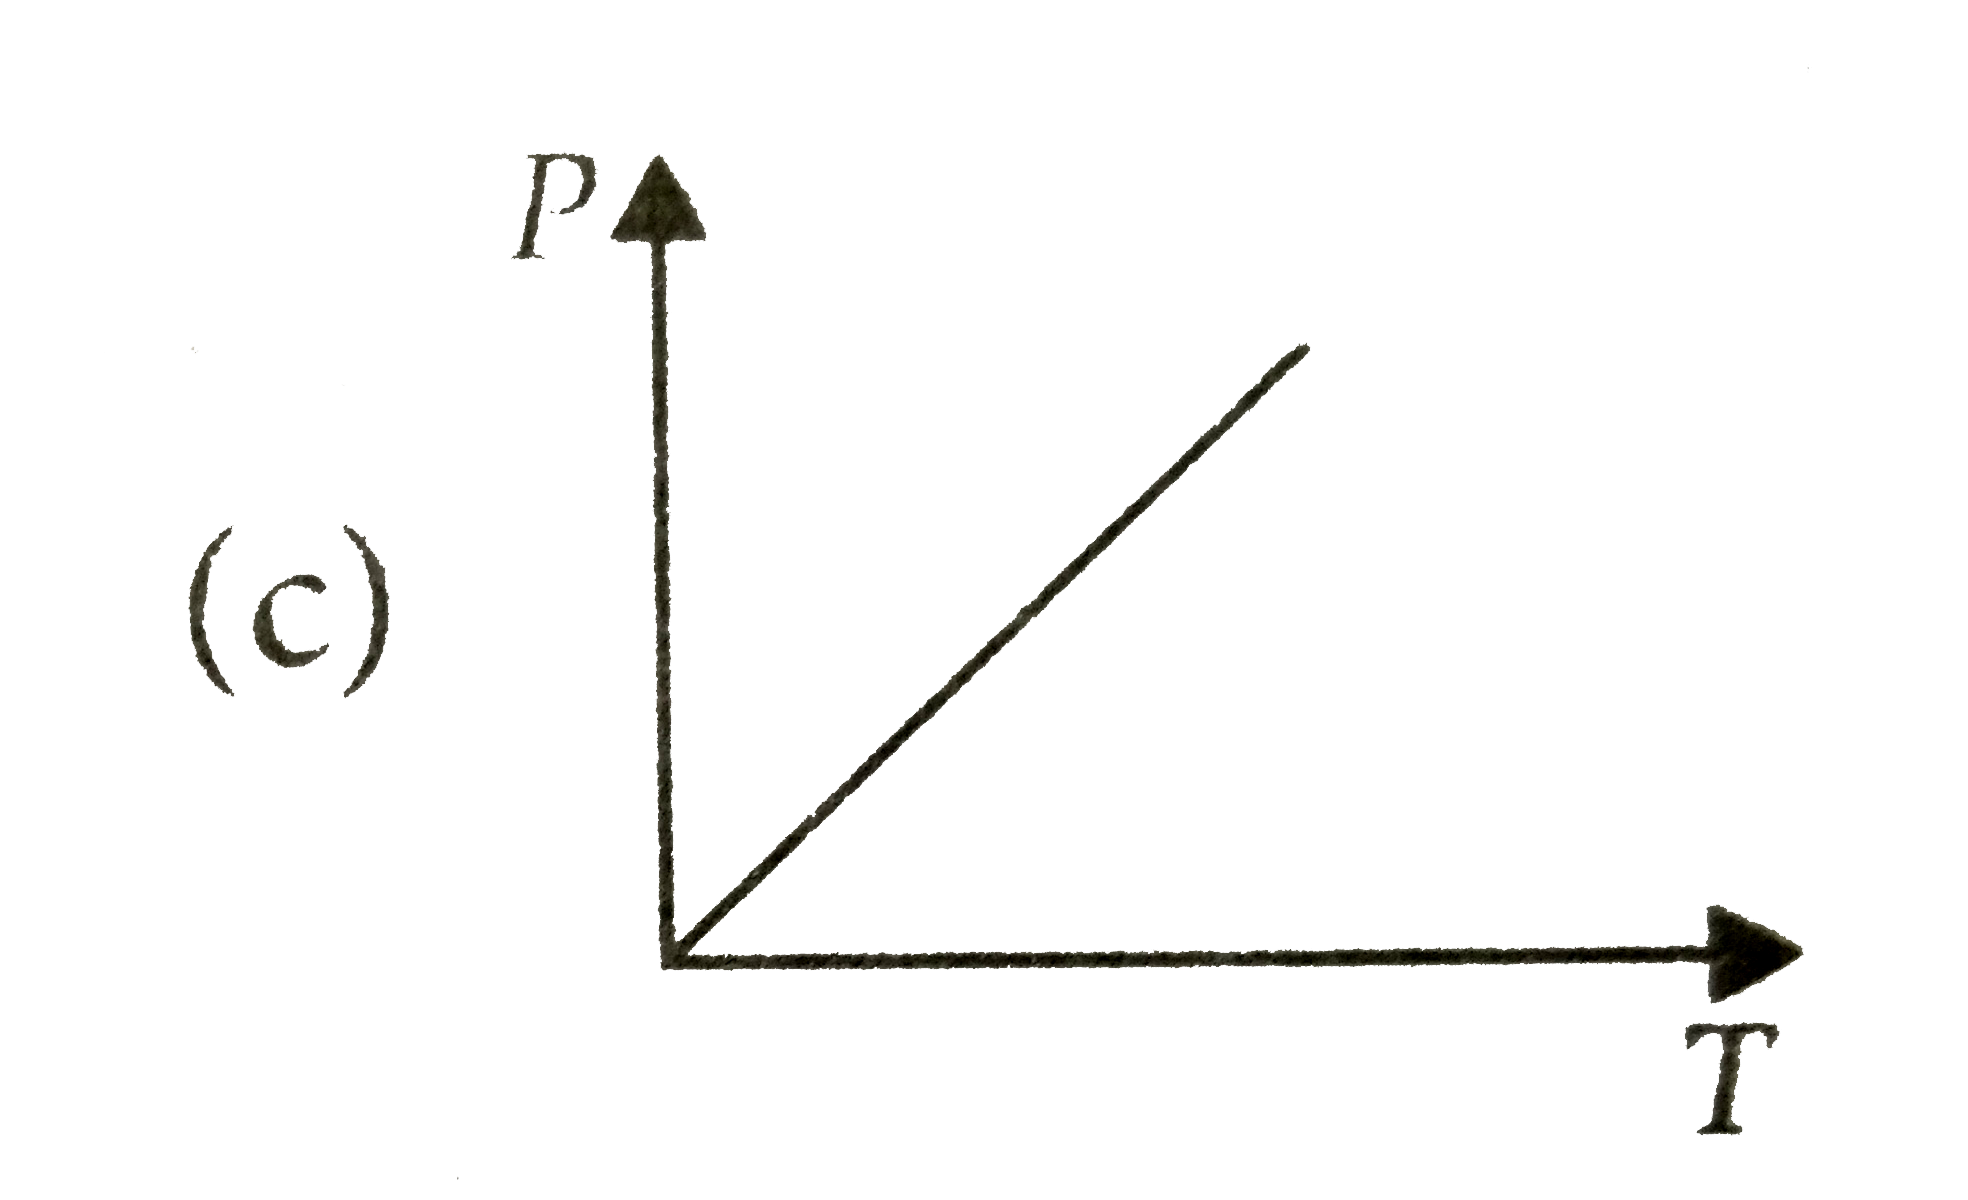 D
D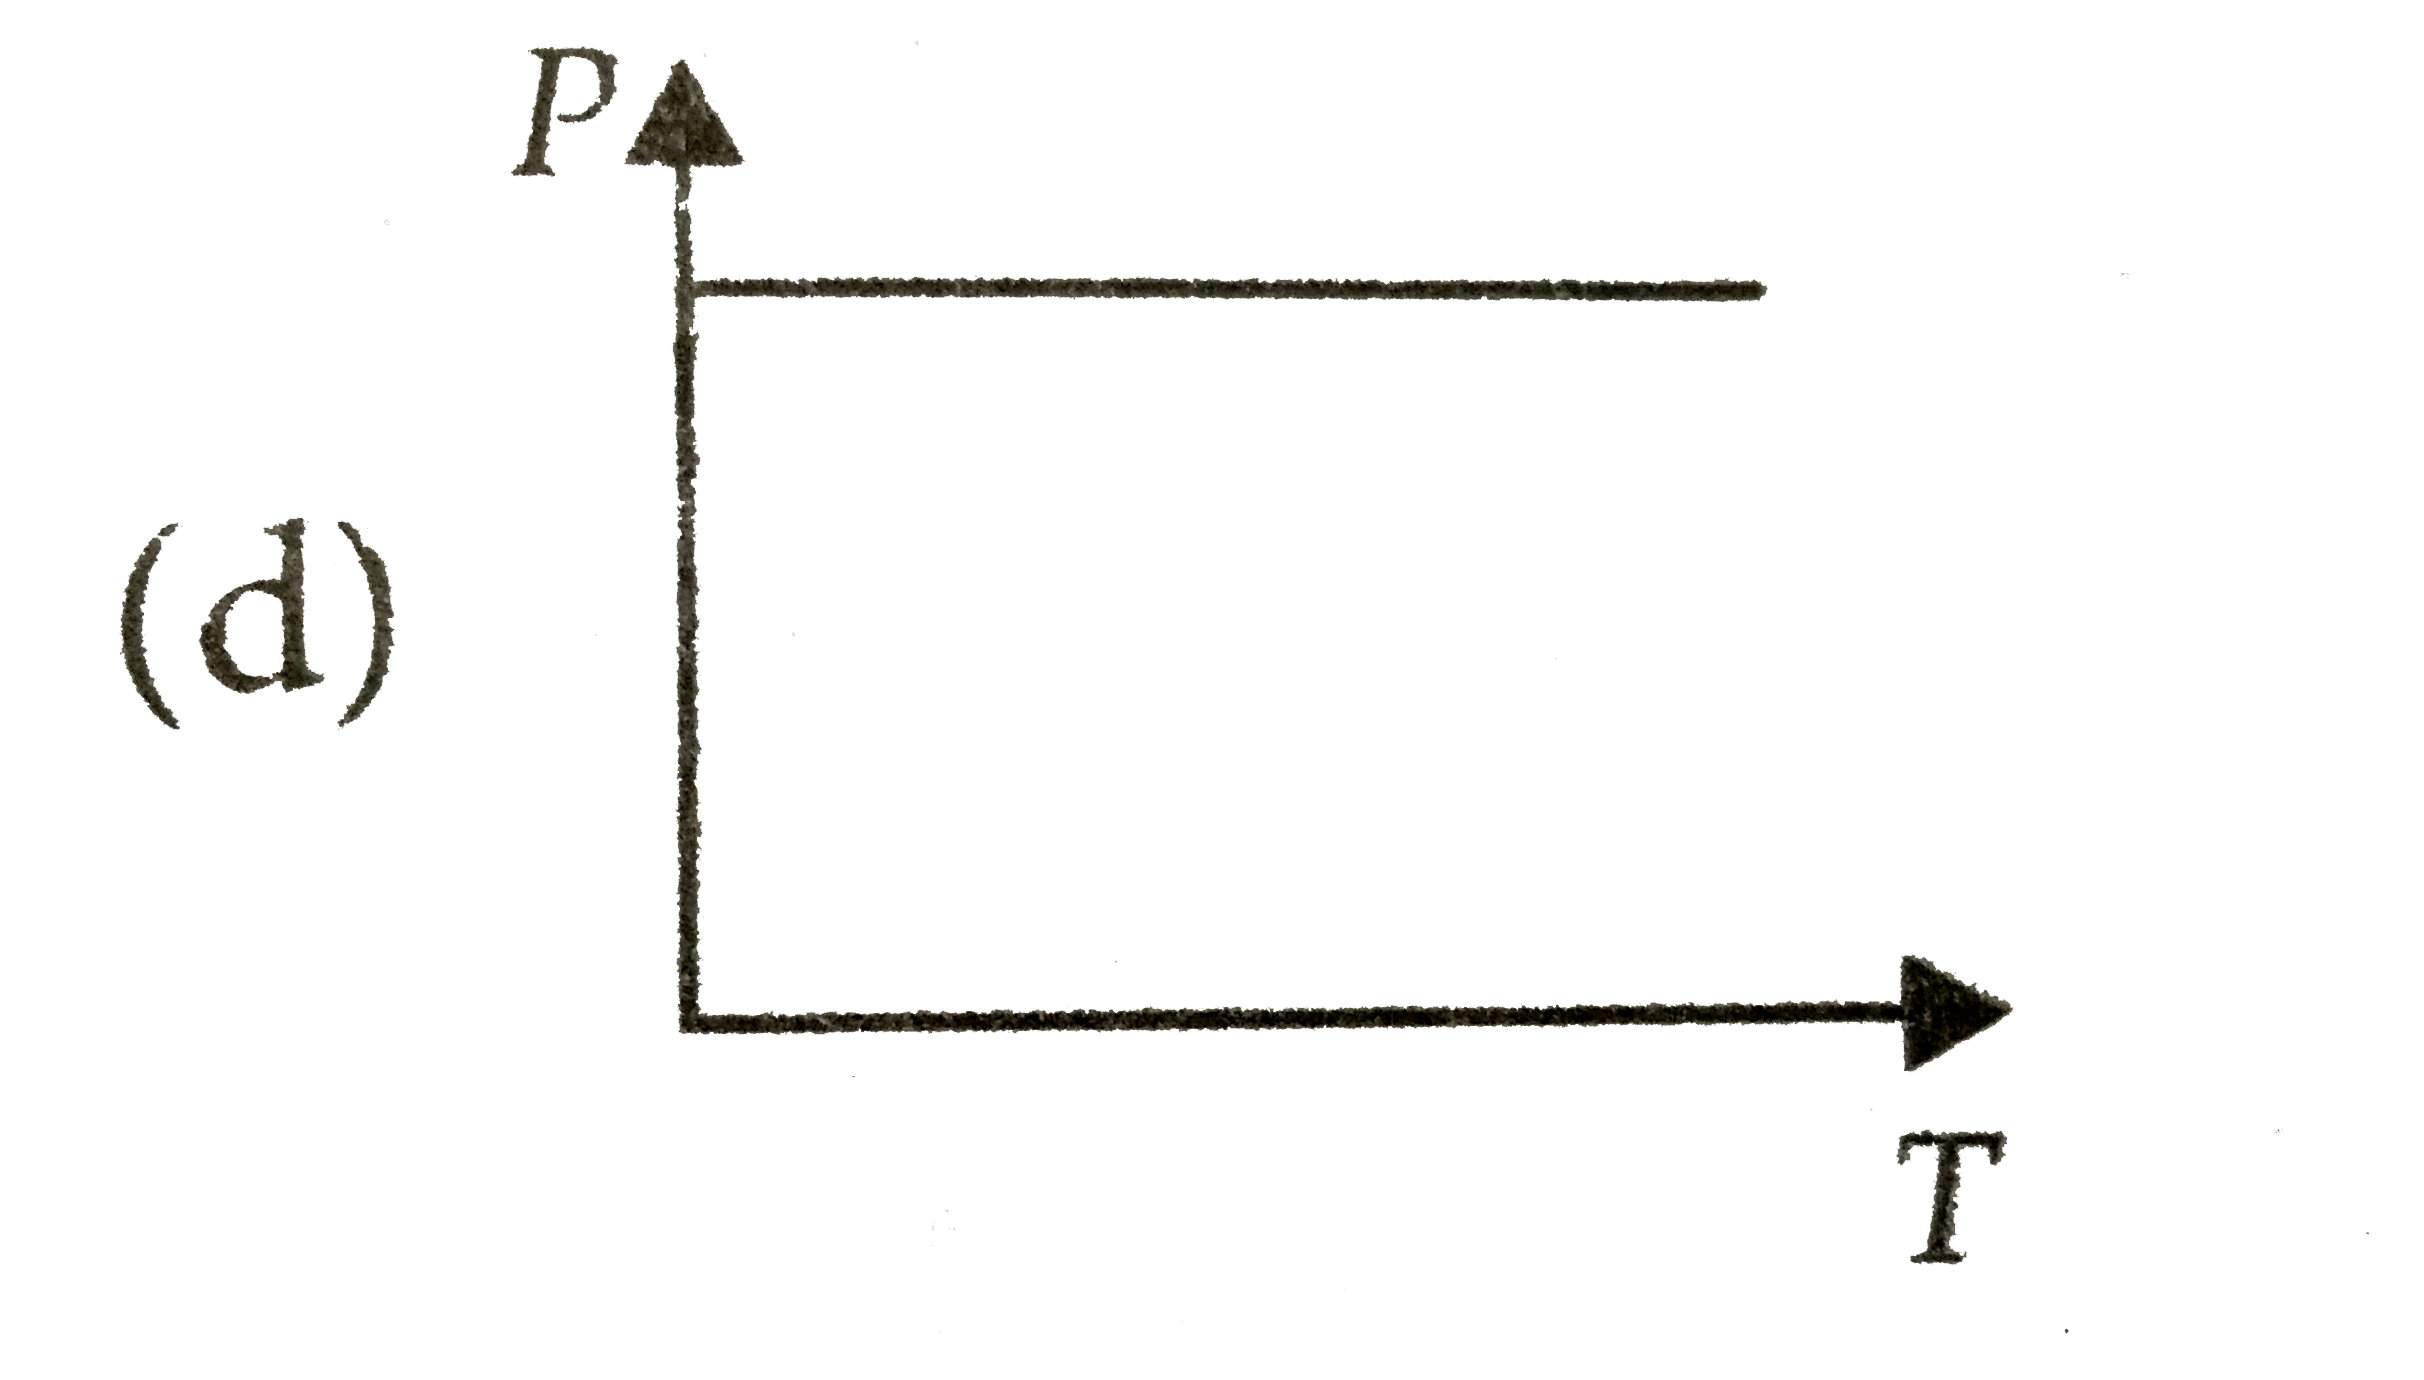
Which of the following Venn diagrams best represents the relationship between the following classes? Accountants, Girls, Internet users
View SolutionWhich of the following Venn diagrams best represents the relationship between the following classes ? Lady Constables, Uncles, Mothers
View SolutionWhich of the following Venn diagrams best represents the relationship between the following classes?
Crickets, Players, Human beings
View SolutionWhich of the following Venn diagrams best represents the relationship between the following classes ? Lady Constables, Uncles, Mothers
View SolutionWhich of the following Venn diagram best represents the relationship between the following classes?
Income tax payers, Employees, Males
View Solution

