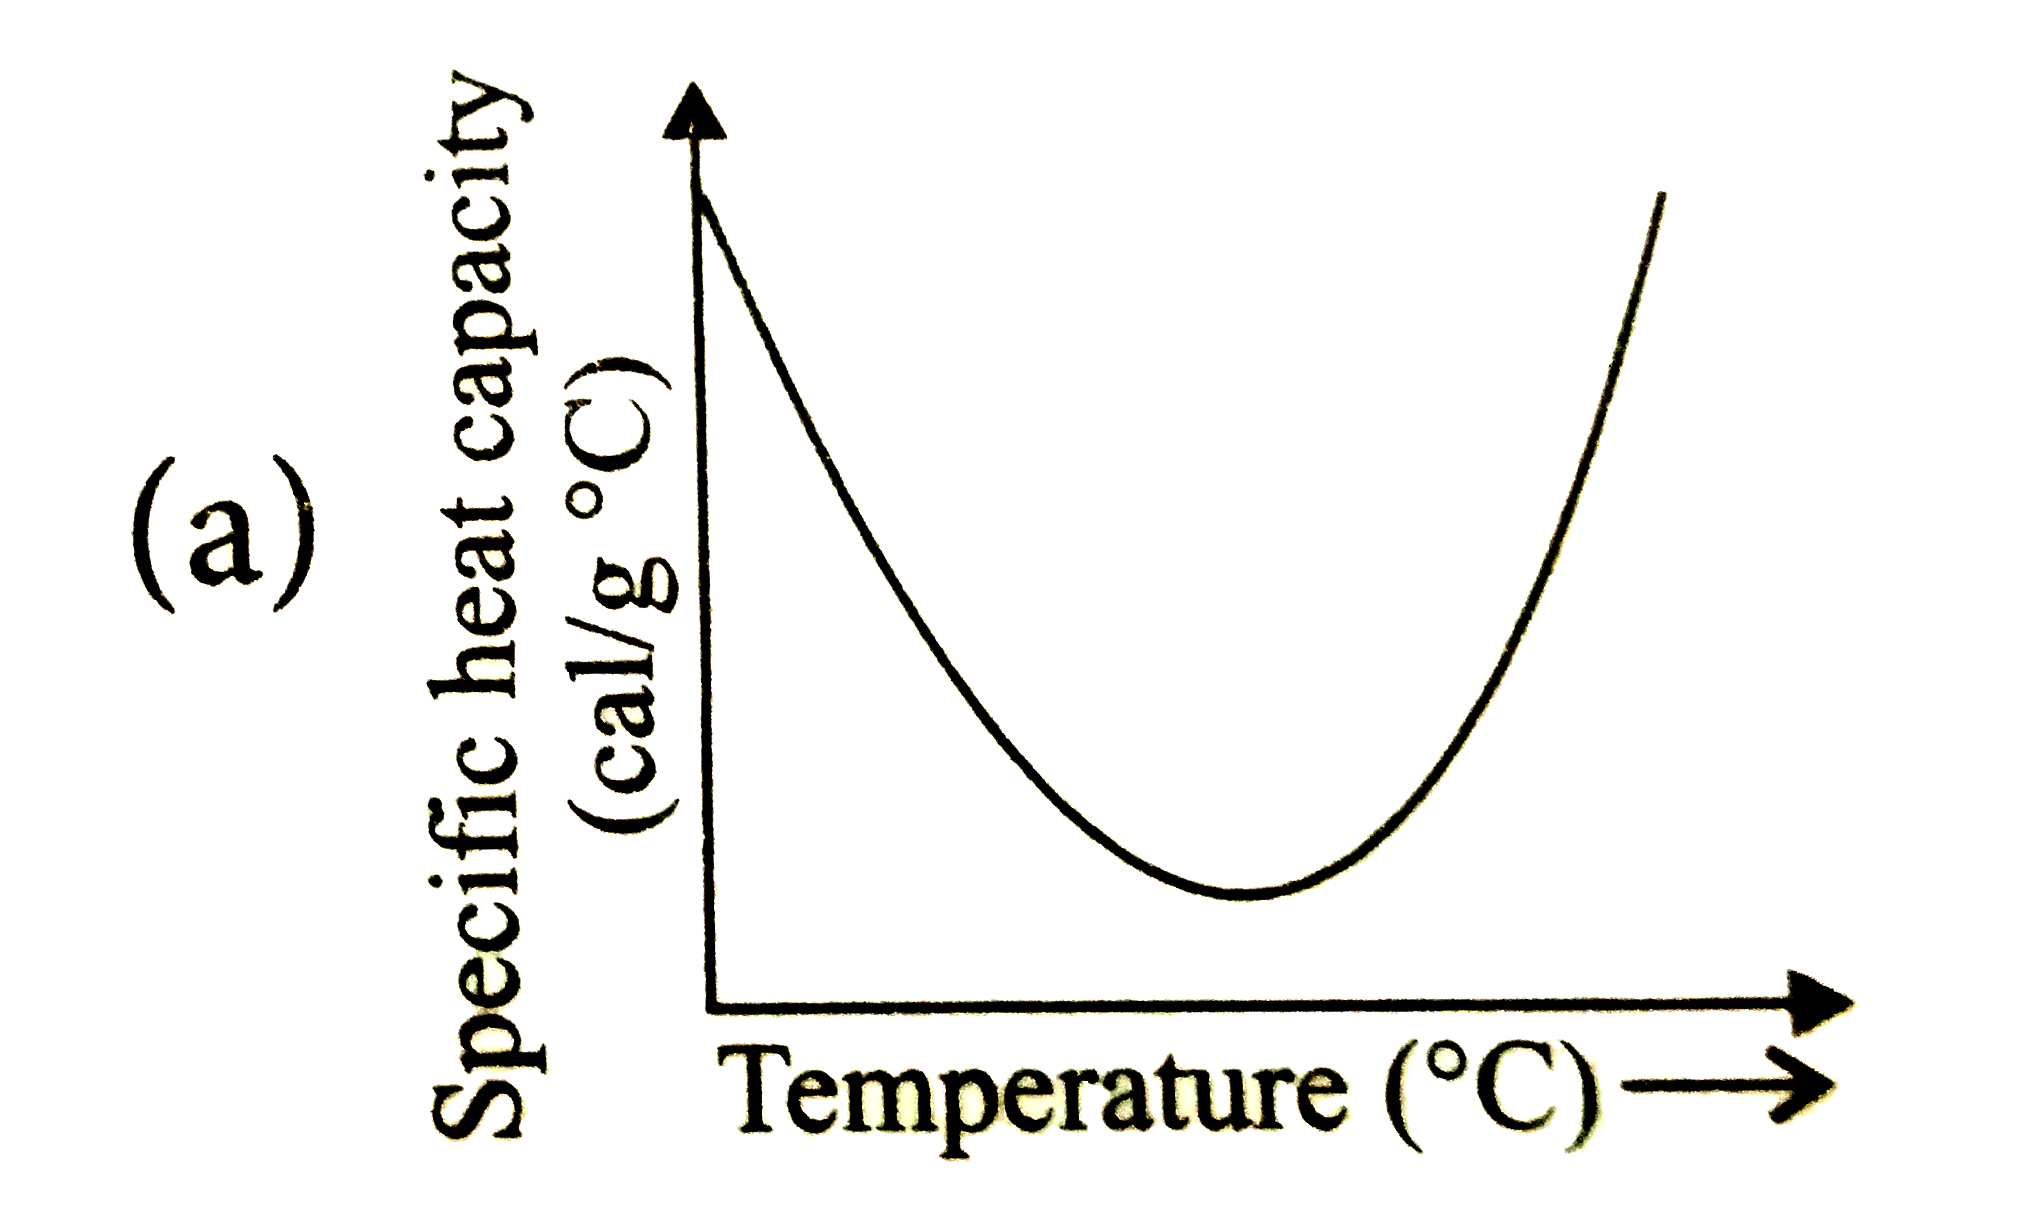
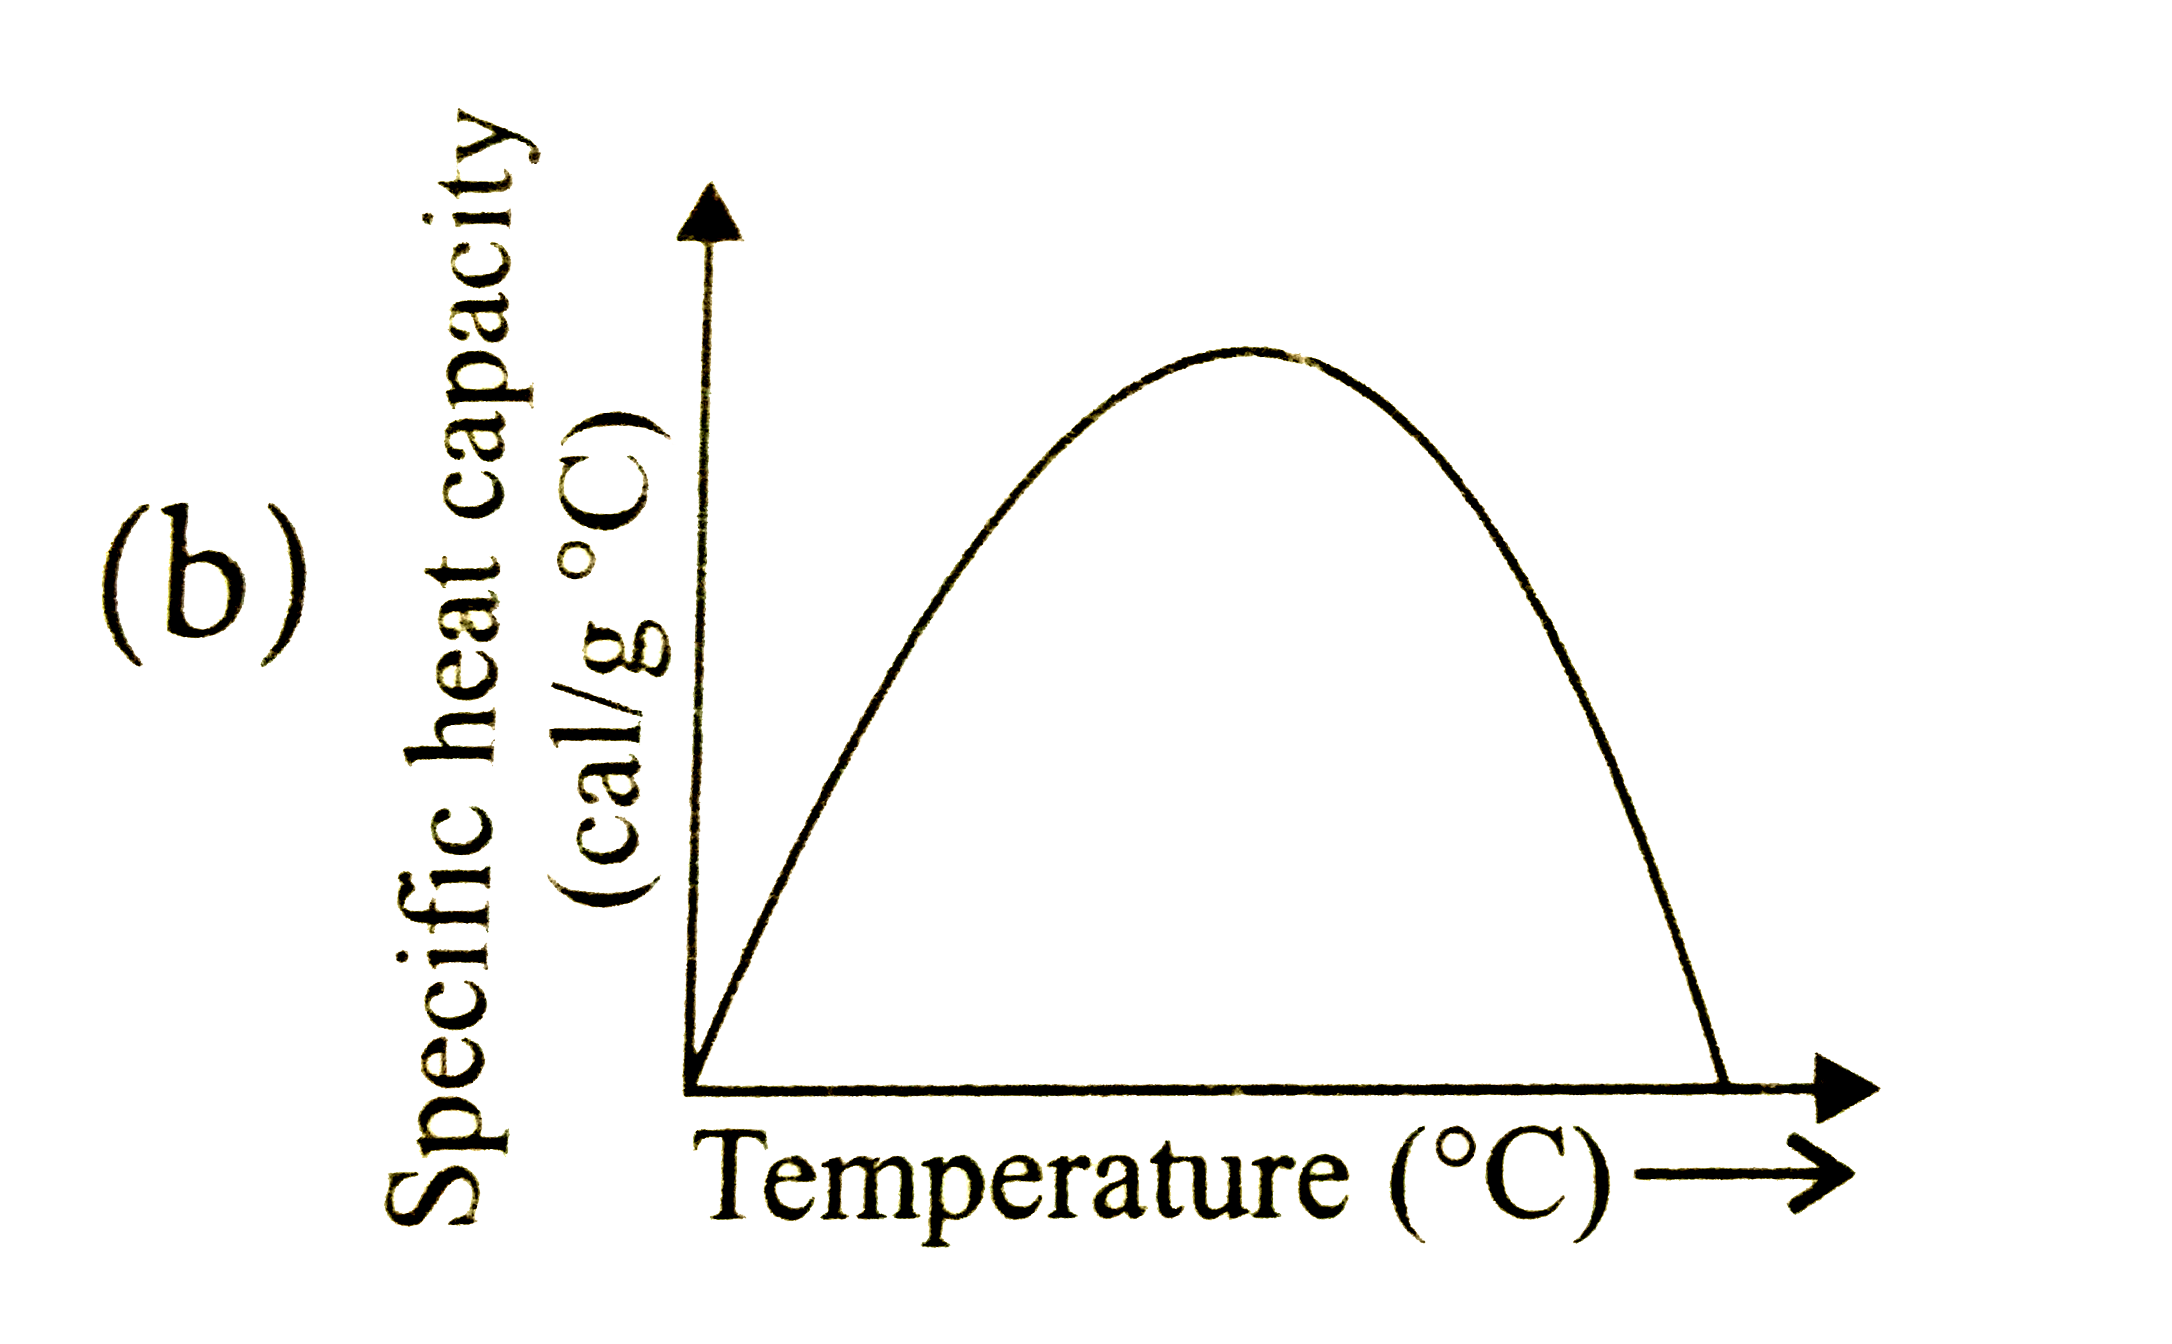
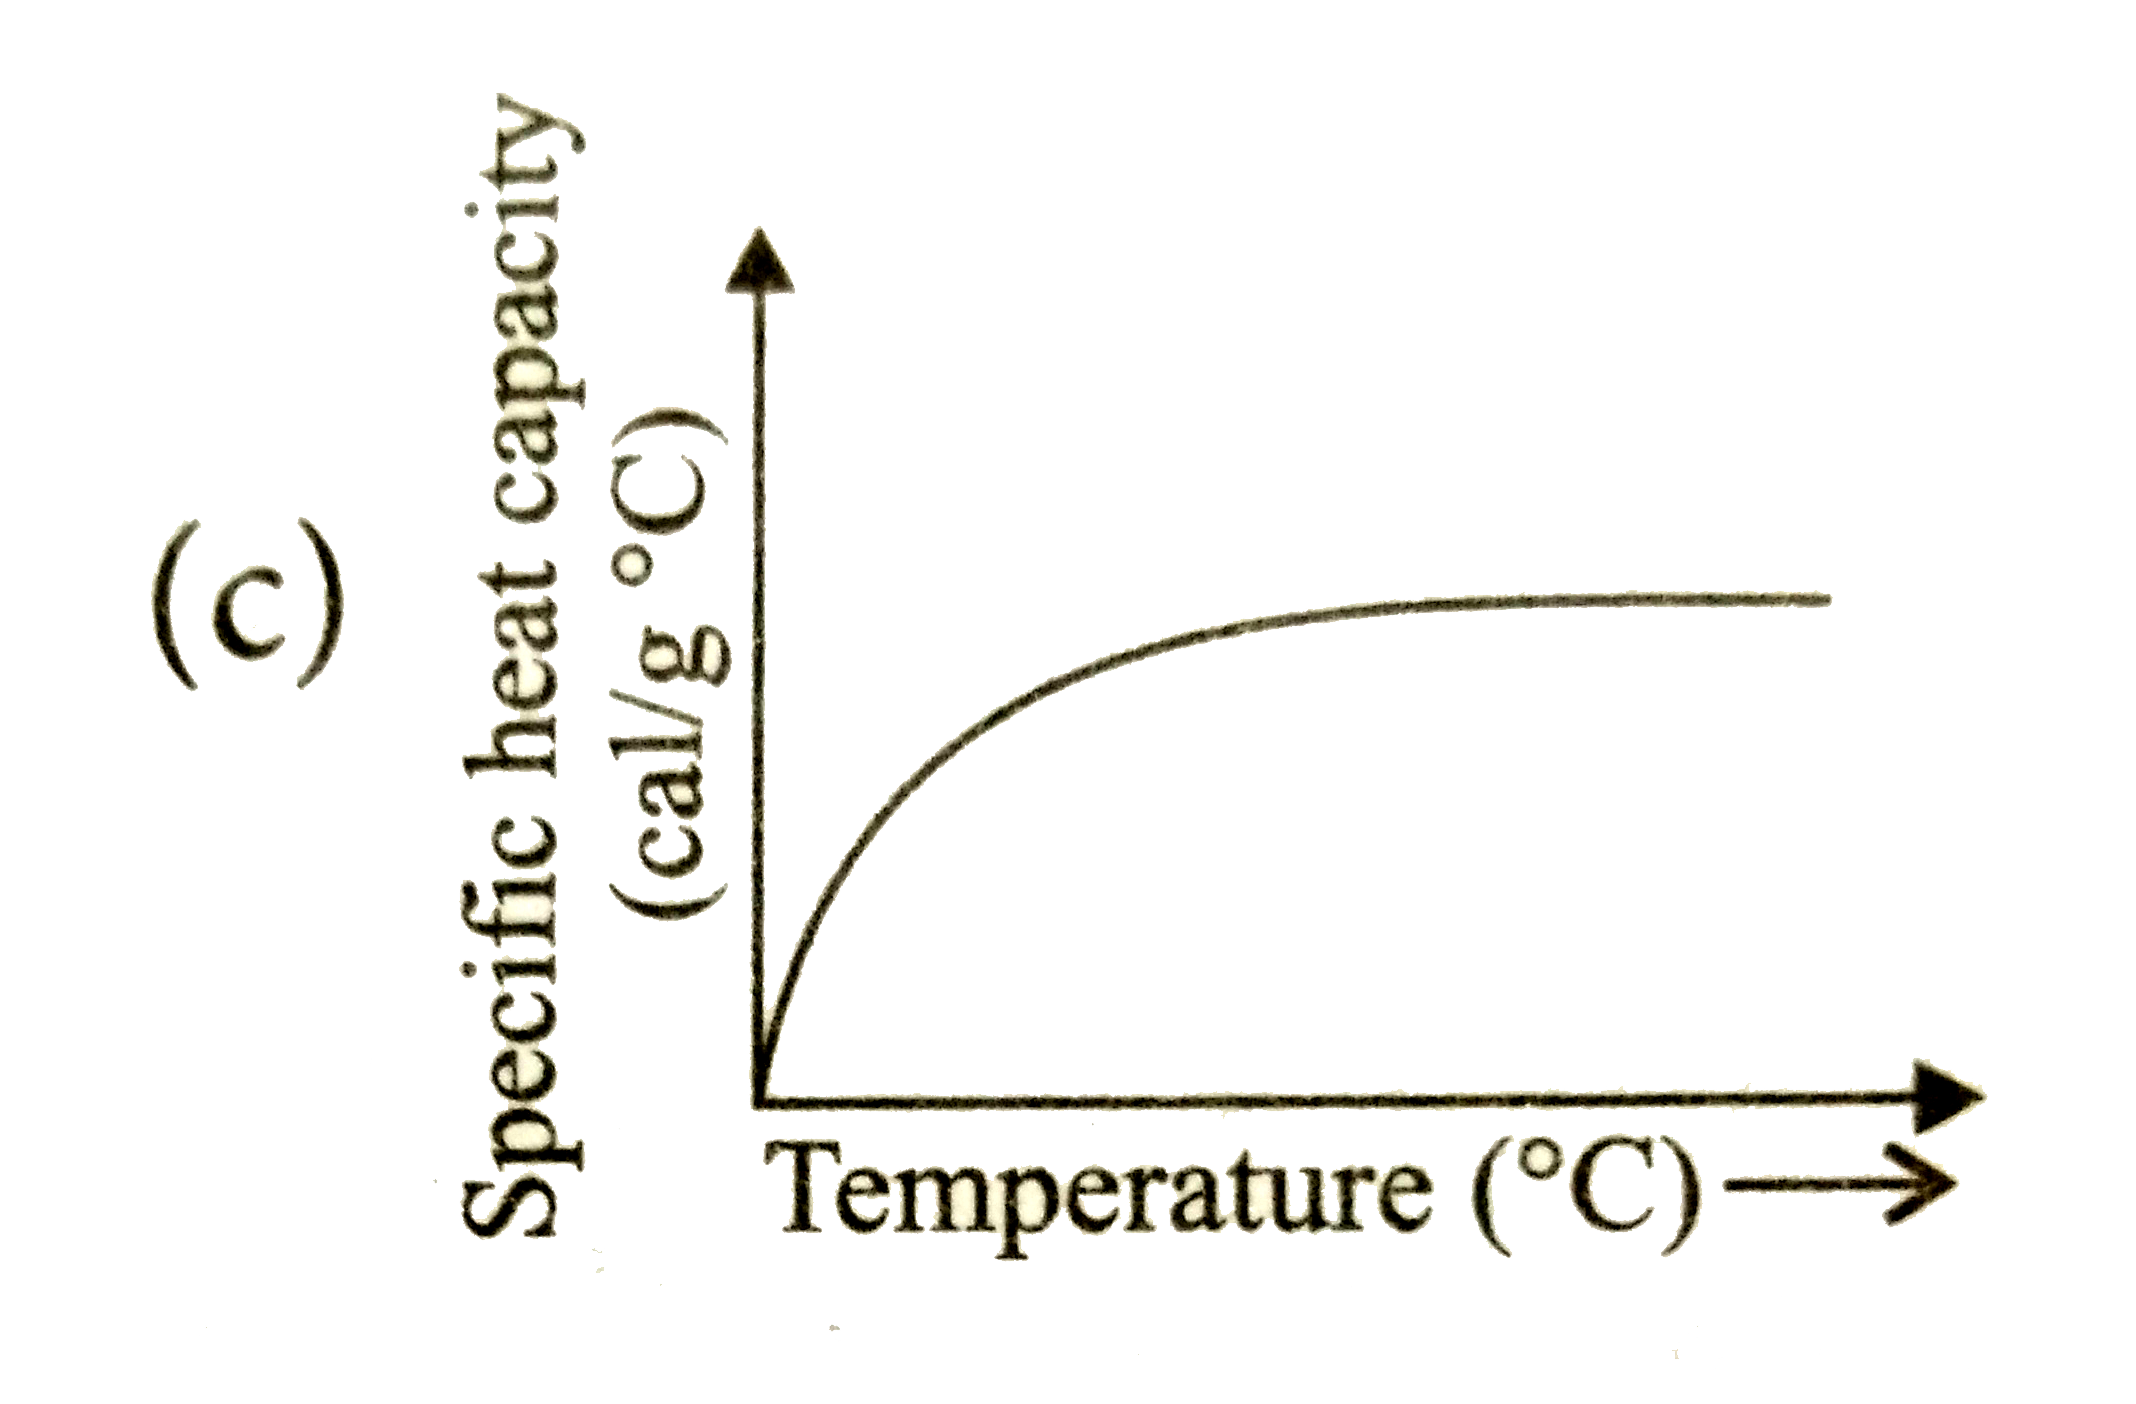
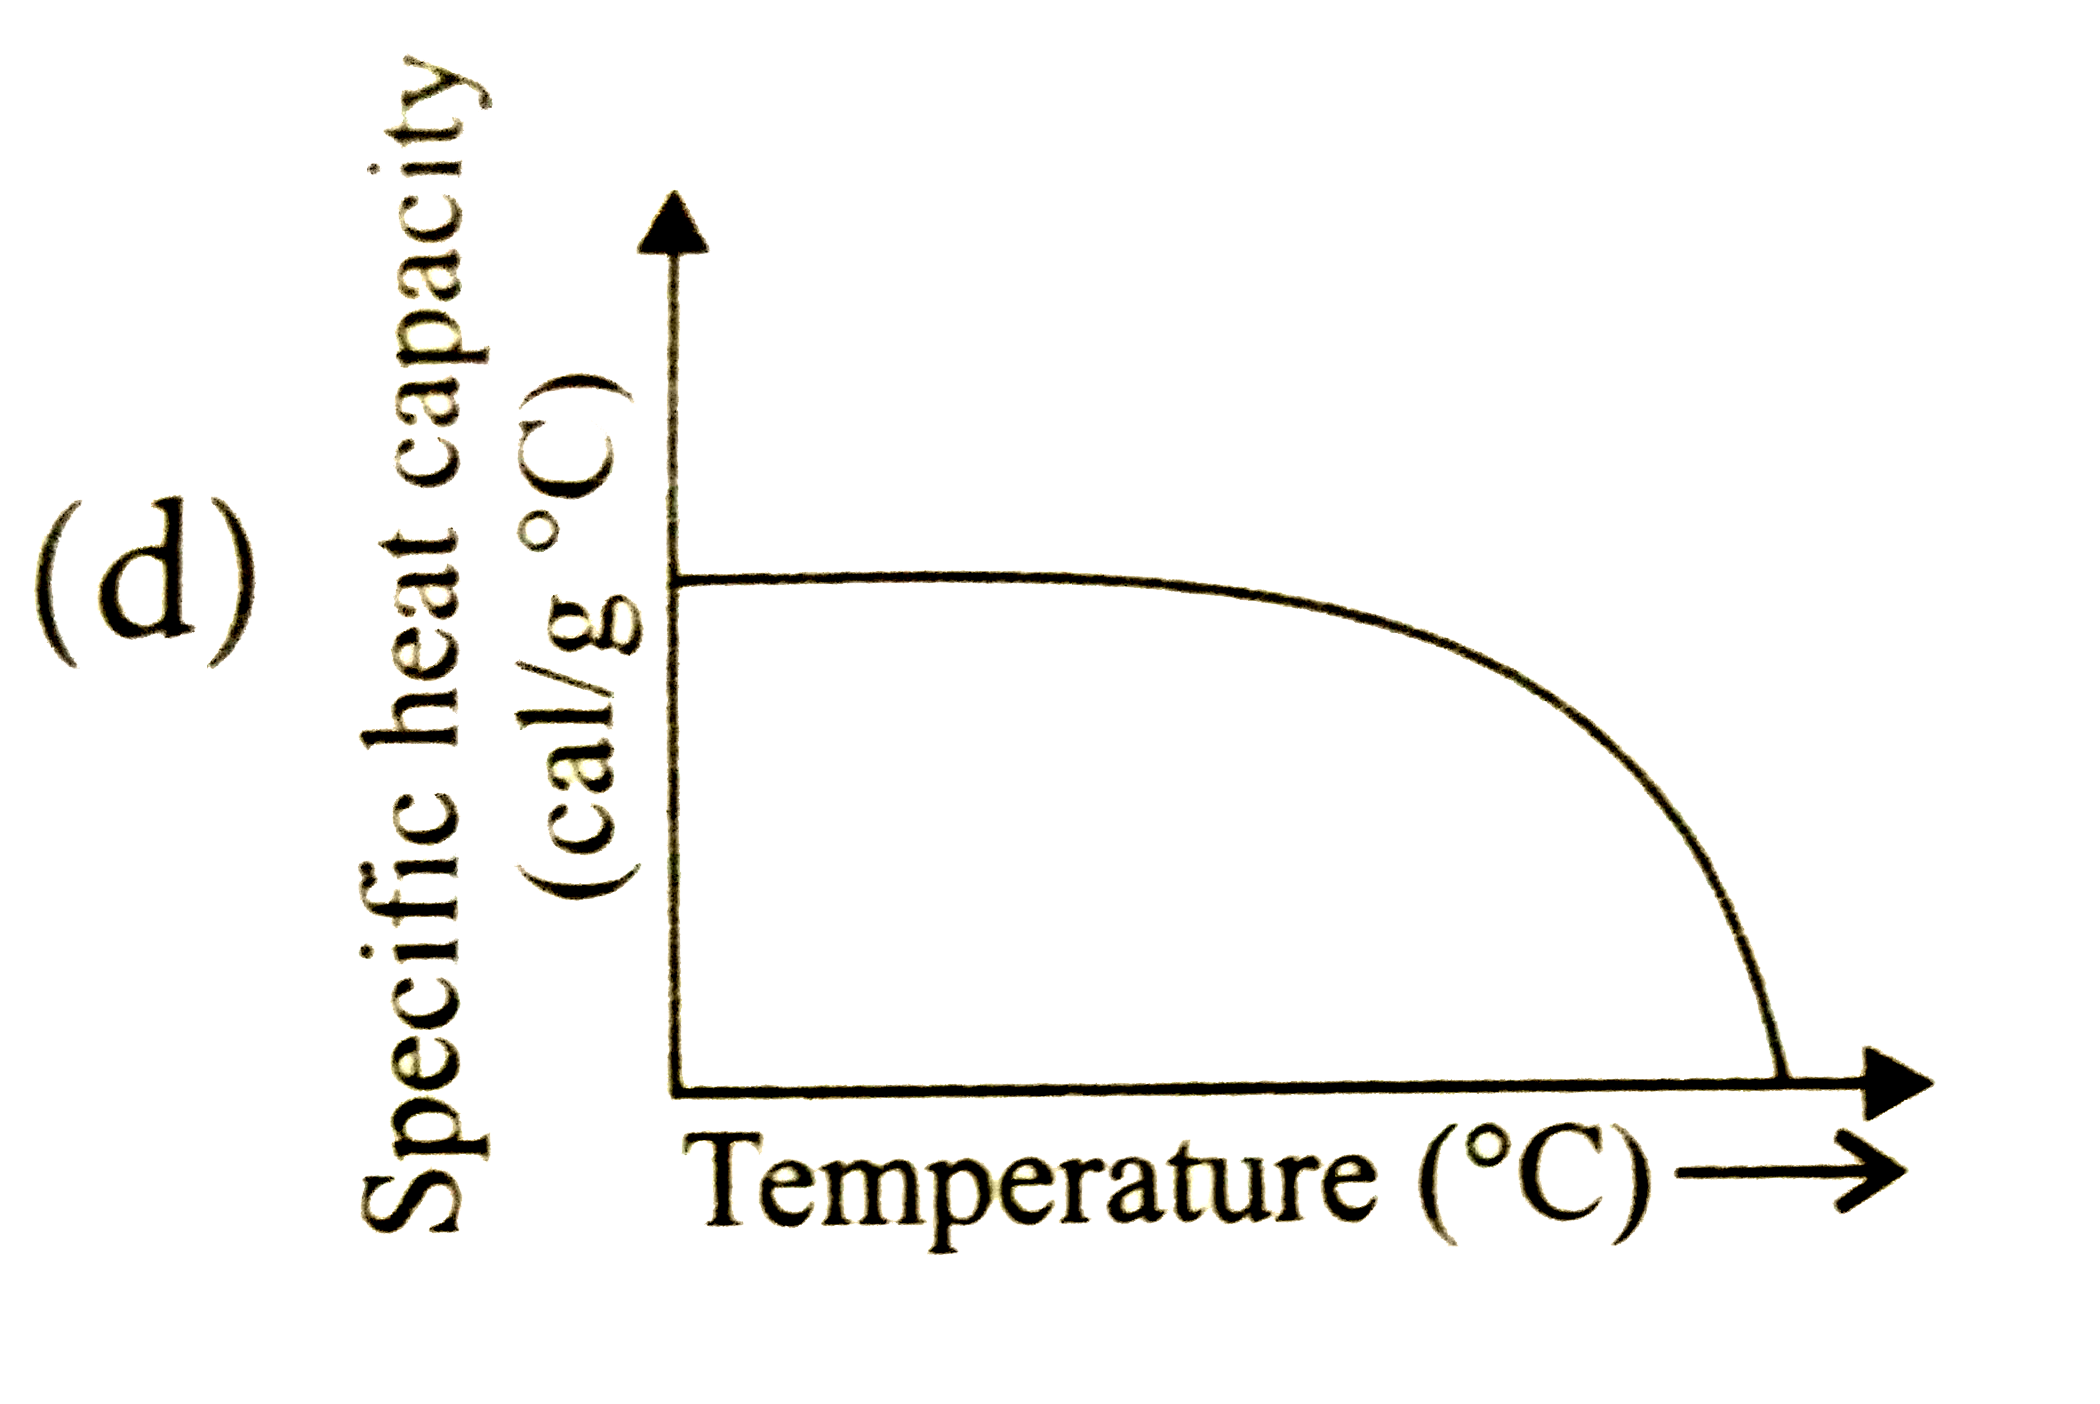
Which one of the following graphs represents variation of specific heat capacity of water with temperature?


The correct Answer is:A
To determine which graph represents the variation of specific heat capacity of water with temperature, we can follow these steps:
1. Understanding Specific Heat Capacity:
- Specific heat capacity (C) is defined as the amount of heat required to change the temperature of a unit mass of a substance by one degree Celsius. For water, this varies with temperature.
2. Behavior of Water with Temperature:
- Water exhibits unique properties as it is heated. Specifically, its density changes with temperature, peaking at 4 degrees Celsius. Below this temperature, water becomes denser as it cools, and above it, water becomes less dense as it warms.
3. Relationship Between Specific Heat Capacity and Temperature:
- As the temperature of water increases, the specific heat capacity does not remain constant. It tends to decrease initially as the temperature rises from 0°C to 4°C and then starts to increase again as the temperature rises further.
4. Analyzing the Graphs:
- We need to look for a graph that shows a decrease in specific heat capacity as the temperature increases from 0°C to 4°C, followed by an increase in specific heat capacity as the temperature continues to rise beyond 4°C.
5. Identifying the Correct Graph:
- Among the options provided, the graph that first shows a decrease in specific heat capacity and then an increase as the temperature rises is the correct representation of the variation of specific heat capacity of water with temperature.
6. Conclusion:
- Based on the analysis, the correct graph is the one that shows specific heat capacity decreasing from 0°C to 4°C and then increasing beyond 4°C. This corresponds to option 1.
Final Answer:
- The graph that represents the variation of specific heat capacity of water with temperature is Option 1.
- Specific heat capacity (C) is defined as the amount of heat required to change the temperature of a unit mass of a substance by one degree Celsius. For water, this varies with temperature.
- Water exhibits unique properties as it is heated. Specifically, its density changes with temperature, peaking at 4 degrees Celsius. Below this temperature, water becomes denser as it cools, and above it, water becomes less dense as it warms.
- As the temperature of water increases, the specific heat capacity does not remain constant. It tends to decrease initially as the temperature rises from 0°C to 4°C and then starts to increase again as the temperature rises further.
- We need to look for a graph that shows a decrease in specific heat capacity as the temperature increases from 0°C to 4°C, followed by an increase in specific heat capacity as the temperature continues to rise beyond 4°C.
- Among the options provided, the graph that first shows a decrease in specific heat capacity and then an increase as the temperature rises is the correct representation of the variation of specific heat capacity of water with temperature.
- Based on the analysis, the correct graph is the one that shows specific heat capacity decreasing from 0°C to 4°C and then increasing beyond 4°C. This corresponds to option 1.
- The graph that represents the variation of specific heat capacity of water with temperature is Option 1.
Topper's Solved these Questions
- THERMODYNAMICSBOOK - NCERT FINGERTIPSCHAPTER - THERMODYNAMICSEXERCISE - Thermodynamic State Variables
2 Videos
- THERMODYNAMICSBOOK - NCERT FINGERTIPSCHAPTER - THERMODYNAMICSEXERCISE - Thermodynamic Process
52 Videos
- THERMODYNAMICSBOOK - NCERT FINGERTIPSCHAPTER - THERMODYNAMICSEXERCISE - First Law Of Thermodynamics
5 Videos
- THERMAL PROPERTIES OF MATTERBOOK - NCERT FINGERTIPSCHAPTER - THERMAL PROPERTIES OF MATTEREXERCISE - Assertion And Reason
10 Videos
- UNITS AND MEASUREMENTSBOOK - NCERT FINGERTIPSCHAPTER - UNITS AND MEASUREMENTSEXERCISE - Assertion And Reason
15 Videos
Similar Questions
Knowledge Check
Specific heat capacity of water is
A2.09Jg−1K−1B1JK−1C4.18Jg−1K−1D1.74Jg−1K−1Specific heat capacity of water is
A42 J/KGCB42 J/KGCC420J/KGCD4200J/KGCThe specific heat capacity of water is
Amore than petrol and keroseneBless than oil and petrolCless than keroseneDless than honey and oil
The specific heat capacity of water is
View SolutionThe specific heat capacity of water is
View SolutionWhich one of the following graphs represents the variation of surface tension of water with temperture for a small range of temperature ?
View SolutionThe specific heat capacity is
View SolutionSpecific heat capacity of water is
View Solution
