Which plot is the adsorption isobar for chemisorption where x is the amount of gas adsorbed on mass m (at constant pressure at temperature T ?
A
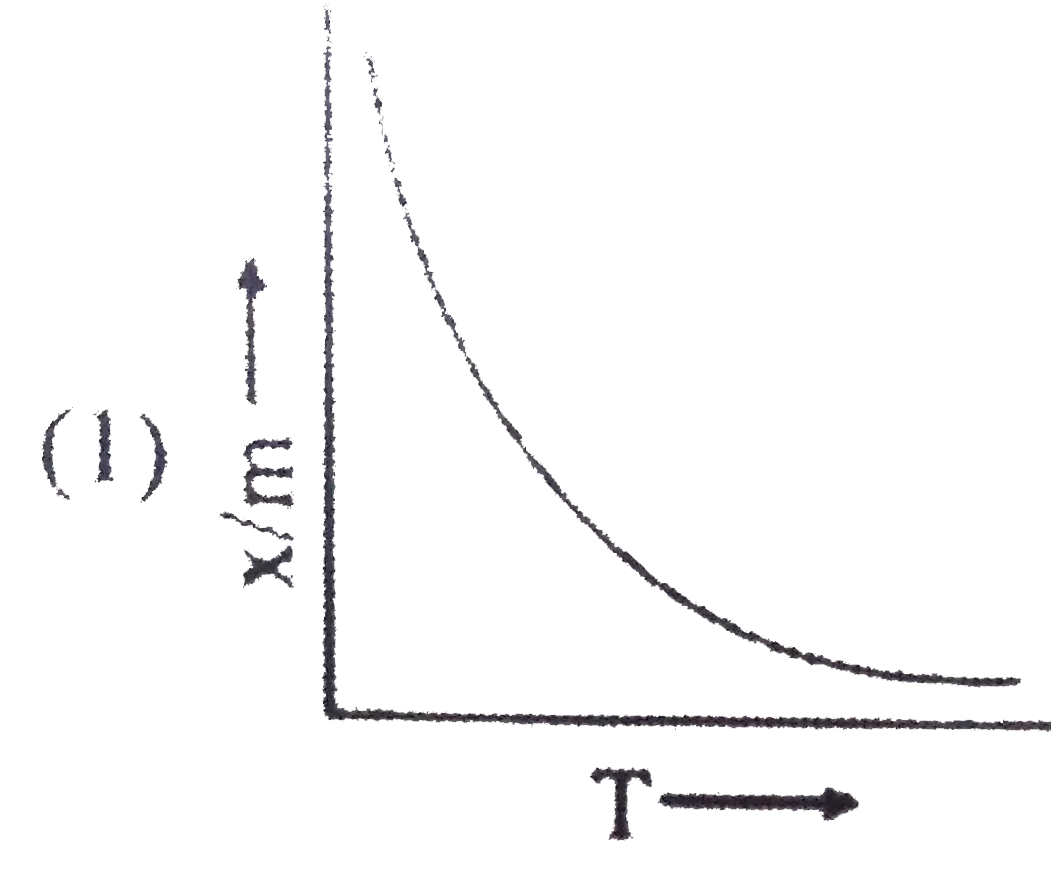
B
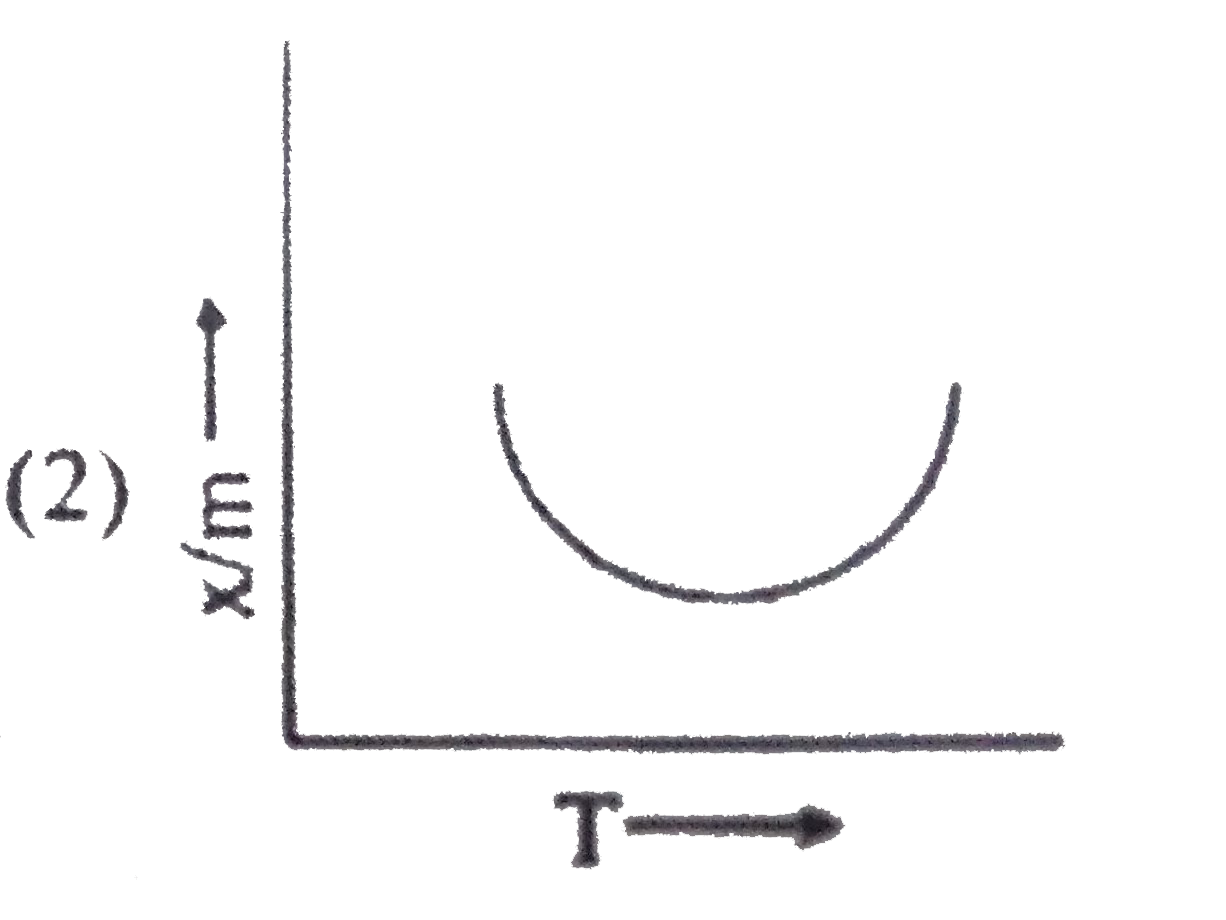
C
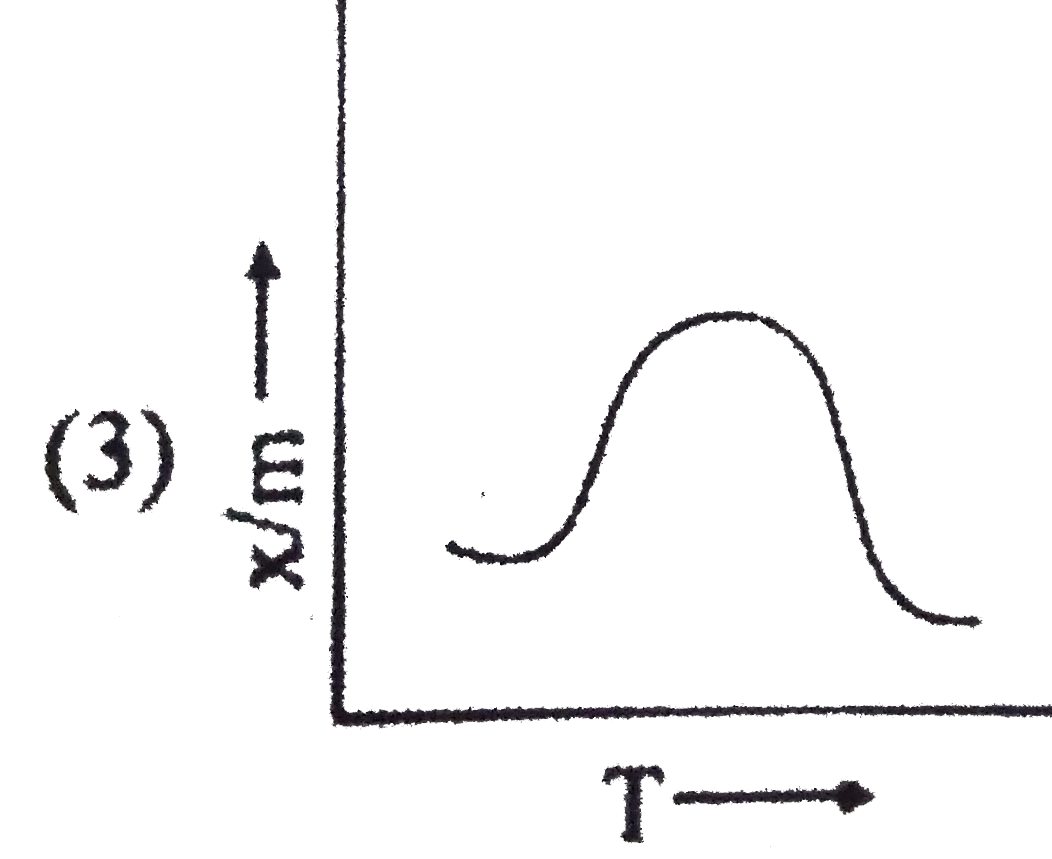
D

Text Solution
The correct Answer is:C
it follows activation energy curvecurve .
|
Updated on:21/07/2023
Topper's Solved these Questions
Similar Questions
Knowledge Check
- Question 1 - Select One
Which of the plots is adsorption isobar for chemisorption?
A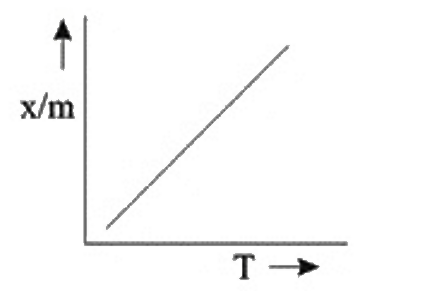 B
B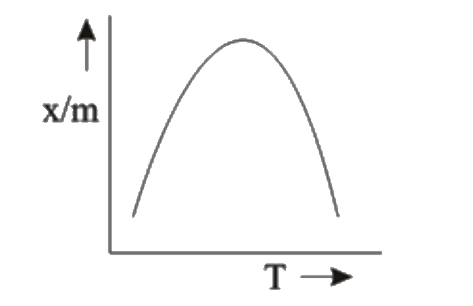 C
C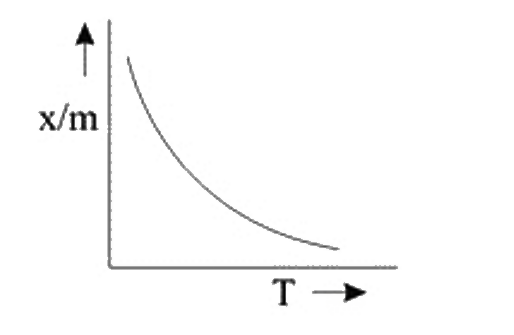 D
D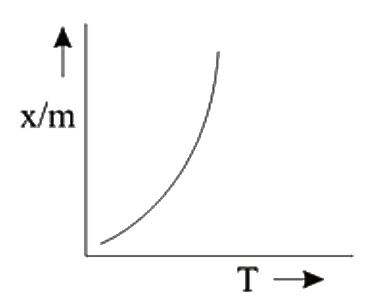
- Question 2 - Select One or More
Which is not adsorption isobar for chemisorption?
A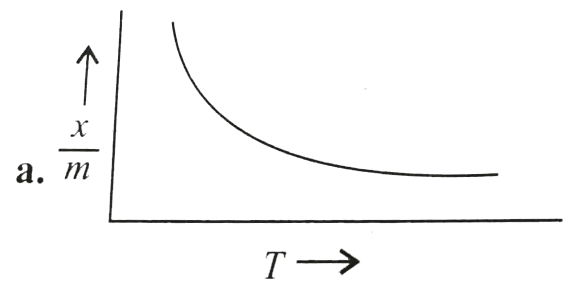 B
B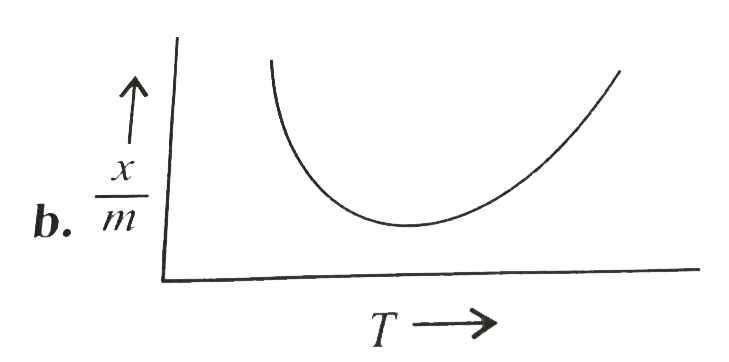 C
C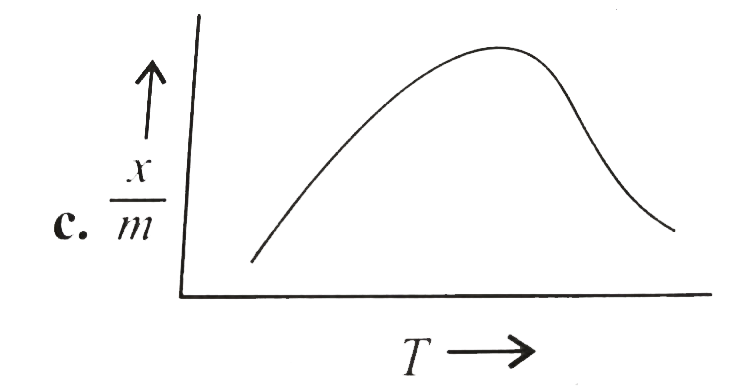 D
D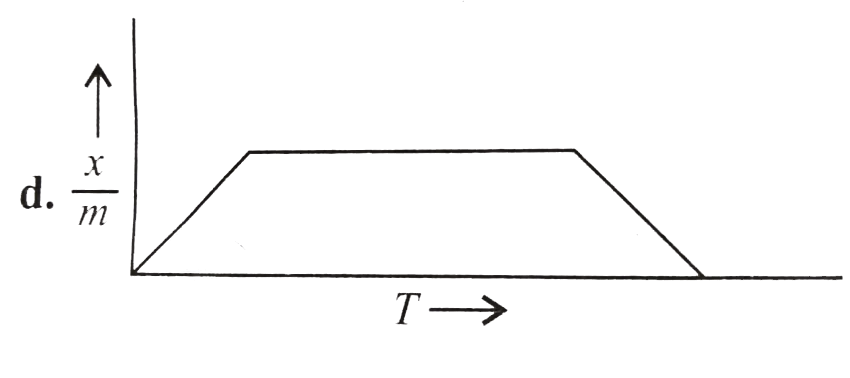
- Question 3 - Select One
Which plot is the adsorptoion isobar for chemisorption where m (at constant pressure ) at temperature T ?
A (##DPB_PHY_CHM_IX_C13_E01_018_O01.png" width="30%">.B (##DPB_PHY_CHM_IX_C13_E01_018_O02.png" width="30%">.C (##DPB_PHY_CHM_IX_C13_E01_018_O03.png" width="30%">.D (##DPB_PHY_CHM_IX_C13_E01_018_O04.png" width="30%">
According to Langmuir adsorption isotherm the amount of gas adsorbed at very high pressure
View SolutionAccording to Langmuir adsorption isotherm, the amount of gas adsorbed at very high pressure:
View SolutionAccording to Langmuir adsorption isotherm, the amount of gas adosobed at very high pressure
View SolutionAccording to langmuir adsorption isotherm amount of gas adsorbed at very low pressure
View SolutionAccording of Langmuir adsorption isotherm amount of gas adsorbed at very low pressure
View Solution

