Write note on graphical representation of wave
(i) Space variation graph
(ii) Space variation graph :
Space variation graph:

When the time is kept fixed, the change in displacement with respect to x is plotted. Let us consider a sinusoidal graph, y=A sin (kx) as shown in the figure, where k is a constant. Since the wavelength λ denotes the distance between any two points in the same state of motion, the displacement y is the same at both the ends.
y=xandy=x+λ, i.e.,
y=Asin(kx)=Asin(k(x+λ))
=Asin(kx+kλ) ......(1)
The sine function is a periodic function with period 2π. Hence,
y=Asin(kx+2π)
=Asin(kx) ......(2)
Comparing equation (1) and (2), we get
kx+kλ=kx+2π
This implies
k=2πλradm−1 .......(3)
where k is called wave number. It is measured to find number of wavelengths are present in 2π radians.
The spatial periodicity of the wave is
λ=2πk in m
Then,
At t=0s
y(x,0)=y(x+λ,0)
and
At any time t,
y(x,t)=y(x+λ,t)
(ii) Time variation graph:

By keeping the position fixed, the change in displacement with respect to time is plotted. Consider a sinusoidal graph, y=Asin(ωt) as shown in the fingur, where ω is angular frequency of the wave that measures how quickly wave oscillates in time or number of cycles per second. The temporal periodicity or time period is
T=2πω⇒ω=2πT
The angular frequency is related to frequency f by the expression ω=2πf, where the frequency f is defined as the number of oscillations made by the medium particle per second. Since time period is inverse of frequency, we get,
T=1f in seconds
This is the time taken by a medium particle to complete one oscillation. Hence, we can define the speed of a wave (wave speed, v) as the distance traversed by the wave per second.
v=λT=λf in ms−1
that is the same relation as we obtained in equation velocity, λf=v
Topper's Solved these Questions
- BOOK - PREMIERS PUBLISHERSCHAPTER - WAVESEXERCISE - OTHER IMPORTANT & QUESTIONS ANSWERS ( NUMERICAL PROBLEMS. )48videos
WAVES
- BOOK - PREMIERS PUBLISHERSCHAPTER - WAVESEXERCISE - OTHER IMPORTANT & QUESTIONS ANSWERS ( SHORT ANSWER QUESTIONS. )34videos
WAVES
- BOOK - PREMIERS PUBLISHERSCHAPTER - QUESTION PAPER MARCH 2019EXERCISE - Part- IV23videos
QUESTION PAPER MARCH 2019
- BOOK - PREMIERS PUBLISHERSCHAPTER - WORK, ENERGY AND POWER EXERCISE - VERY SHORT ANSWER QUESTIONS34videos
WORK, ENERGY AND POWER
Similar Questions
Knowledge Check
- Question 1 - Select One
The expected graphical representation of the variation of angle of deviation 'δ' with angle of incidence 'i' in a prism is :
A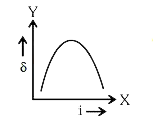 B
B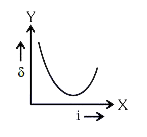 C
C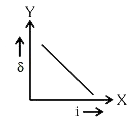 D
D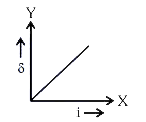
- Question 2 - Select One
The graph shown the variation with times t of the velocity v of an object . Which one of the following graphs best represents the variation of acceleration a of the object with time t?
 A
A B
B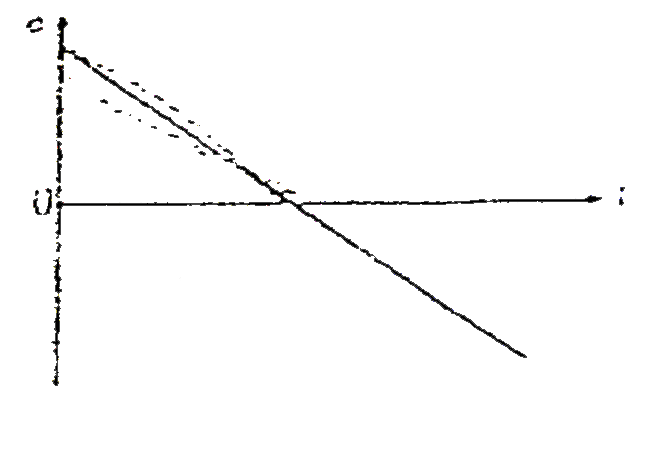 C
C D
D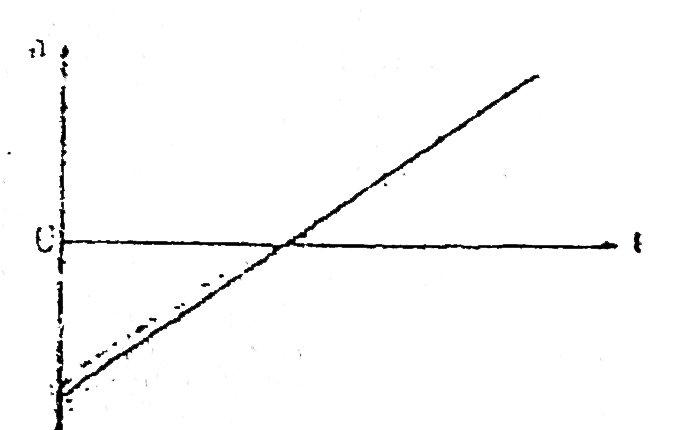
Write short notes on :
Importance of space missionsView SolutionThe graph shown the variation with times t of the velocity v of an object . Which one of the following graphs best represents the variation of acceleration a of the object with time t?
 View Solution
Graphical Representation Of Data|Difference Between Bar Graph And Histogram|Practice Problem
View SolutionShow graphically variation of AC with time. Explain the nature of the graph.
View SolutionThe given graph shows the variation of velocity with displacement. Which one of the graphs given below correctly represents the variation of acceleration with displacement ?
 View Solution
The given graph shows the variation of velocity with displacement. Which one of the graph given below correctly represents the variation of acceleration with displacement :-
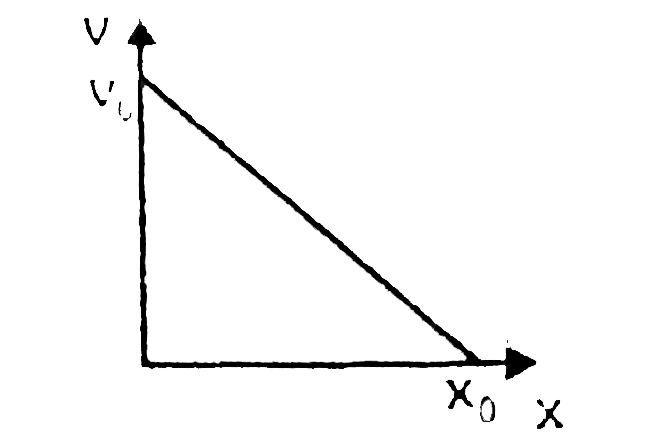 View Solution


