Write phase changes in the diagram.
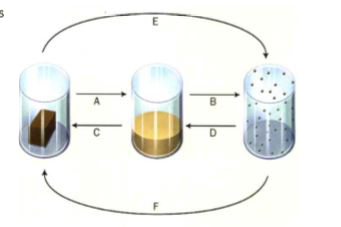
Step by step video & image solution for Write phase changes in the diagram. by Physics experts to help you in doubts & scoring excellent marks in Class 7 exams.
Updated on:21/07/2023Topper's Solved these Questions
- HEATBOOK - ICSECHAPTER - HEATEXERCISE - EXERCISE (SECTION II) (Numerical Questions)
5 Videos
- FORCE AND PRESSURE : MOTION BOOK - ICSECHAPTER - FORCE AND PRESSURE : MOTION EXERCISE - EXERCISES (SECTION II) (Picture Study)
4 Videos
- LIGHT ENERGYBOOK - ICSECHAPTER - LIGHT ENERGYEXERCISE - EXERCISE (PICTURE STUDY)
10 Videos
Similar Questions
During follicular phase changes in the ovary and the uterus are induced by chages in the levels of (A)–––– and (B)–––– hormones.
View SolutionDuring the phase change does the average kinetic energy of the molecules of the substance increase ?
View SolutionTwo sinusoidal voltage of the same frequency are shown in the diagram. What is the frequency, and the phase relationship between the voltage? Frequency in Hz phase lead of N over M in radius .
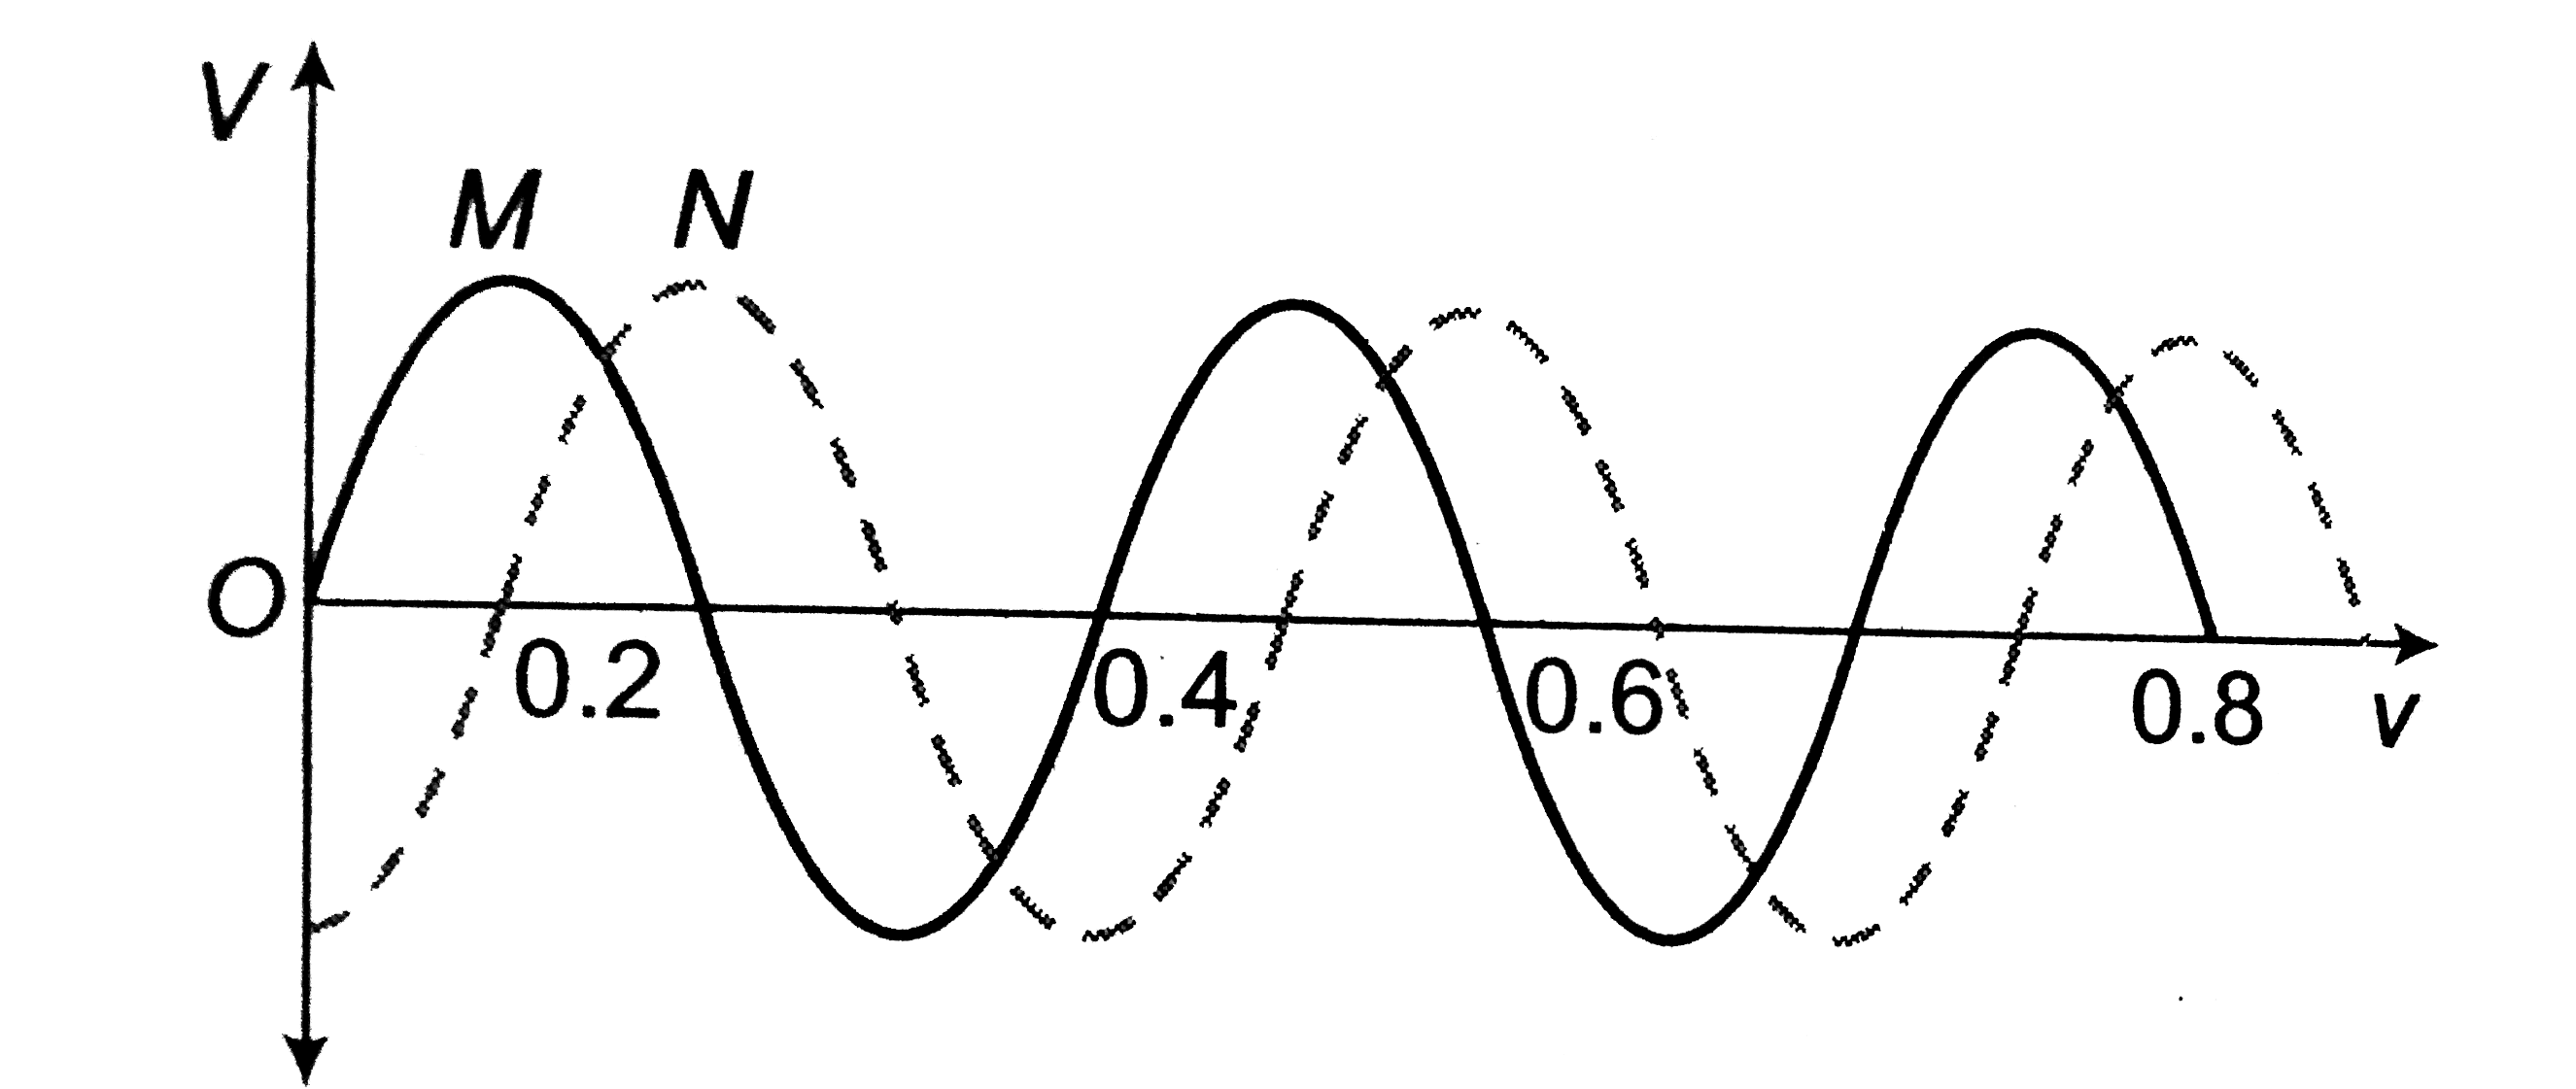
View SolutionTwo sinusoidal voltage of the same frequency are shown in the diagram. What is the frequency, and the phase relationship between the voltage?

Frequency in Hz phase lead of N over M in radius
View SolutionStudy the set-up shown in the diagram and answer the following:
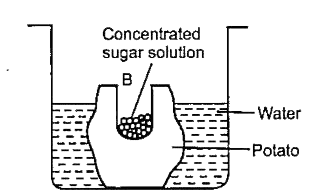
What change will you observe in part 'B' of the setup after one hour? Give reason for this change.
View SolutionWhat phase change happen when water vapour becomes frost?
View SolutionThe slope of a line in the standard (x,y) coordinate plane is 4. What is the slope of a line perpendicular to that line ?
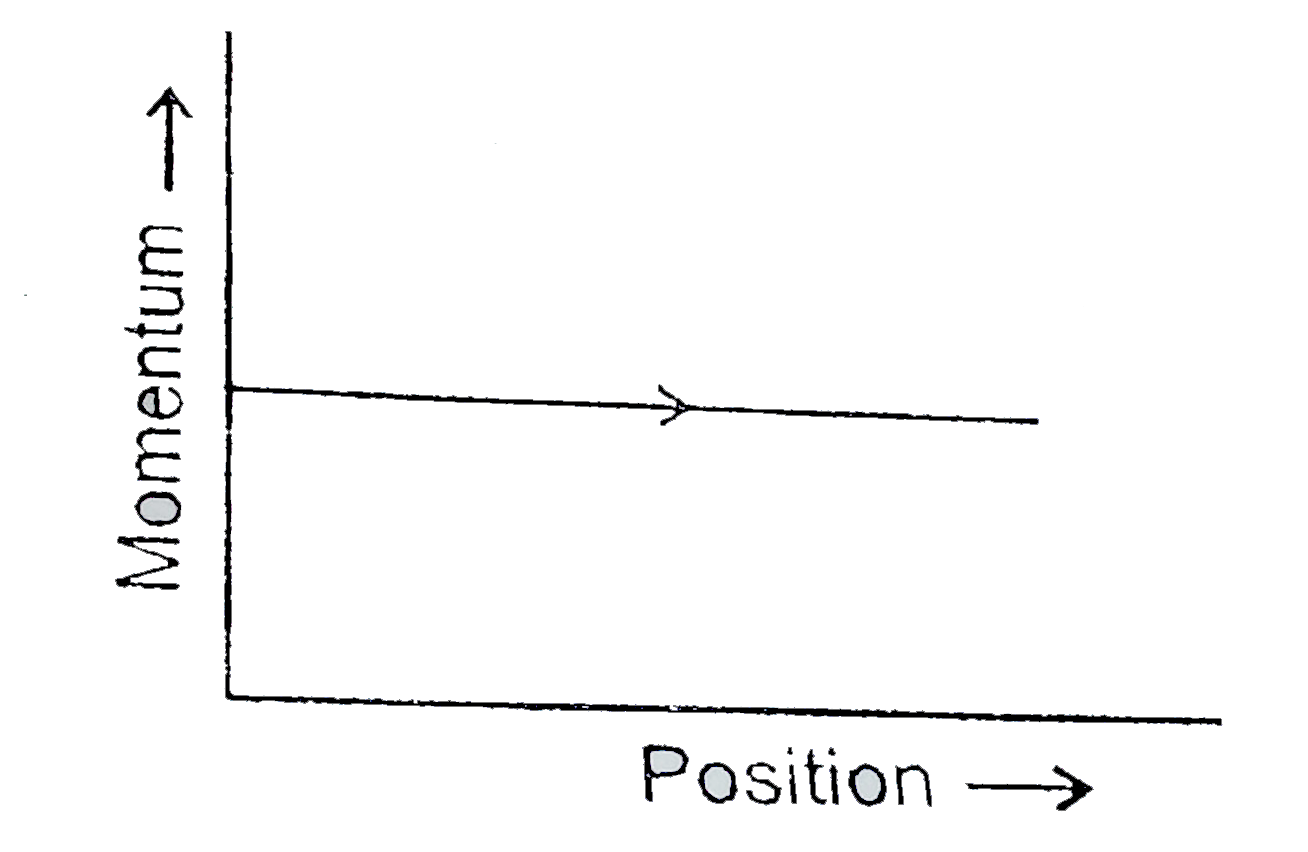
View SolutionPhase space diagrams are useful tools in analysing all kond of dynamical problems. Theya re especially useful in studying the changes in motion as initial position and momentum are changed. Here we consider some simple dynamical system in one-dimelnsion. for such systeam, phase space is a plane in which position is plotted along horizontal axis and momentum is plotted along vertical axis. The phase space diagram is x(t) vs. p(t) curve in this plane. The arrow on the curve indicates the time flow. for example, the phase space diagram for a particle moving with constant velocity is a straight line as shown in the figure. We use the sign convention in which position or momentum. upwards (or to right) is positive and downwards (or to left) is negative.
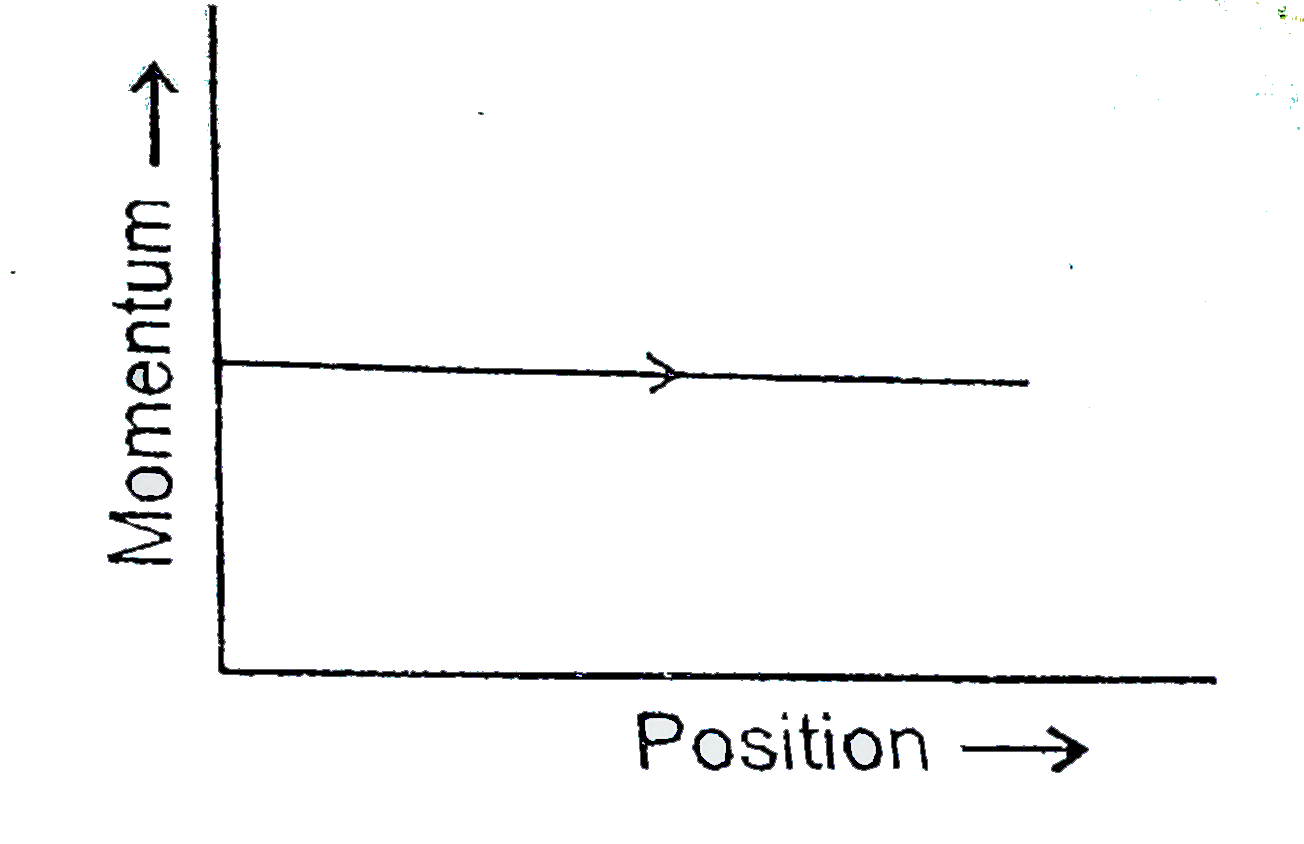
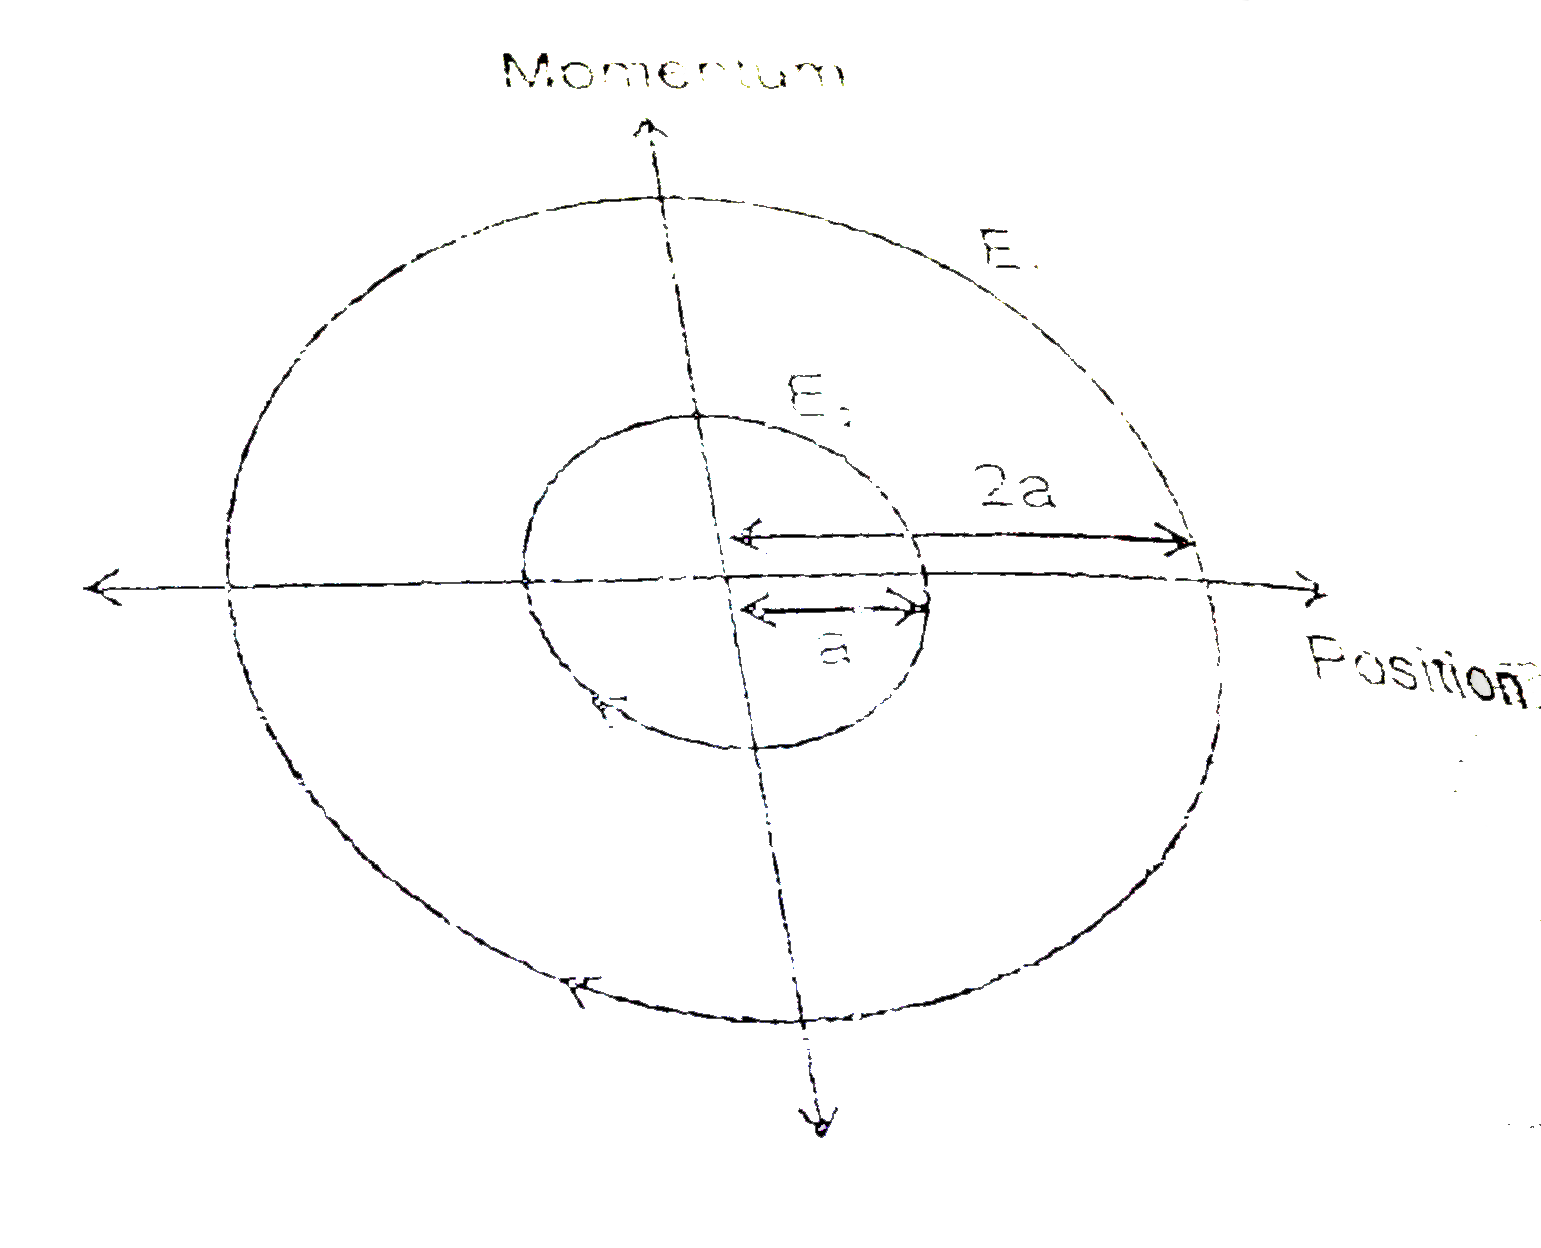
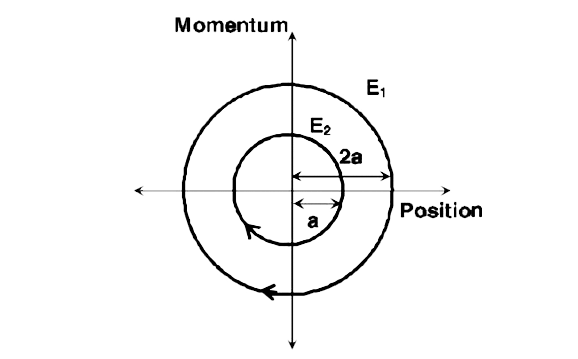
The phase space diagram for simple harmonic motion is a circle cen-tered at the origin.In the figure, the two circles represent the same oscillator but for different initial conditions, and E1 for E2 are the total mechanical energies respectively. Then
View SolutionPhase space diagrams are useful tools in analysing all kond of dynamical problems. Theya re especially useful in studying the changes in motion as initial position and momentum are changed. Here we consider some simple dynamical system in one-dimelnsion. for such systeam, phase space is a plane in which position is plotted along horizontal axis and momentum is plotted along vertical axis. The phase space diagram is x(t) vs. p(t) curve in this plane. The arrow on the curve indicates the time flow. for example, the phase space diagram for a particle moving with constant velocity is a straight line as shown in the figure. We use the sign convention in which position or momentum. upwards (or to right) is positive and downwards (or to left) is negative.
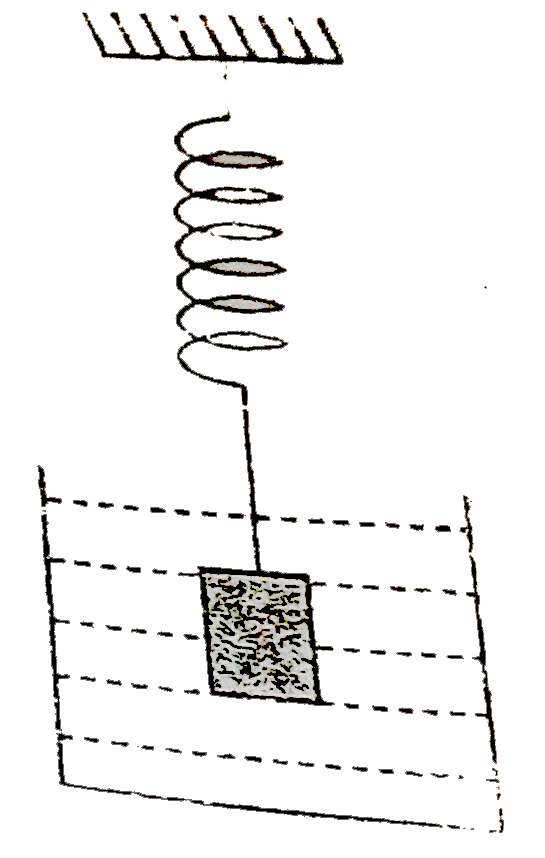
Consider the spring-mass system, with mass submerged in water, as shown in the figur, the phase diagram for one cycle of this system is :
View SolutionPhase space deagrams are useful tools
 .
.
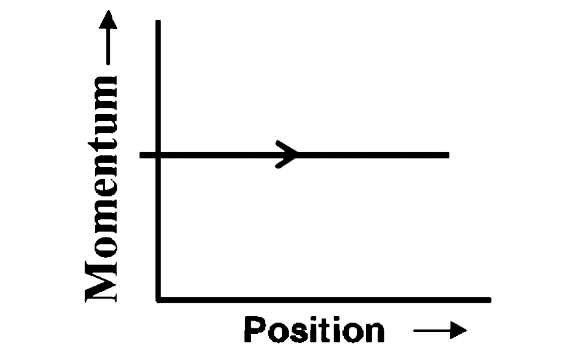
in analyzing all kinds of dynamical problems. They are especially usrful in studying the changes in motion as initial position and momenum are changed. Here we conseder some simple dynamical systems in one dimension. For such systems, phase space is a plane in which position is plotted along horizontal axis and momentum is plotted along vertical axis. The phase space diagram is x(t) vs. p(t) curve in this plane. The arrow on the curve indicates the time flow. For example, the phase space diagram for a particle moving with constant velocity is a straight line as shown in the figure. We use the sign convention in which positon or momentum upwards (or to right) is poitive and downwards (or to left) is negative.
The plase space deagram for simple harmonic motion is a circle centered at the origin. In the figure, the two circles represent the same oscillator but for different initial condetions, and E_(1) and E_(2) the total mechanical energies respectivey.
 .
.
View Solution
