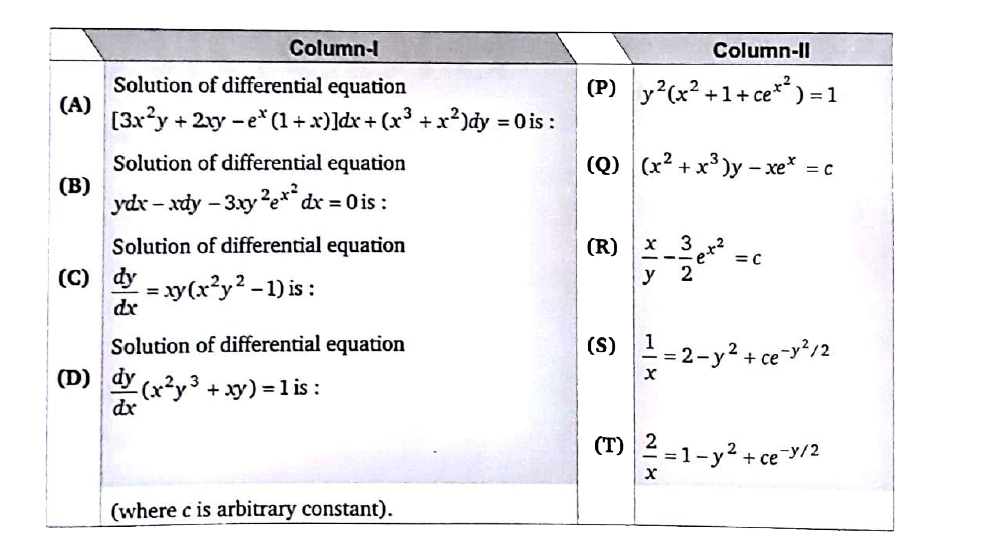
The correct Answer is:AtoQ; BtoR; CtoP; D toS
Topper's Solved these Questions
- DIFFERENTIAL EQUATIONSBOOK - VK JAISWALCHAPTER - DIFFERENTIAL EQUATIONSEXERCISE - EXERCISE (SUBJECTIVE TYPE PROBLEMS)
6 Videos
- DIFFERENTIAL EQUATIONSBOOK - VK JAISWALCHAPTER - DIFFERENTIAL EQUATIONSEXERCISE - EXERCISE (COMPREHENSION TYPE PROBLEM)
8 Videos
- DETERMINANTSBOOK - VK JAISWALCHAPTER - DETERMINANTSEXERCISE - EXERCISE-4 : SUBJECTIVE TYPE PROBLEMS
11 Videos
- ELLIPSE BOOK - VK JAISWALCHAPTER - ELLIPSE EXERCISE - Exercise-4 : Subjective Type Problems
2 Videos
Similar Questions
Find the value of |a| for which the area of triangle included between the coordinate axes and any tangent to the curve x4y=λa is constant (where λ is constnat.),
View SolutionA differentiable function y = g(x) satisfies ∫x0(x−t+1)g(t)dt=x4+x2 for all x≥0 then y=g(x) satisfies the differential equation
View SolutionIf 3n is a factor of the determinant ∣∣ ∣ ∣∣111.nC1.n+3C1.n+6C1.nC2.n+3C2.n+6C2∣∣ ∣ ∣∣ then the maximum value of n is ……..
View SolutionFor the ellipse x29+y24=1. Let O be the centre and S and S' be the foci. For any point P on the ellipse the value of PS.PS'd29 (where d is the distance of O from the tangent at P) is equal to
View SolutionHow many lines of symmetry does the above figure have ?
View SolutionWhich of the following are correct chain isomers of butane ? (i)
View SolutionDetermine the point of symmetry of a regular hexagon.
View SolutionDtermine the images of the following figure about the given line :
View SolutionMatch the following Column A to Column B

View SolutionMatch the following Column A to Column B

View SolutionMatch the following Column A to Column B

View SolutionFind the area of the figure given below.

View SolutionThe area of the shaded part in the figure given below is ______.

View SolutionThe inequation represented by the graph given below is :
View SolutionThe inequation that best describes the graph given below is _________
View SolutionThe inequation that best describes the following graph is _________
View Solution

