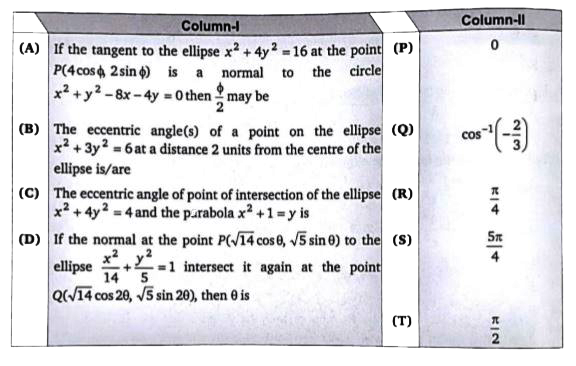
The correct Answer is:A→P,R;B→R,S;C→P;D→Q
Topper's Solved these Questions
- ELLIPSE BOOK - VK JAISWALCHAPTER - ELLIPSE EXERCISE - Exercise-4 : Subjective Type Problems
2 Videos
- ELLIPSE BOOK - VK JAISWALCHAPTER - ELLIPSE EXERCISE - Exercise-2 : Comprehension Type Problems
5 Videos
- DIFFERENTIAL EQUATIONSBOOK - VK JAISWALCHAPTER - DIFFERENTIAL EQUATIONSEXERCISE - EXERCISE (SUBJECTIVE TYPE PROBLEMS)
6 Videos
- FUNCTION BOOK - VK JAISWALCHAPTER - FUNCTION EXERCISE - SUBJECTIVE TYPE PROBLEMS
34 Videos
Similar Questions
For the ellipse x29+y24=1. Let O be the centre and S and S' be the foci. For any point P on the ellipse the value of PS.PS'd29 (where d is the distance of O from the tangent at P) is equal to
View SolutionAn ellipse has semi-major axis of length 2 and semi-minor axis of length 1. It sides between the co-ordinate axes in the first quadrant, while maintaining contact with both x-axis and y-axis.
Q. The locus of the centre of ellipse is :
View SolutionFind the value of |a| for which the area of triangle included between the coordinate axes and any tangent to the curve x4y=λa is constant (where λ is constnat.),
View SolutionLet f(x) be a polynomial of degree 6 with leading coefficient 2009. Suppose further that f(1) =1, f(2)=3, f(3)=5, f(4)=7, f(5) =9, f'(2)=2. Then the sum of all the digits of f(6) is
View SolutionHow many lines of symmetry does the above figure have ?
View SolutionWhich of the following are correct chain isomers of butane ? (i)
View SolutionDetermine the point of symmetry of a regular hexagon.
View SolutionDtermine the images of the following figure about the given line :
View SolutionMatch the following Column A to Column B

View SolutionMatch the following Column A to Column B

View SolutionMatch the following Column A to Column B

View SolutionFind the area of the figure given below.

View SolutionThe area of the shaded part in the figure given below is ______.

View SolutionThe inequation represented by the graph given below is :
View SolutionThe inequation that best describes the graph given below is _________
View SolutionThe inequation that best describes the following graph is _________
View Solution

