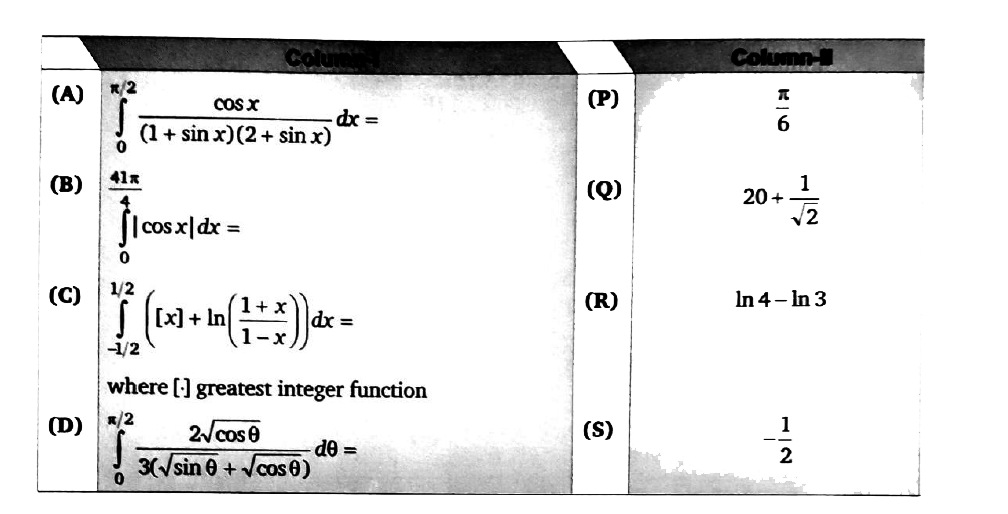
The correct Answer is:A→R;B→Q;C→S;D→P
Step by step video & image solution for by Maths experts to help you in doubts & scoring excellent marks in Class 12 exams.
Updated on:21/07/2023Topper's Solved these Questions
- INDEFINITE AND DEFINITE INTEGRATIONBOOK - VK JAISWAL ENGLISHCHAPTER - INDEFINITE AND DEFINITE INTEGRATIONEXERCISE - EXERCISE (SUBJECTIVE TYPE PROBLEMS)
29 Videos
- INDEFINITE AND DEFINITE INTEGRATIONBOOK - VK JAISWAL ENGLISHCHAPTER - INDEFINITE AND DEFINITE INTEGRATIONEXERCISE - EXERCISE (COMPREHENSION TYPE PROBLEMS)
16 Videos
- HYPERBOLABOOK - VK JAISWAL ENGLISHCHAPTER - HYPERBOLAEXERCISE - Exercise-4 : Subjective Type Problems
3 Videos
- INVERSE TRIGONOMETRIC FUNTIONS BOOK - VK JAISWAL ENGLISHCHAPTER - INVERSE TRIGONOMETRIC FUNTIONS EXERCISE - Exercise-5 : Subjective Type Problems
6 Videos
Similar Questions
∫x+(cos−13x)2√1−9x2dx=1k1(√1−9x2+(cos−13x)k2)+c, then k21+k22= (where C is an arbitrary constnat. )
View SolutionLet f(x)=∫x2cos2x(2x+6tanx−2xtan2x)dxandf(x) passes through the point (π,0)
If f:R−(2n+1)π2→R then f(x) be a :
View SolutionLet y=mx+c be a common tangent to x216−y29=1andx24+y23=1, then find the value of m2+c2.
View SolutionThe complete set of values of x satisfying the inequality sin−1(sin5)>x2−4x is (2−√λ−2π,2+√λ−2π), then λ=
View SolutionHow many lines of symmetry does the above figure have ?
View SolutionWhich of the following are correct chain isomers of butane ? (i)
View SolutionDetermine the point of symmetry of a regular hexagon.
View SolutionDtermine the images of the following figure about the given line :
View SolutionMatch the following Column A to Column B

View SolutionMatch the following Column A to Column B

View SolutionMatch the following Column A to Column B

View SolutionFind the area of the figure given below.

View SolutionThe area of the shaded part in the figure given below is ______.

View SolutionThe inequation represented by the graph given below is :
View SolutionThe inequation that best describes the graph given below is _________
View SolutionThe inequation that best describes the following graph is _________
View Solution

