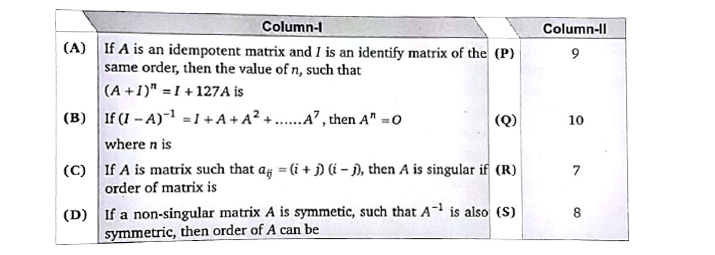
The correct Answer is:A→R;B→P,Q,S;C→P,R;D→P,Q,R,S
Step by step video & image solution for by Maths experts to help you in doubts & scoring excellent marks in Class 12 exams.
Updated on:21/07/2023Topper's Solved these Questions
- MATRICES BOOK - VK JAISWAL ENGLISHCHAPTER - MATRICES EXERCISE - Exercise-4 : Subjective Type Problems
5 Videos
- MATRICES BOOK - VK JAISWAL ENGLISHCHAPTER - MATRICES EXERCISE - Exercise-2 : One or More than One Answer is/are Correct
5 Videos
- LOGARITHMS BOOK - VK JAISWAL ENGLISHCHAPTER - LOGARITHMS EXERCISE - Exercise-5 : Subjective Type Problems
19 Videos
- PARABOLABOOK - VK JAISWAL ENGLISHCHAPTER - PARABOLAEXERCISE - Exercise-5 : Subjective Type Problems
2 Videos
Similar Questions
A and B are two matrices. Such that A2B=BA and if (AB)10=Ak⋅B10. Find the value of k 1020.
View SolutionIf A and B are two orthogonal matrices of order n and det(A)+det(B)=0, then which of the following must be correct ?
View SolutionThe number N=6log1040⋅5log1036 is a natural number. Then sum of digits of N is :
View SolutionPoints A and B lie on the parabola y=2x2+4x−2, such that origin is the mid-point of the line segment AB. If 'l' be the length of the line segment AB, then find the unit digit of l2.
View SolutionHow many lines of symmetry does the above figure have ?
View SolutionWhich of the following are correct chain isomers of butane ? (i)
View SolutionDetermine the point of symmetry of a regular hexagon.
View SolutionDtermine the images of the following figure about the given line :
View SolutionMatch the following Column A to Column B

View SolutionMatch the following Column A to Column B

View SolutionMatch the following Column A to Column B

View SolutionFind the area of the figure given below.

View SolutionThe area of the shaded part in the figure given below is ______.

View SolutionThe inequation represented by the graph given below is :
View SolutionThe inequation that best describes the graph given below is _________
View SolutionThe inequation that best describes the following graph is _________
View Solution

