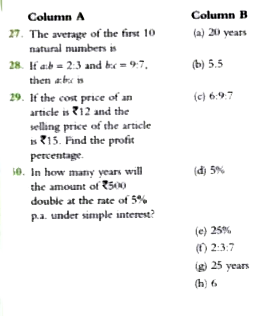
The correct Answer is:b,c,e,a
Topper's Solved these Questions
- RATIO AND ITS APPLICATIONSBOOK - PEARSON IIT JEE FOUNDATIONCHAPTER - RATIO AND ITS APPLICATIONSEXERCISE - ASSESSMENT TESTS (TEST 1)
12 Videos
- NUMBER SYSTEMBOOK - PEARSON IIT JEE FOUNDATIONCHAPTER - NUMBER SYSTEMEXERCISE - ASSESSMENT TESTS
24 Videos
- Set theoryBOOK - PEARSON IIT JEE FOUNDATIONCHAPTER - Set theoryEXERCISE - ASSESSMENT TEST Test 2
12 Videos
Similar Questions
The ages of A and B are in the ratio 5:4 and the difference of their ages is 10 years. Find the ratio of their ages 8 years before.
The following steps are involved in solving the above problem. Arrange them in sequential order.
(A) Let the age of A be 5x years and the age of B be 4x years.
(B) 8 years ago, A's age was 42 years and B's age was 32 years. The required ratio = 42:32 = 21:16.
(C) 5x-4x = 10 ⇒x=10
(D) A's age = 5x = 5×10=50 years and B's age = 4x=4×10=40 " years"
View SolutionFind the smallest number by which 2592 should be divided so that the quotient is a perfect cube The folloiwng are the steps involved in solving the above problem .Arrange them in sequential order
(A) On prime factorisation 2592 =25×34
(B) 2592 should be divided by 12 so that the quotient is a perfect cube
(C ) Now 2592 =(6)3×12
View SolutionThe mean of 2, 12, x, 15, 20, and 17 is 16, then find the value of x .
The following steps are involved in solving the above problem. Arrange them in sequential order.
(A)16=2+12+x+15,20+176
(B ) 96=66+x
( c)⇒x=96−66=30
(D) We have,arithmetic mean
=The sum of observations Total number of observatons
View SolutionHow many lines of symmetry does the above figure have ?
View SolutionWhich of the following are correct chain isomers of butane ? (i)
View SolutionDetermine the point of symmetry of a regular hexagon.
View SolutionDtermine the images of the following figure about the given line :
View SolutionMatch the following Column A to Column B

View SolutionMatch the following Column A to Column B

View SolutionMatch the following Column A to Column B

View SolutionFind the area of the figure given below.

View SolutionThe area of the shaded part in the figure given below is ______.

View SolutionThe inequation represented by the graph given below is :
View SolutionThe inequation that best describes the graph given below is _________
View SolutionThe inequation that best describes the following graph is _________
View SolutionWhich inequations represent the shaded region in the given figure
View Solution

