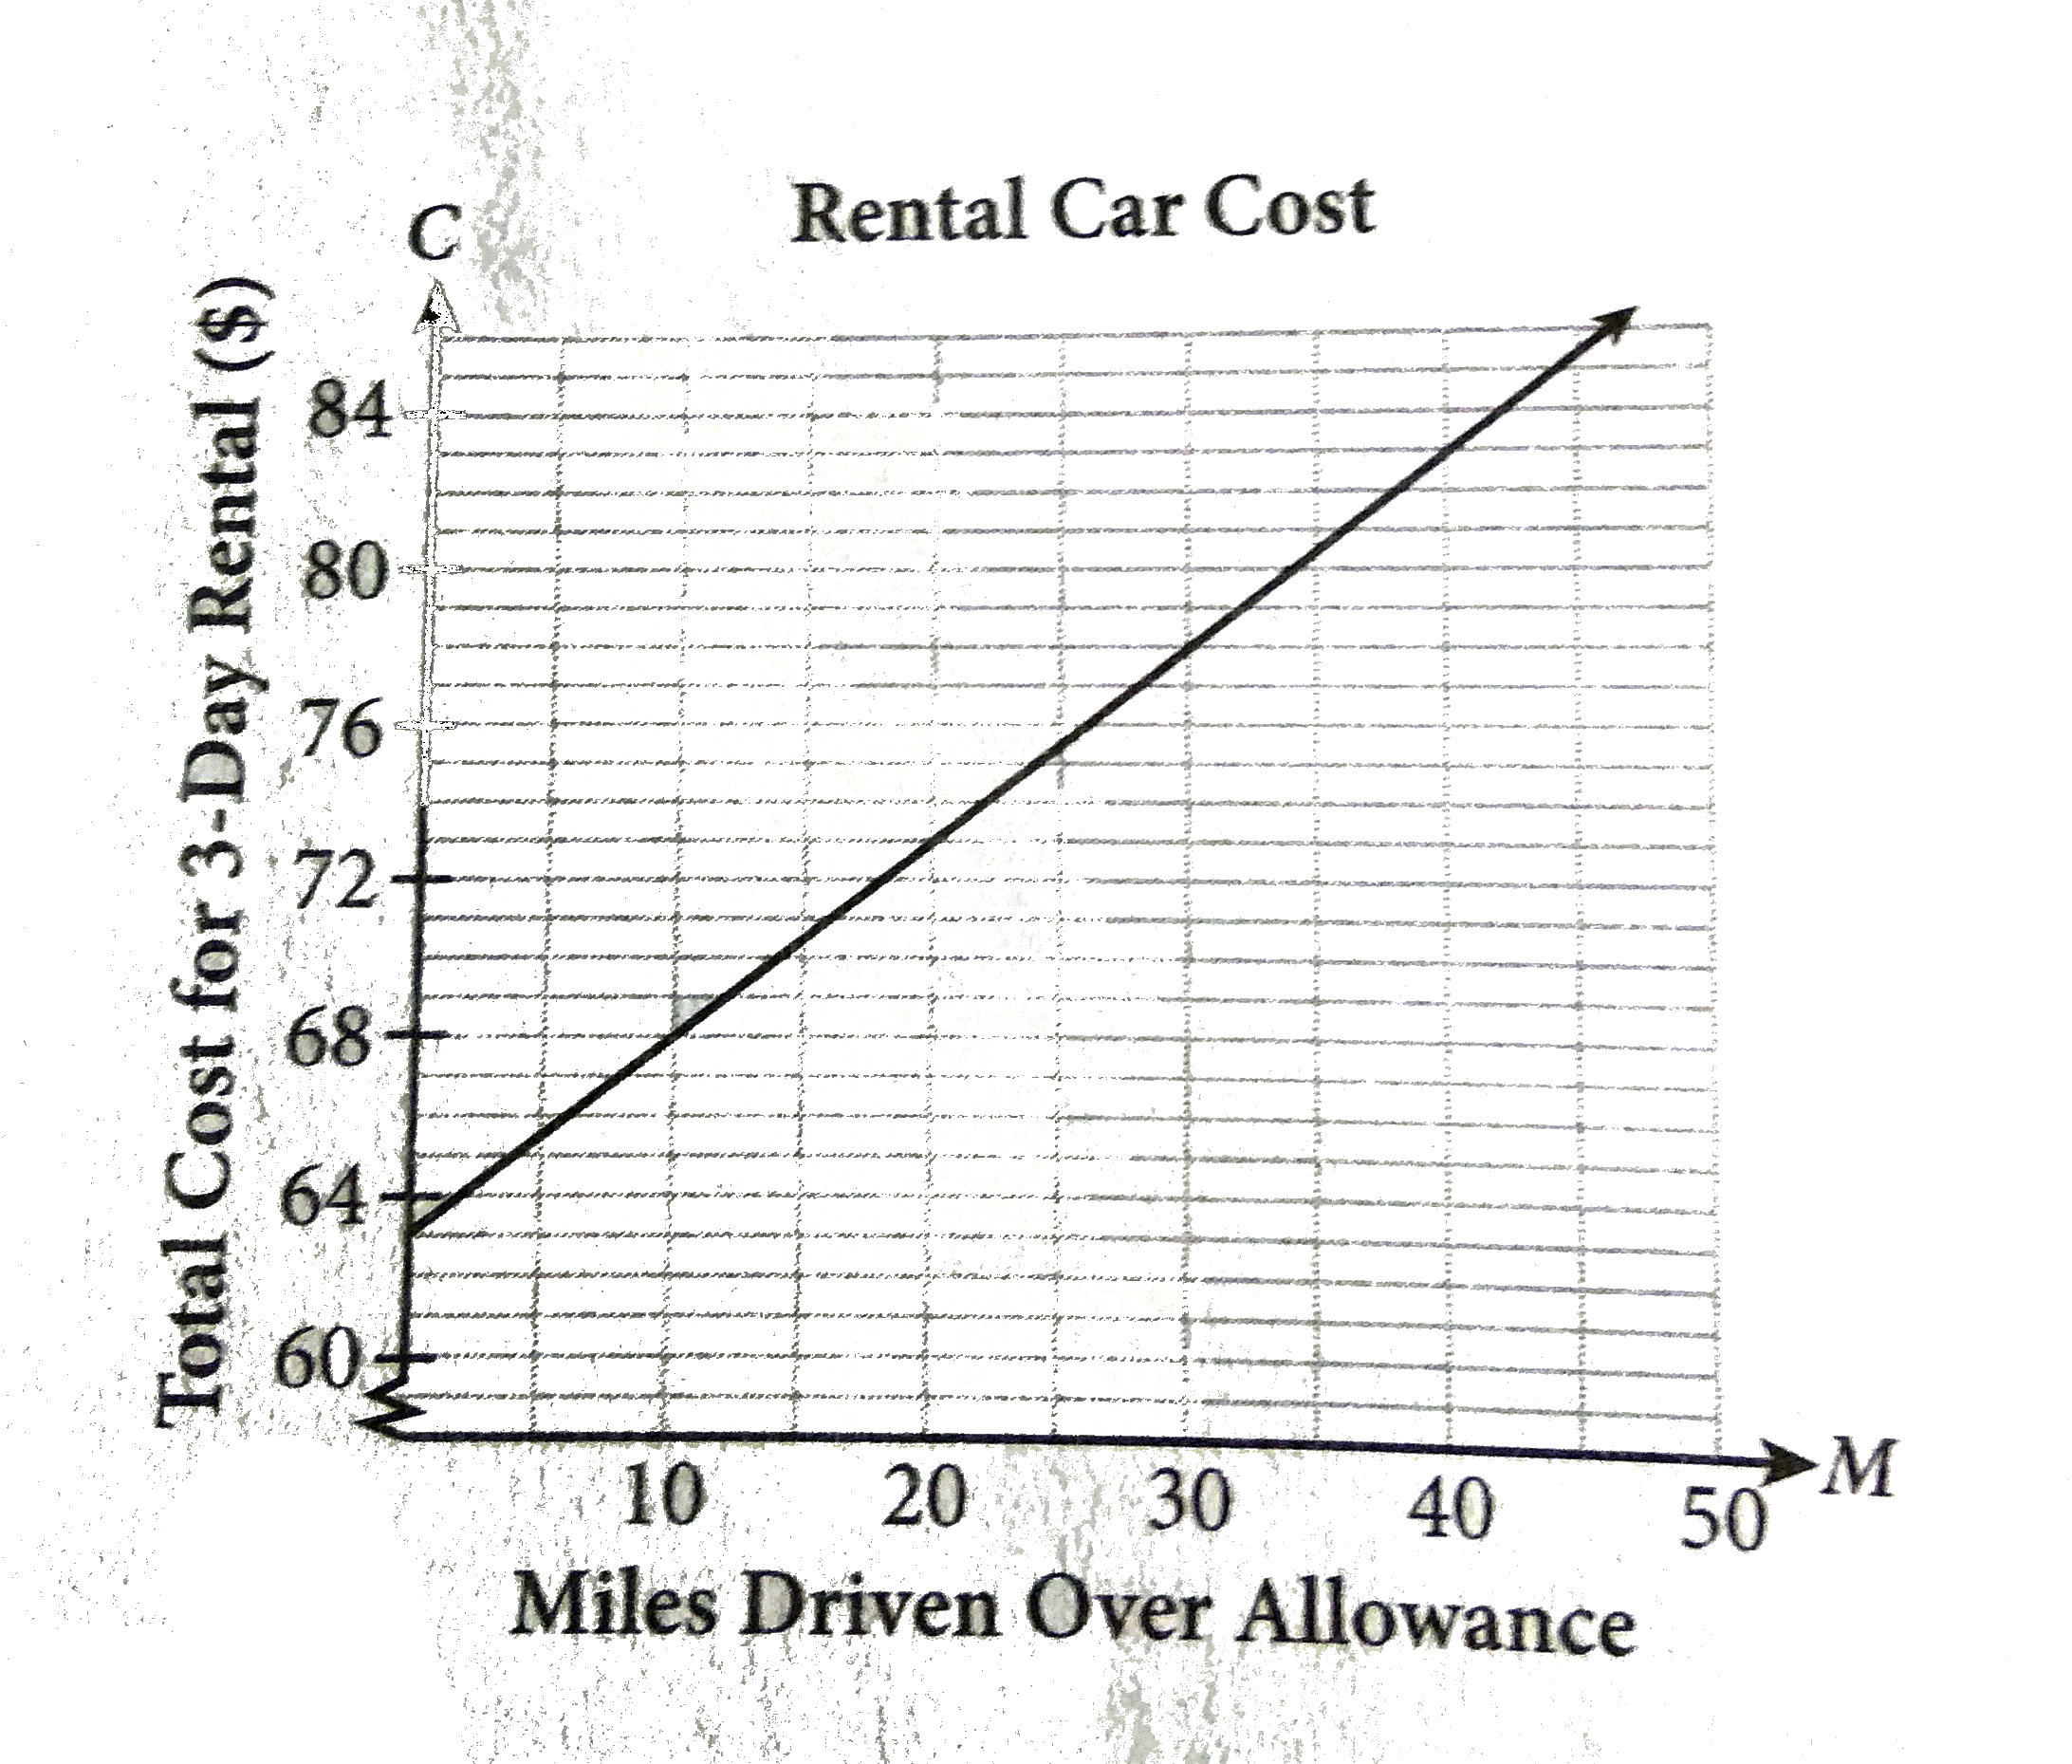
A car retal agency charges a per day rental fee which includes a daily mile age allowance plus a certain amount per mile driven over the allowance. The graph above compares the miles driven over the allowance and the total cost for a 3-day rental. What does the C-intercept most likely represent in this scenario?
The per day rental fee for renting the car
The number of mile a rental may drive the car per day
The penalty a renter must pay if the daily mileage allowance is exceeded
The total cost of a 3-day rental assuming the car is not driven over the allowance
The correct Answer is:D
Difficult: Medium
Category: Heart of Algebra/ Linear Equations
Strategic Advice: In a real-world scenario, the slope of a line represents a unit rate and the y-intercept represents a flat fee or a starting amount. In some questions, you may meed to use the axis titles to interpret the meaning of the intercept.
Getting to the Answer: With miles driven over the allowance plotted along the horizontal axis and the total cost for a 3-day rental plotted along vertical axis (the C-axis), the point (0. 63) indicates that driving 0 miles over the allowance (or not driving over the allowace ) results in a cost $63. This makes (D) correct.
Topper's Solved these Questions
Similar Questions
Which of the following gives all values of j that satisfy the inequality 3j−4≤6j+11?
View SolutionThe angles of trinalge are in the ratio 2:3:4. What is the degree measures of the largest angle?
View SolutionHow many lines of symmetry does the above figure have ?
View SolutionWhich of the following are correct chain isomers of butane ? (i)
View SolutionDetermine the point of symmetry of a regular hexagon.
View SolutionMatch the following Column A to Column B

View SolutionMatch the following Column A to Column B

View SolutionMatch the following Column A to Column B

View SolutionThe inequation represented by the graph given below is :
View SolutionThe inequation that best describes the graph given below is _________
View SolutionThe inequation that best describes the following graph is _________
View SolutionWhich inequations represent the shaded region in the given figure
View Solutiony = 19.99 + 1.50x
The equation above models the total cost y, in dollars, that a company charges a customer to rent a truck for one day and drive the truck x miles. The total cost consists of a flat fee plus a charge per mile driven. When the equation is graphed in the xy-plane, what does the y-intercept of the graph represent in terms of the model?
View SolutionJonah rented a car for two days and his bill came to $108.00 . The rental company charged $30 a day and 15cancelc for each mile driven. If x is the number of miles that Jonah drove , which equation correctly determines x ?
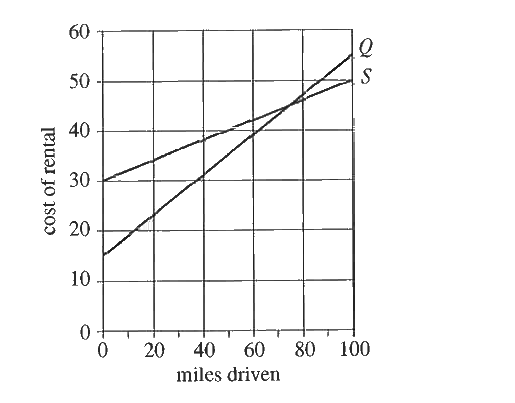
View SolutionAt both Quick Car Rental and Speedy Car Rental, the cost, in dollars, of renting a full - size car depends on a fixed daily rental fee and a fixed charge per mile that the car is driven. However, the daily rental fee and the charge per mile are not the same for the 2 companies. In the graph below, line Q represents the total cost for Quick Car Rental and line S represents the total cost for Speedy Car Rental.

Robert plans to rent a full-size car for 1 day and drive only 50 miles. If his only consideration is to incur the least cost, which company should he choose?
View Solution
