A cumulative frequency distribution is given below. Convert this into a frequency distribution table. Marks Below 45 Below 60 Below 75 Below 90 Below 105 Below 120 No. of Students 0 8 23 48 85 116
To convert the given cumulative frequency distribution into a frequency distribution table, we will follow these steps:
Step 1: Identify the cumulative frequencies
The cumulative frequencies given are:
- Below 45: 0
- Below 60: 8
- Below 75: 23
- Below 90: 48
- Below 105: 85
- Below 120: 116
Step 2: Determine the frequency for each class interval
We will calculate the frequency for each class interval by subtracting the cumulative frequency of the previous class from the cumulative frequency of the current class.
1. For the interval 0 to 45:
- Cumulative frequency = 0
- Frequency = 0 (since there are no students below 45)
2. For the interval 45 to 60:
- Cumulative frequency = 8
- Frequency = 8 - 0 = 8
3. For the interval 60 to 75:
- Cumulative frequency = 23
- Frequency = 23 - 8 = 15
4. For the interval 75 to 90:
- Cumulative frequency = 48
- Frequency = 48 - 23 = 25
5. For the interval 90 to 105:
- Cumulative frequency = 85
- Frequency = 85 - 48 = 37
6. For the interval 105 to 120:
- Cumulative frequency = 116
- Frequency = 116 - 85 = 31
Step 3: Compile the frequency distribution table
Now we can compile the frequency distribution table as follows:
| Marks Interval | No. of Students (Frequency) |
|----------------|------------------------------|
| 0 - 45 | 0 |
| 45 - 60 | 8 |
| 60 - 75 | 15 |
| 75 - 90 | 25 |
| 90 - 105 | 37 |
| 105 - 120 | 31 |
Final Frequency Distribution Table
The final frequency distribution table is:
| Marks Interval | No. of Students |
|----------------|-----------------|
| 0 - 45 | 0 |
| 45 - 60 | 8 |
| 60 - 75 | 15 |
| 75 - 90 | 25 |
| 90 - 105 | 37 |
| 105 - 120 | 31 |
---
The cumulative frequencies given are:
- Below 45: 0
- Below 60: 8
- Below 75: 23
- Below 90: 48
- Below 105: 85
- Below 120: 116
We will calculate the frequency for each class interval by subtracting the cumulative frequency of the previous class from the cumulative frequency of the current class.
- Cumulative frequency = 0
- Frequency = 0 (since there are no students below 45)
- Cumulative frequency = 8
- Frequency = 8 - 0 = 8
- Cumulative frequency = 23
- Frequency = 23 - 8 = 15
- Cumulative frequency = 48
- Frequency = 48 - 23 = 25
- Cumulative frequency = 85
- Frequency = 85 - 48 = 37
- Cumulative frequency = 116
- Frequency = 116 - 85 = 31
Now we can compile the frequency distribution table as follows:
|----------------|------------------------------|
| 0 - 45 | 0 |
| 45 - 60 | 8 |
| 60 - 75 | 15 |
| 75 - 90 | 25 |
| 90 - 105 | 37 |
| 105 - 120 | 31 |
The final frequency distribution table is:
|----------------|-----------------|
| 0 - 45 | 0 |
| 45 - 60 | 8 |
| 60 - 75 | 15 |
| 75 - 90 | 25 |
| 90 - 105 | 37 |
| 105 - 120 | 31 |
Topper's Solved these Questions
Similar Questions
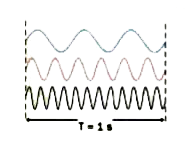
Find the frequency of the waves given below.

View SolutionGiven below are the cumulative frequencies showing the weights of 685 students of a school. Prepare a frequency distribution table. Weight (in kg), No. of students Below 25 Below 30 Below 35 Below 40 Below 45 Below 50 Below 55 Below 60 Below 65 Below 70, 0 24 78 183 294 408 543 621 674 685
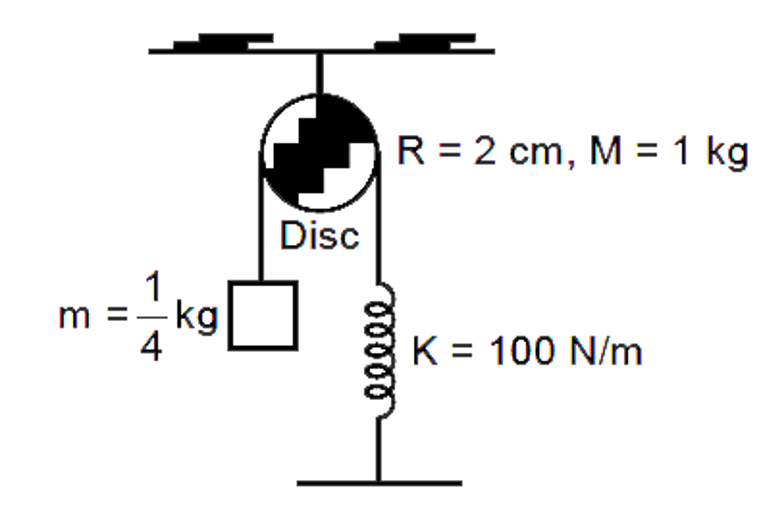
View SolutionFor the system given below, find the angular frequency of oscillation?

View SolutionComplexes given below show:

View SolutionComplexes given below show:

View SolutionFind the mean marks of the students from the following cumulative frequency distribution: Marks: Below Below Below Below Below Below Below Below Below Below 10 20 30 40 50 60 70 80 90 100 No. of Students 5 9 17 29 45 60 70 78 83 85
View SolutionCalculate the mean of the distribution given below using the short cut method.

View SolutionComplete the reactions given below:

View SolutionThe product of the reaction given below is

View SolutionThe structure given below is known as

View Solution
