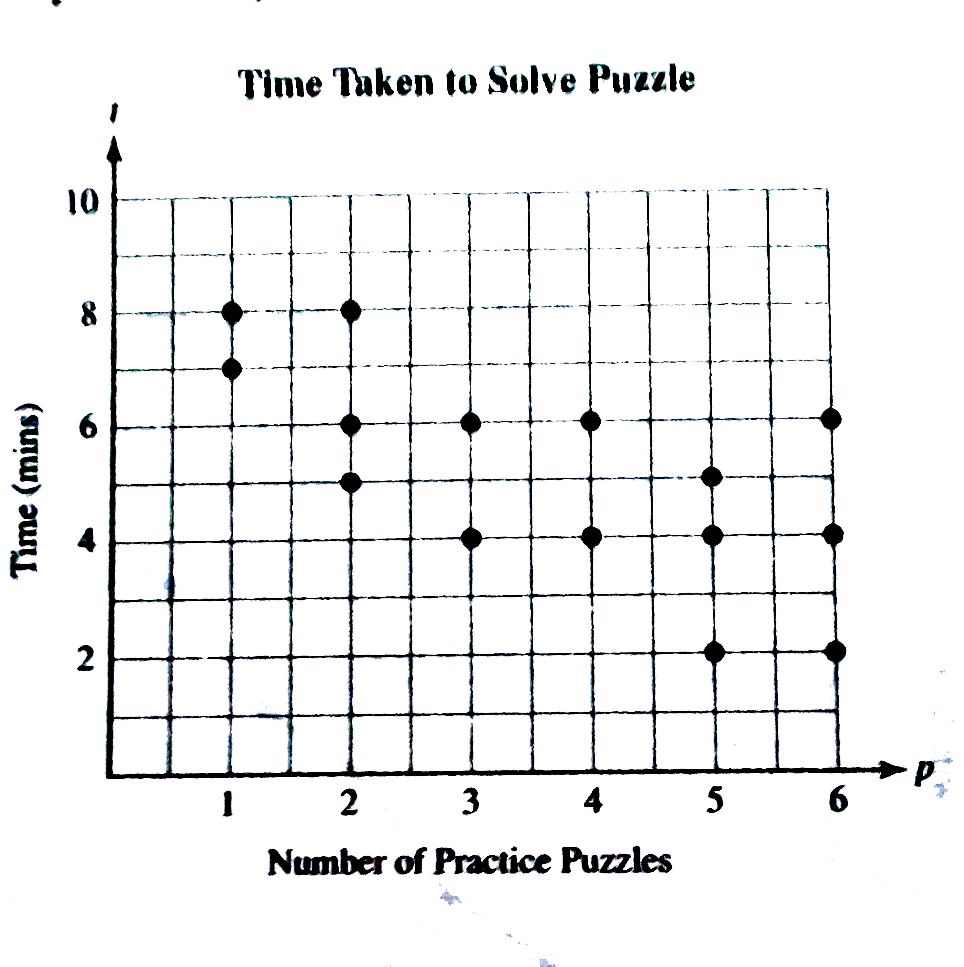
A psychologist's experiment involved timing 15 small children as they found the solution to a little puzzle . Each child received at least one similar puzzle to play with before being timed . The scatterplot below shows the time each child took to solve the puzzle , and the corresponding number of "practice" puzzles each child received . On the basis of these data , which of the following functions best models the relationship between t, the number of minutes taken to complete the puzzle , and p , the number of practice puzzles ?

t(p)=9
t(p)=p2+9
t(p)=−p2+9
t(p)=−p2
The correct Answer is:B
Similar Questions
Mrs. Thomas divided n chocolates equally among her 2 children.
The number of chocolates received by each child is equivalent to which of the following expressions?
View SolutionThe number of ways in which 10 identical apples can be distributed among 6 children so that each child receives atleast one apple is :
View Solution
Knowledge Check
A child receives
A25% genes form his fatherB50% genes form his fatherC75% genes form his fatherD100% genes form his fatherIn the previous problem (no.27), the number of times each child will go to the park is :
AA) 14BB) 8CC) 21DD) none of theseSelect the correct active form of the given sentence.
I am sometimes puzzled by her actionsAHer actions are sometimes puzzled by meBHer actions sometimes puzzle meCShe can sometimes puzzle me.DHer actions were sometimes puzzling me.
The education that child receives in family is
View SolutionWhat would be the C.I. on an amount of rs. 4800 at the rate of 5% p.a. for 3 years?
View Solution'How clever of you to have solved the puzzle so quickly," said the mother.
View SolutionHow clever of you to have solved the puzzle so quickly" said the mother.
View SolutionDirection: In these questions, sentences are given with blanks to be filled in with an appropriate word(s). Four alternatives are suggested for each question. Choose the correct alternative out of the four alternatives.
It took the child a long time to recover ___ the shock
View Solution
