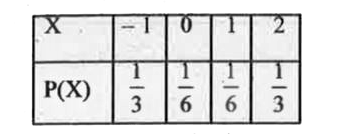
A random variable has the following distribution

i. Does it represent a probability function?
ii. If yes, find its mean and variance.Solution in Tamil
The correct Answer is:i. Yes, ii. 12, variance= 1912
Step by step video, text & image solution for A random variable has the following distribution i. Does it represent a probability function? ii. If yes, find its mean and variance. by Maths experts to help you in doubts & scoring excellent marks in Class 12 exams.
Topper's Solved these Questions
- BOOK - NEW JOYTHI PUBLICATIONCHAPTER - PROBABILITYEXERCISE - CONTINUOUS EVALUATION (ASSIGNMENT)2videos
PROBABILITY
- BOOK - NEW JOYTHI PUBLICATIONCHAPTER - PROBABILITYEXERCISE - CONTINUOUS EVALUATION (LAB WORK)1videos
PROBABILITY
- BOOK - NEW JOYTHI PUBLICATIONCHAPTER - PROBABILITYEXERCISE - SOLUTIONS TO NCERT MISCELLANEOUS EXERCISE19videos
PROBABILITY
- BOOK - NEW JOYTHI PUBLICATIONCHAPTER - PRINCIPLES OF MATHEMATICAL INDUCTIONEXERCISE - QUESTIONS FROM COMPETITIVE EXAMS4videos
PRINCIPLES OF MATHEMATICAL INDUCTION
- BOOK - NEW JOYTHI PUBLICATIONCHAPTER - RELATIONS AND FUNCTIONS EXERCISE - QUESTIONS FROM COMPETITIVE EXAMS33videos
RELATIONS AND FUNCTIONS
Similar Questions
It is known that 10% of certain articles manufactured are defective. What is the probability that in a random sample of 12 such articles, 9 are defective?
01:37View SolutionDraw a tree diagram to represent the sample space in the following cases
i. A coin is tossed once
ii. A coin is tossed twice
iii. A coin is tossed 3 times
Generalise the number of outcomes when a coin is tossed n times.06:07View SolutionA and B are two events such that P(A)≠0. Find P(B|A), if
i. A is a subset of B , ii. A∩B=002:11View Solution10n+3(4n+2)+5 is divisible by (n∈N)
01:31View SolutionIf x≠1 and f(x)=x+1x−1 is a real function then fff (2) is
02:45View SolutionHow many lines of symmetry does the above figure have ?
02:17View SolutionWhich of the following are correct chain isomers of butane ? (i)
05:41View SolutionDetermine the point of symmetry of a regular hexagon.
02:10View SolutionDtermine the images of the following figure about the given line :
02:17View SolutionMatch the following Column A to Column B
 02:10View Solution
Match the following Column A to Column B
 04:23View Solution
Match the following Column A to Column B
 01:21View Solution
The inequation represented by the graph given below is :
03:12View SolutionThe inequation that best describes the graph given below is _________
04:00View SolutionThe inequation that best describes the following graph is _________
05:46View SolutionWhich inequations represent the shaded region in the given figure
06:52View Solution

