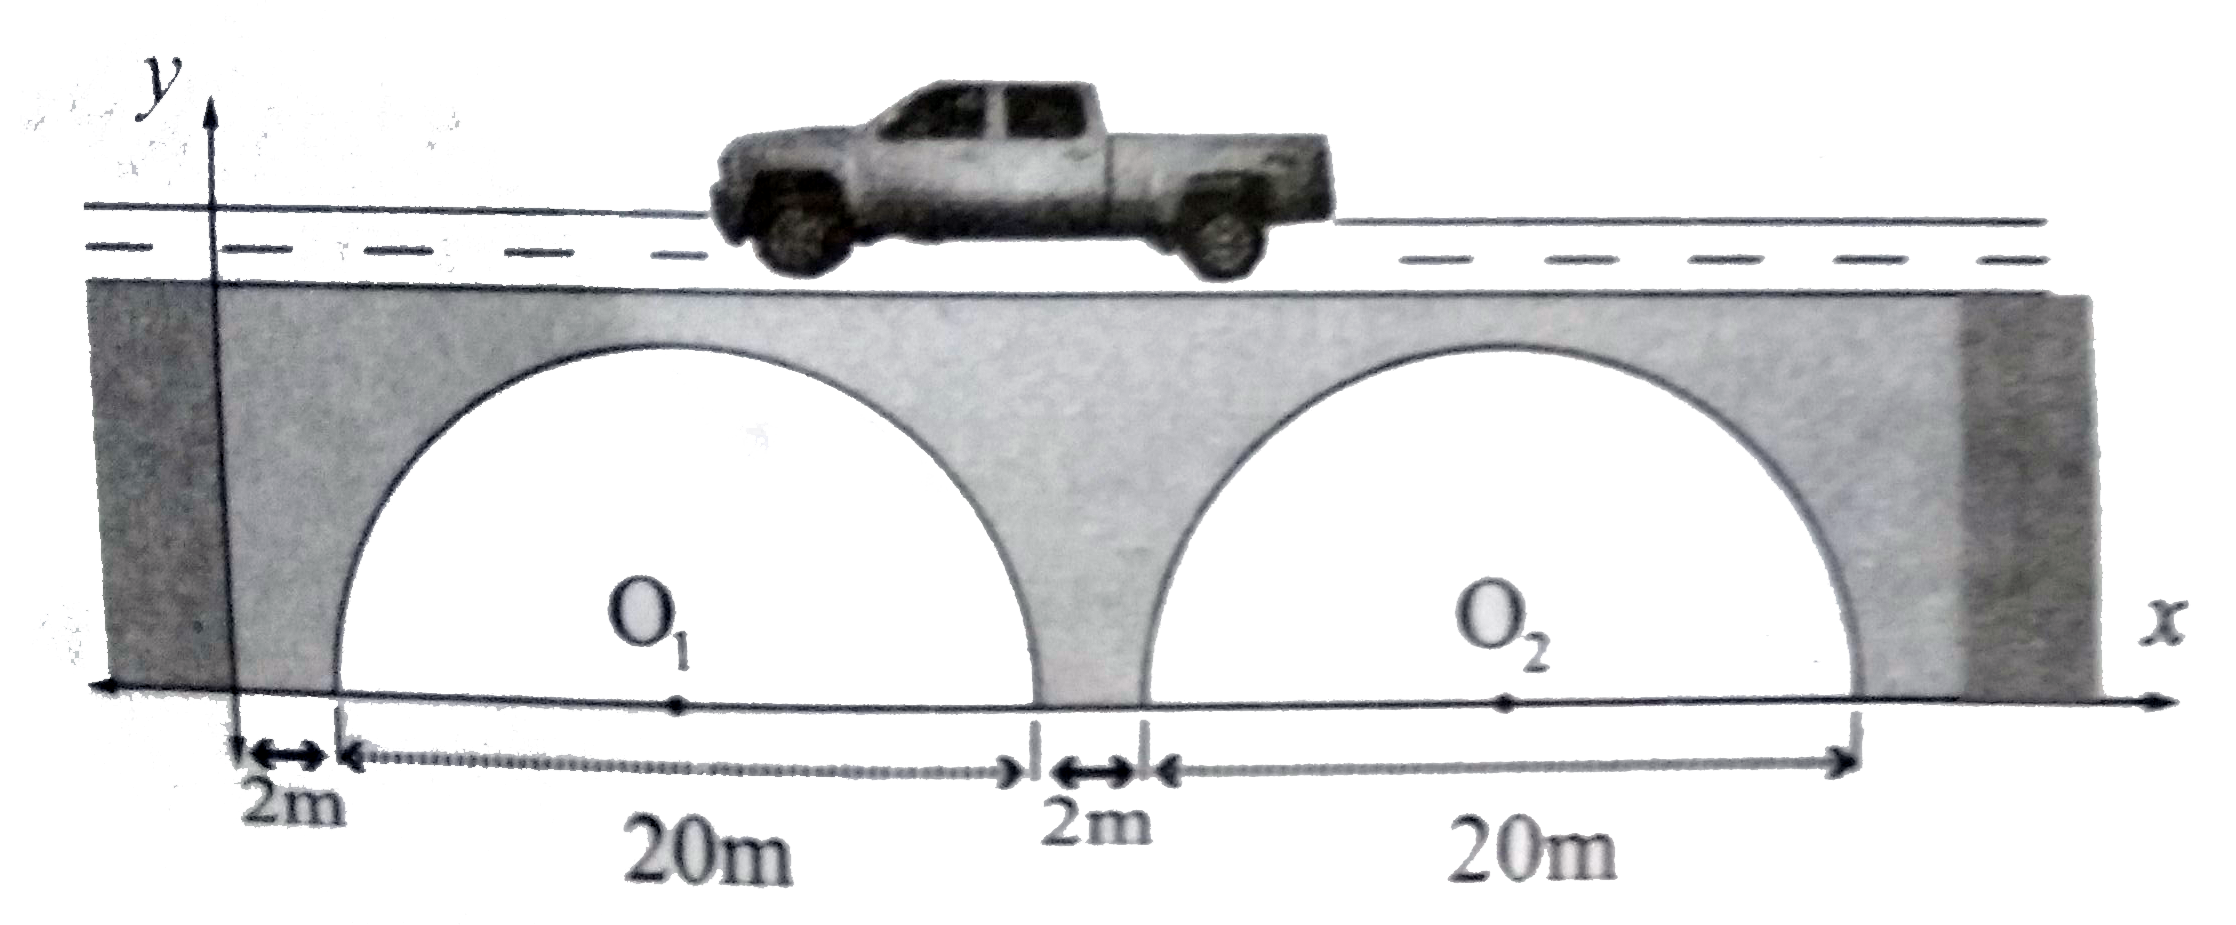
A road bridge over an irrigation canal have two semi circular vents each with a span of 20 m and the supporting pillars of width 2m. Use figure to write the equations that represent the semi verticular vents.
 Solution in Tamil
Step by step video & image solution for A road bridge over an irrigation canal have two semi circular vents each with a span of 20 m and the supporting pillars of width 2m. Use figure to write the equations that represent the semi verticular vents. by Maths experts to help you in doubts & scoring excellent marks in Class 12 exams.
Updated on:21/07/2023Topper's Solved these Questions
- TWO DIMENSIONAL ANALYTICAL GEOMETRY-IIBOOK - FULL MARKSCHAPTER - TWO DIMENSIONAL ANALYTICAL GEOMETRY-IIEXERCISE - EXERCISE 5.1
12 Videos
- TWO DIMENSIONAL ANALYTICAL GEOMETRY-IIBOOK - FULL MARKSCHAPTER - TWO DIMENSIONAL ANALYTICAL GEOMETRY-IIEXERCISE - EXERCISE 5.2
8 Videos
- THEORY OF EQUATIONS BOOK - FULL MARKSCHAPTER - THEORY OF EQUATIONS EXERCISE - Additional Questions Solved
30 Videos
Similar Questions
Obtain the equation of the circles with radius 5 cm and touching x-axis at the origin in general form.
View SolutionFind the equation of the parabola in each of the case given below :
(i) Focus ( 4,0) and direction x = -4.
(ii) passes through ( 2,-3) and symmetric about y-axis.
(iii) vertex ( 1,-2) and forus ( 4,-2)
(iv) end points of latus rectun ( 4,-8) and ( 4,8)
View SolutionConstruct a cubic equation with roots 2,3,4.
View SolutionHow many lines of symmetry does the above figure have ?
View SolutionDetermine the point of symmetry of a regular hexagon.
View SolutionDtermine the images of the following figure about the given line :
View SolutionMatch the following Column A to Column B

View SolutionMatch the following Column A to Column B

View SolutionMatch the following Column A to Column B

View SolutionFind the area of the figure given below.

View SolutionThe area of the shaded part in the figure given below is ______.

View SolutionThe inequation represented by the graph given below is :
View SolutionThe inequation that best describes the graph given below is _________
View SolutionThe inequation that best describes the following graph is _________
View SolutionWhich inequations represent the shaded region in the given figure
View Solution
