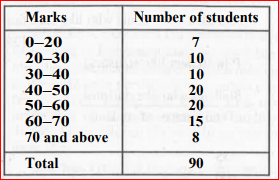
A teacher analyses the performance of two sections of students in a mathematics test of 100 marks given in the following table :
 : Find the probability that a student obtained less than 20% in the mathematics test.Solution in Punjabi
Step by step video & image solution for A teacher analyses the performance of two sections of students in a mathematics test of 100 marks given in the following table : : Find the probability that a student obtained less than 20% in the mathematics test. by Maths experts to help you in doubts & scoring excellent marks in Class 9 exams.
Updated on:21/07/2023Topper's Solved these Questions
Similar Questions
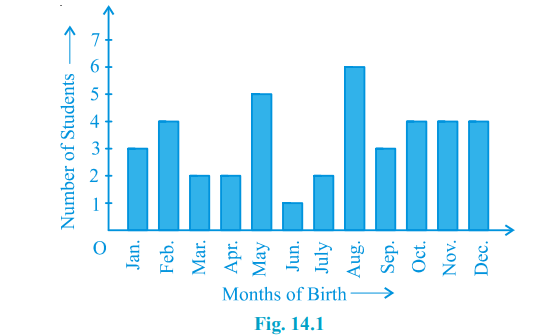
In a particular section of Class IX, 40 students were asked about the months of their birth and the following graph was prepared for the data so obtained:
 Observe the bar graph given above and answer the following questions:
(i) How many students were born in the month of November?
(ii) In which month were the maximum number of students born?
View SolutionShow that each angle of a rectangle is a right angle.
View SolutionMary wants to decorate her Christmas tree. She wants to place the tree on a wooden box covered with coloured paper with picture of Santa Claus on it (see Fig. 13.4). She must know the exact quantity of paper to buy for this purpose. If the box has length, breadth and height as 80 cm, 40 cm and 20 cm respectively how many square sheets of paper of side 40 cm would she require?
View SolutionDetermine the point of symmetry of a regular hexagon.
View SolutionDtermine the images of the following figure about the given line :
View SolutionMatch the following Column A to Column B

View SolutionMatch the following Column A to Column B

View SolutionMatch the following Column A to Column B

View SolutionFind the area of figure given below.

View SolutionFind the perimeter of the figure given below.

View SolutionFind the area of the figure given below.

View SolutionThe inequation represented by the graph given below is :
View SolutionThe inequation that best describes the graph given below is _________
View SolutionThe inequation that best describes the following graph is _________
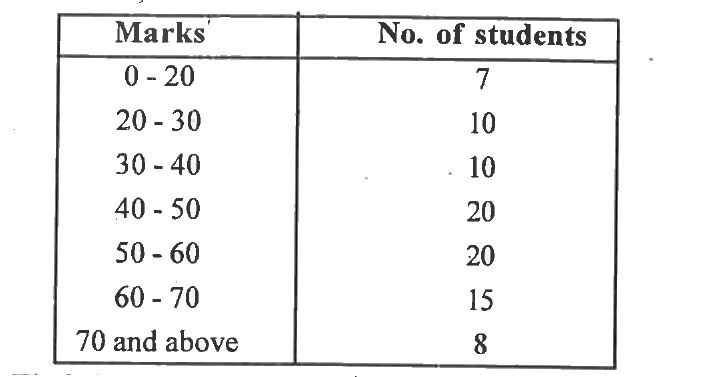
View SolutionA teacher analyses the performance of two sections of students in a mathematics test of 100 marks given in the following table.

Find the probability that a student obtained less than 20 in the mathematics test.
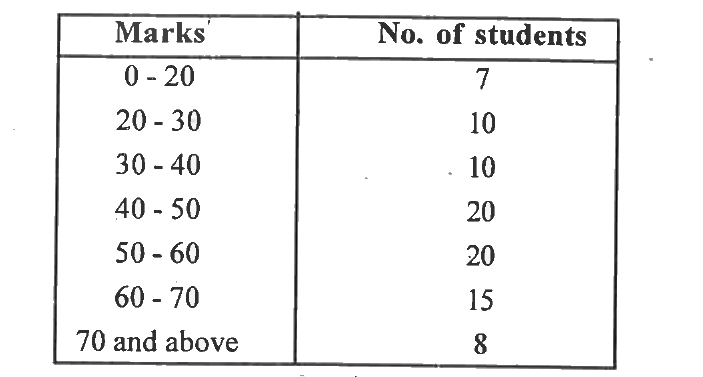
View SolutionA teacher analyses the performance of two sections of students in a mathematics test of 100 marks given in the following table.

Find the probability that a student obtained marks 60 or above.
View Solution
