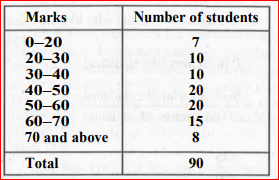
A teacher analyses the performance of two sections of students in a mathematics test of 100 marks given in the following table :
 : Find the probability that a student obtained 60 or aboveSolution in Punjabi
Step by step video & image solution for A teacher analyses the performance of two sections of students in a mathematics test of 100 marks given in the following table : : Find the probability that a student obtained 60 or above by Maths experts to help you in doubts & scoring excellent marks in Class 9 exams.
Updated on:21/07/2023Topper's Solved these Questions
Similar Questions
A coin is tossed 1000 times with the following frequencies of head and tail head : 455, tail : 545 compute the experimental probability for each type of outcome, i.e. head and tail.
View SolutionClassify the following as linear, quadratic and cubic polynomial : x2+x.
View SolutionIf diagonals of a quadrilateral bisect each other at right angles, then it is a :
View SolutionHow many lines of symmetry does the above figure have ?
View SolutionDetermine the point of symmetry of a regular hexagon.
View SolutionDtermine the images of the following figure about the given line :
View SolutionMatch the following Column A to Column B

View SolutionMatch the following Column A to Column B

View SolutionMatch the following Column A to Column B

View SolutionFind the area of figure given below.

View SolutionFind the perimeter of the figure given below.

View SolutionFind the area of the figure given below.

View SolutionThe inequation represented by the graph given below is :
View SolutionThe inequation that best describes the graph given below is _________
View SolutionThe inequation that best describes the following graph is _________
View SolutionWhich inequations represent the shaded region in the given figure
View Solution
