Bhavagna celebrates her birthday every year. The number of chocolates that she distributes every year is the greatest 3- digit common multiple of all the prime factors of the number representing that year. How many chocolates should bhavagna distribute in the year 2016 ?
The correct Answer is:966
To find out how many chocolates Bhavna should distribute in the year 2016, we need to follow these steps:
Step 1: Find the Prime Factors of 2016
To find the prime factors of 2016, we can start dividing by the smallest prime numbers.
1. Divide by 2:
- 2016 ÷ 2 = 1008
- 1008 ÷ 2 = 504
- 504 ÷ 2 = 252
- 252 ÷ 2 = 126
- 126 ÷ 2 = 63 (63 is not divisible by 2 anymore)
2. Divide by 3:
- 63 ÷ 3 = 21
- 21 ÷ 3 = 7 (7 is a prime number)
So, the prime factorization of 2016 is:
2016=25×32×71
The prime factors are 2, 3, and 7.
Step 2: Find the Least Common Multiple (LCM) of the Prime Factors
Next, we need to find the LCM of the prime factors 2, 3, and 7. Since they are all prime numbers, the LCM will be their product:
LCM=2×3×7=42
Step 3: Find the Greatest 3-Digit Multiple of 42
Now, we need to find the greatest 3-digit multiple of 42. The largest 3-digit number is 999.
1. Divide 999 by 42:
- 999 ÷ 42 ≈ 23.7857 (take the integer part, which is 23)
2. Multiply back to find the greatest multiple:
- 42 × 23 = 966
Thus, the greatest 3-digit multiple of 42 is 966.
Conclusion
Therefore, Bhavna should distribute 966 chocolates in the year 2016.
---
To find the prime factors of 2016, we can start dividing by the smallest prime numbers.
- 2016 ÷ 2 = 1008
- 1008 ÷ 2 = 504
- 504 ÷ 2 = 252
- 252 ÷ 2 = 126
- 126 ÷ 2 = 63 (63 is not divisible by 2 anymore)
- 63 ÷ 3 = 21
- 21 ÷ 3 = 7 (7 is a prime number)
2016=25×32×71
The prime factors are 2, 3, and 7.
Next, we need to find the LCM of the prime factors 2, 3, and 7. Since they are all prime numbers, the LCM will be their product:
LCM=2×3×7=42
Now, we need to find the greatest 3-digit multiple of 42. The largest 3-digit number is 999.
- 999 ÷ 42 ≈ 23.7857 (take the integer part, which is 23)
- 42 × 23 = 966
Therefore, Bhavna should distribute 966 chocolates in the year 2016.
Topper's Solved these Questions
- FACTORS AND MULTIPLES BOOK - PEARSON IIT JEE FOUNDATIONCHAPTER - FACTORS AND MULTIPLES EXERCISE - Concept Application
5 Videos
- FACTORS AND MULTIPLES BOOK - PEARSON IIT JEE FOUNDATIONCHAPTER - FACTORS AND MULTIPLES EXERCISE - Assessment Test
15 Videos
- FACTORS AND MULTIPLES BOOK - PEARSON IIT JEE FOUNDATIONCHAPTER - FACTORS AND MULTIPLES EXERCISE - Test Your Concepts ( Match the Column ) :
1 Videos
- ALGEBRABOOK - PEARSON IIT JEE FOUNDATIONCHAPTER - ALGEBRAEXERCISE - CROSSWORD
1 Videos
- FRACTIONS AND DECIMALS BOOK - PEARSON IIT JEE FOUNDATIONCHAPTER - FRACTIONS AND DECIMALS EXERCISE - Crossword
1 Videos
Similar Questions
There are 'a' trecs in the village Lat. If the number of trees increases every year by ch, then how many trees will there be after ‘x' years?
View SolutionA hybrid mango tree, whose life span is 10 years starts giving fruits from the first year onwards. In the nth year it produces 11n raw mangoes. But during the first half of the tree's life, every year,a certain number, which is constant, fail to ripen into fruits. During the second half of the trees life, every year,the number of raw fruits that fail to ripen is half the corresponding number in the first half of the tree's life. In the fourth year of the tree life, it produces 36 ripe mangoes. How many man-goes ripen during the 9th year of the tree's life?
View Solution
Knowledge Check
On 14th November, in my school, each child received as many packs of chocolates as there were total number of the students in the school. Further, each pack of chocolates contains as many chocolates as there were the total number of packs which a child had. Total how many chocolates have been distributed among all the children of school .
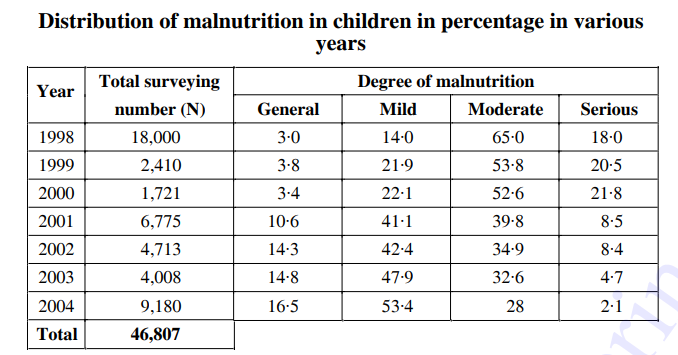
A729B196C961Dcan't be determinedThe following questions depends on the table given below-
Distribution of malnutrition in children in percentage in various
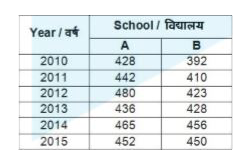
How many percent approximately was mild malnutrition in all the years together?A30B32C42D46The table given below shows the number of students who have taken admission in school A and B from the years 2010 to 2015.

Across all the years, for how many years, the number of students in school A was less than the average number of students in school B?A0B1C2D3
On her birthday Reena distributed chocolates in an orphanage. The total number of chocolates she distributed is given (5+√11)(5−√11).
(i) Find the number of chocolates distributed by her.
(ii) Write the moral valuers depicted here by Reema.
View SolutionThere are 'a' tress in the village. If the number of trees, increase by 'b' every year, then how many tress will be there after 'x' years.
View SolutionUse the given letter to write the answer. There are 'a' trees in the village Last Year. If the number of trees increases every year by 'b' then how many trees will there be after 'x' years ?
View SolutionThe bar graph given here shows the number of jobseekers of a state in various years at different stages of education.
Study the graph carefully and answer the question based on it.

In comaprison to the year 1973, how many more job-seekers in all, were there in the year 1977?
View SolutionReena bought chocolates to distribute among her friends on her 18th birthday. If she gives 3 chocolates to each friend, one friend will get only 2 chocolates. Also, if she gives 2 chocolates to each friend, she will be left with 15 chocolates. How many chocolates did she buy? (a) 44 (b) 47 (c) 50 (d) None of these
View Solution
