Calculate 4- yearly moving averages of the following time series of steel production :

Plot these and the original figures in the same graph.
The correct Answer is:Trend values are : 719 , 738.75,758.25,776.38,793.88,812.88,831.63
Step by step video & image solution for Calculate 4- yearly moving averages of the following time series of steel production : Plot these and the original figures in the same graph. by Maths experts to help you in doubts & scoring excellent marks in Class 11 exams.
Updated on:21/07/2023Topper's Solved these Questions
Similar Questions
Calculate the 5 yearly moving averages of the following time series of steel production

View SolutionCalculate the three -yearly moving averages and display these and the original figures on the same graph.
Year 2001200220032004200520062007Values 20 40 50 70 80 100 130
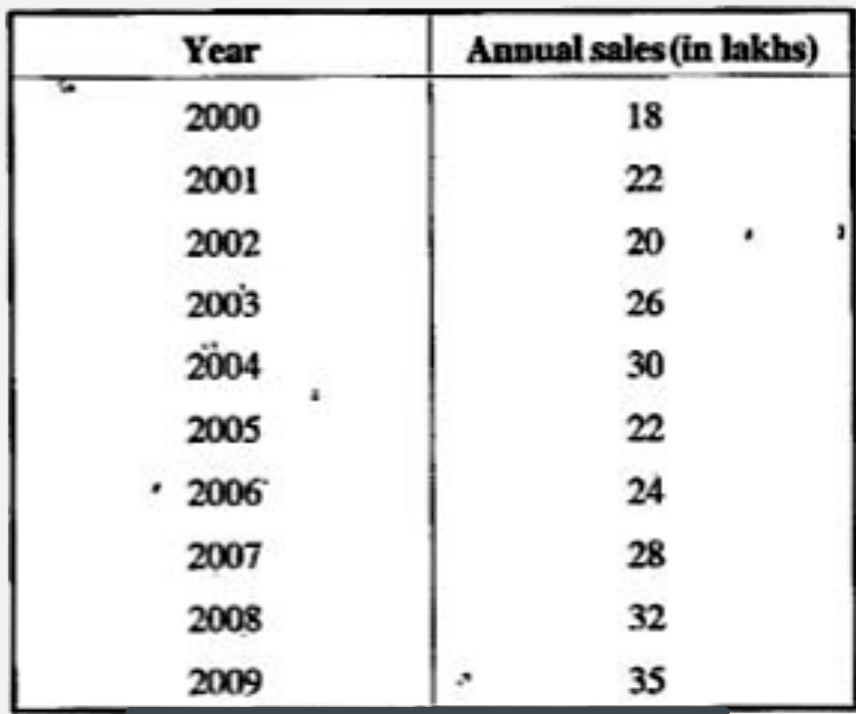
View SolutionConstruct 3 yearly moving averages from the following data and show on a graph against the original data:

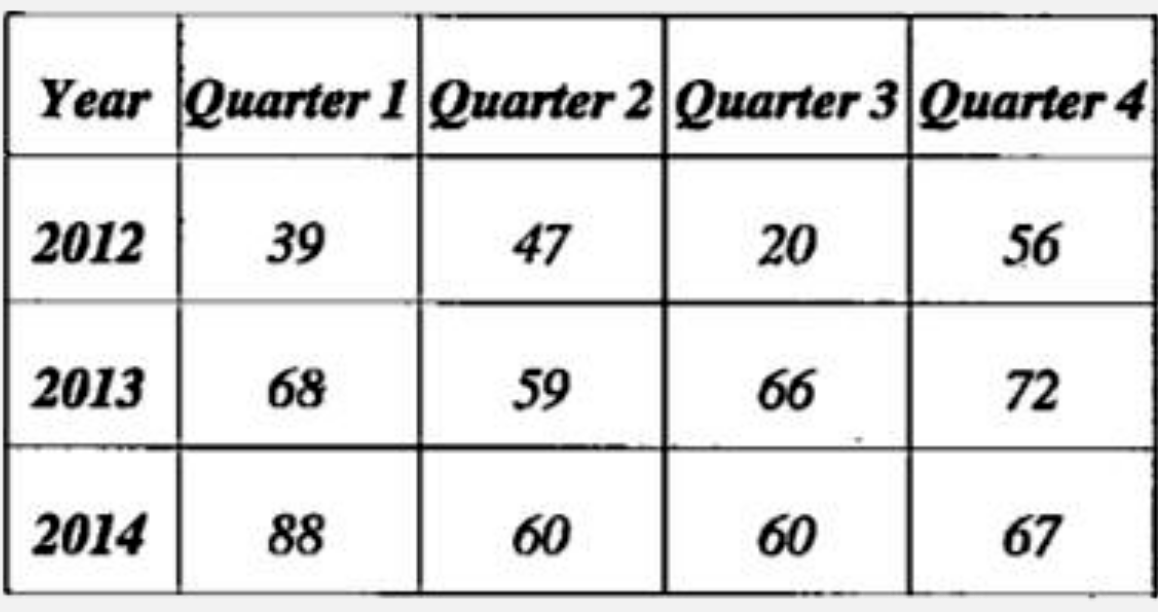
View SolutionThe table below gives details of the electricity generated in kilowatt hours in each quarter for the years 2012 to 2014

Calculate the four-quarterly moving averages and display these and the original figures on the same graph .
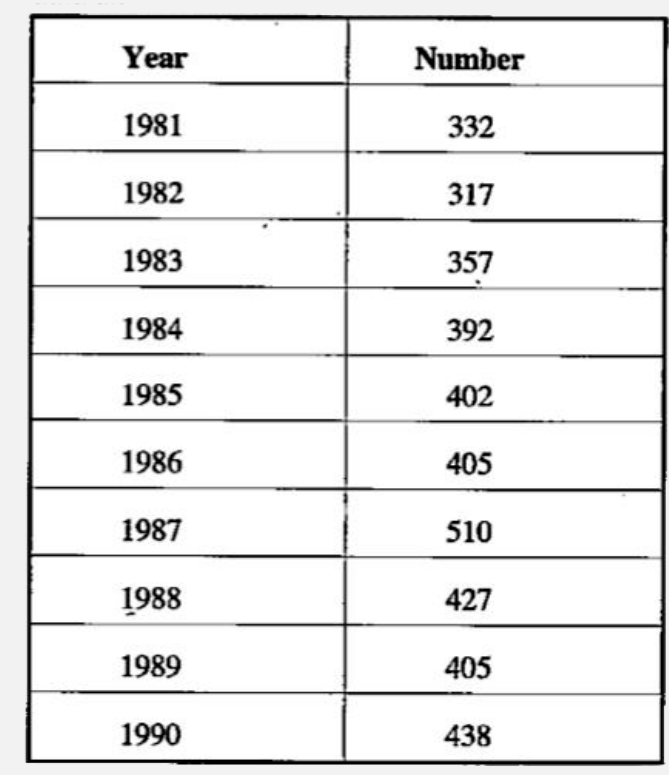
View SolutionCalculate the 5 yearly moving averages of the number of students in a College from the following data and plot them on a graph paper :

View SolutionCalculate five yearly moving average of the number of students of who have studied in a school given below.

View SolutionCalculate 5 - yearly weighted moving averages for the data with weights 1,2,2,2,1

View SolutionThe quarterly profits of a small scale industry (in thousands of rupees) is as follows:

Calculate four quarterly moving averages. Display these and the original figures graphically on the same graphs sheet.
View SolutionIn a typhoid epidemic ,the number of cases diagnosed were as follows. Calculate 6 days moving average and display them and the original figures on the same graph.

View SolutionPlot the following points on the same graph paper:
(0,4)
View Solution
