Consider the following population and year graph, find the slope of the line AB and using it, find what will be the population in the year 2010?
Step by step video & image solution for Consider the following population and year graph, find the slope of the line AB and using it, find what will be the population in the year 2010? by Maths experts to help you in doubts & scoring excellent marks in Class 11 exams.
Updated on:21/07/2023Topper's Solved these Questions
- STRAIGHT LINES BOOK - MODERN PUBLICATIONCHAPTER - STRAIGHT LINES EXERCISE - Exercise 10.2
20 Videos
- STRAIGHT LINES BOOK - MODERN PUBLICATIONCHAPTER - STRAIGHT LINES EXERCISE - Exercise 10.3
18 Videos
- STRAIGHT LINES BOOK - MODERN PUBLICATIONCHAPTER - STRAIGHT LINES EXERCISE - OBJECTIVE TYPE QUESTIONS (D . Very short answer type questions)
25 Videos
- STATISTICSBOOK - MODERN PUBLICATIONCHAPTER - STATISTICSEXERCISE - Chapter Test
7 Videos
- TRIGONOMETRYBOOK - MODERN PUBLICATIONCHAPTER - TRIGONOMETRYEXERCISE - Chapter Test (3)
12 Videos
Similar Questions
Knowledge Check
The population of a city at present is 80000. If it increase by 5% per year, what will be the population after 3 years?
A88200B84000C92610D86610The population of cattle in a farm increases so that the difference between the populationin year n + 2 and that in year n is proportional to the population in year n + 1. If the populations in years 2010, 2011 and 2013 were 39, 60 and 123, respectively, then the population in 2012 was-
A81B84C87D90

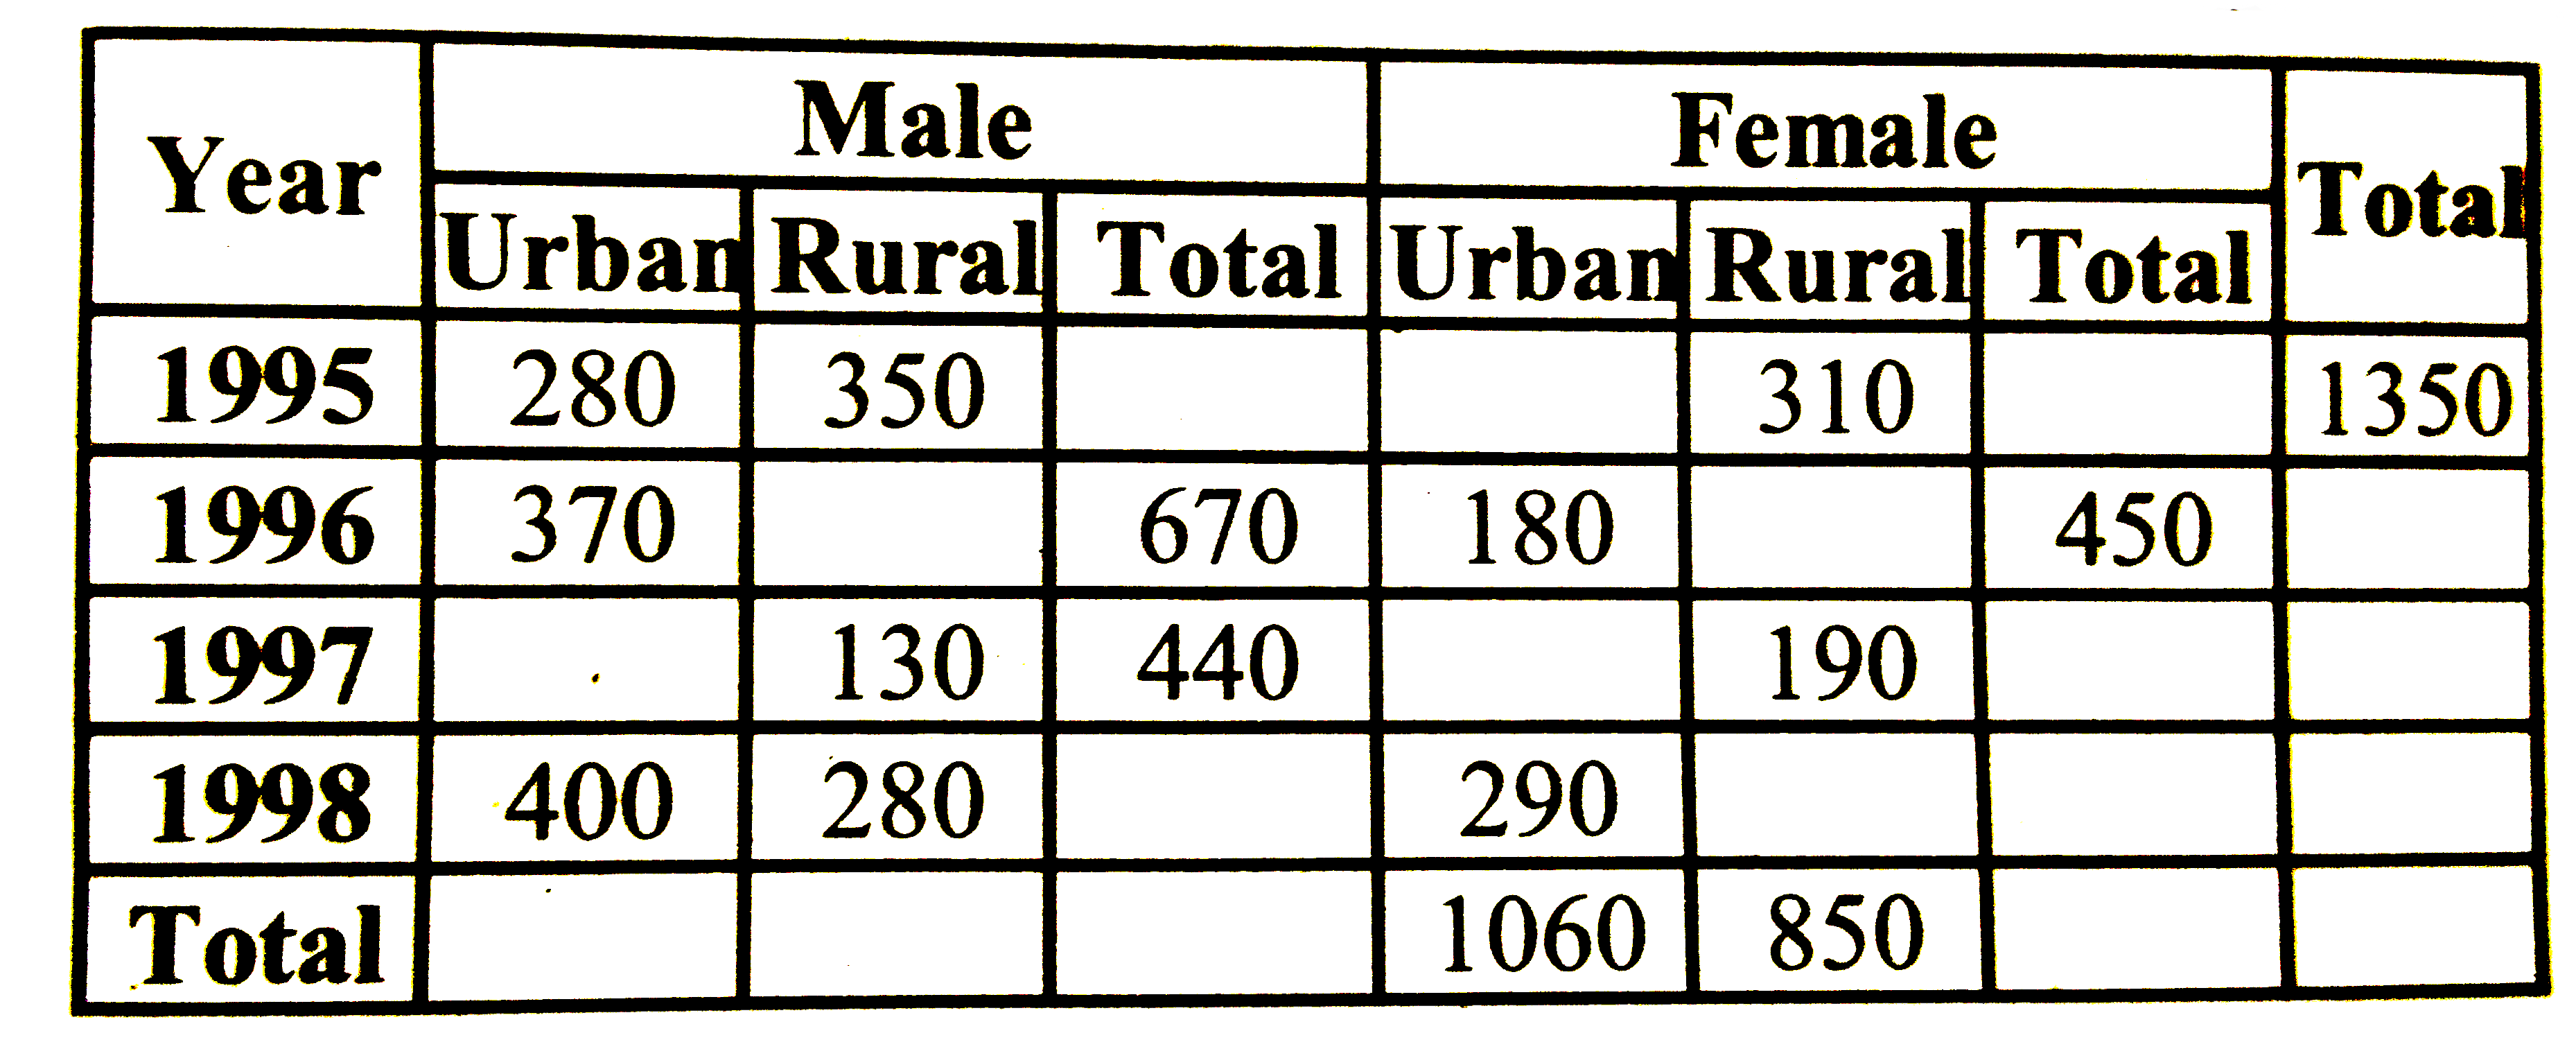
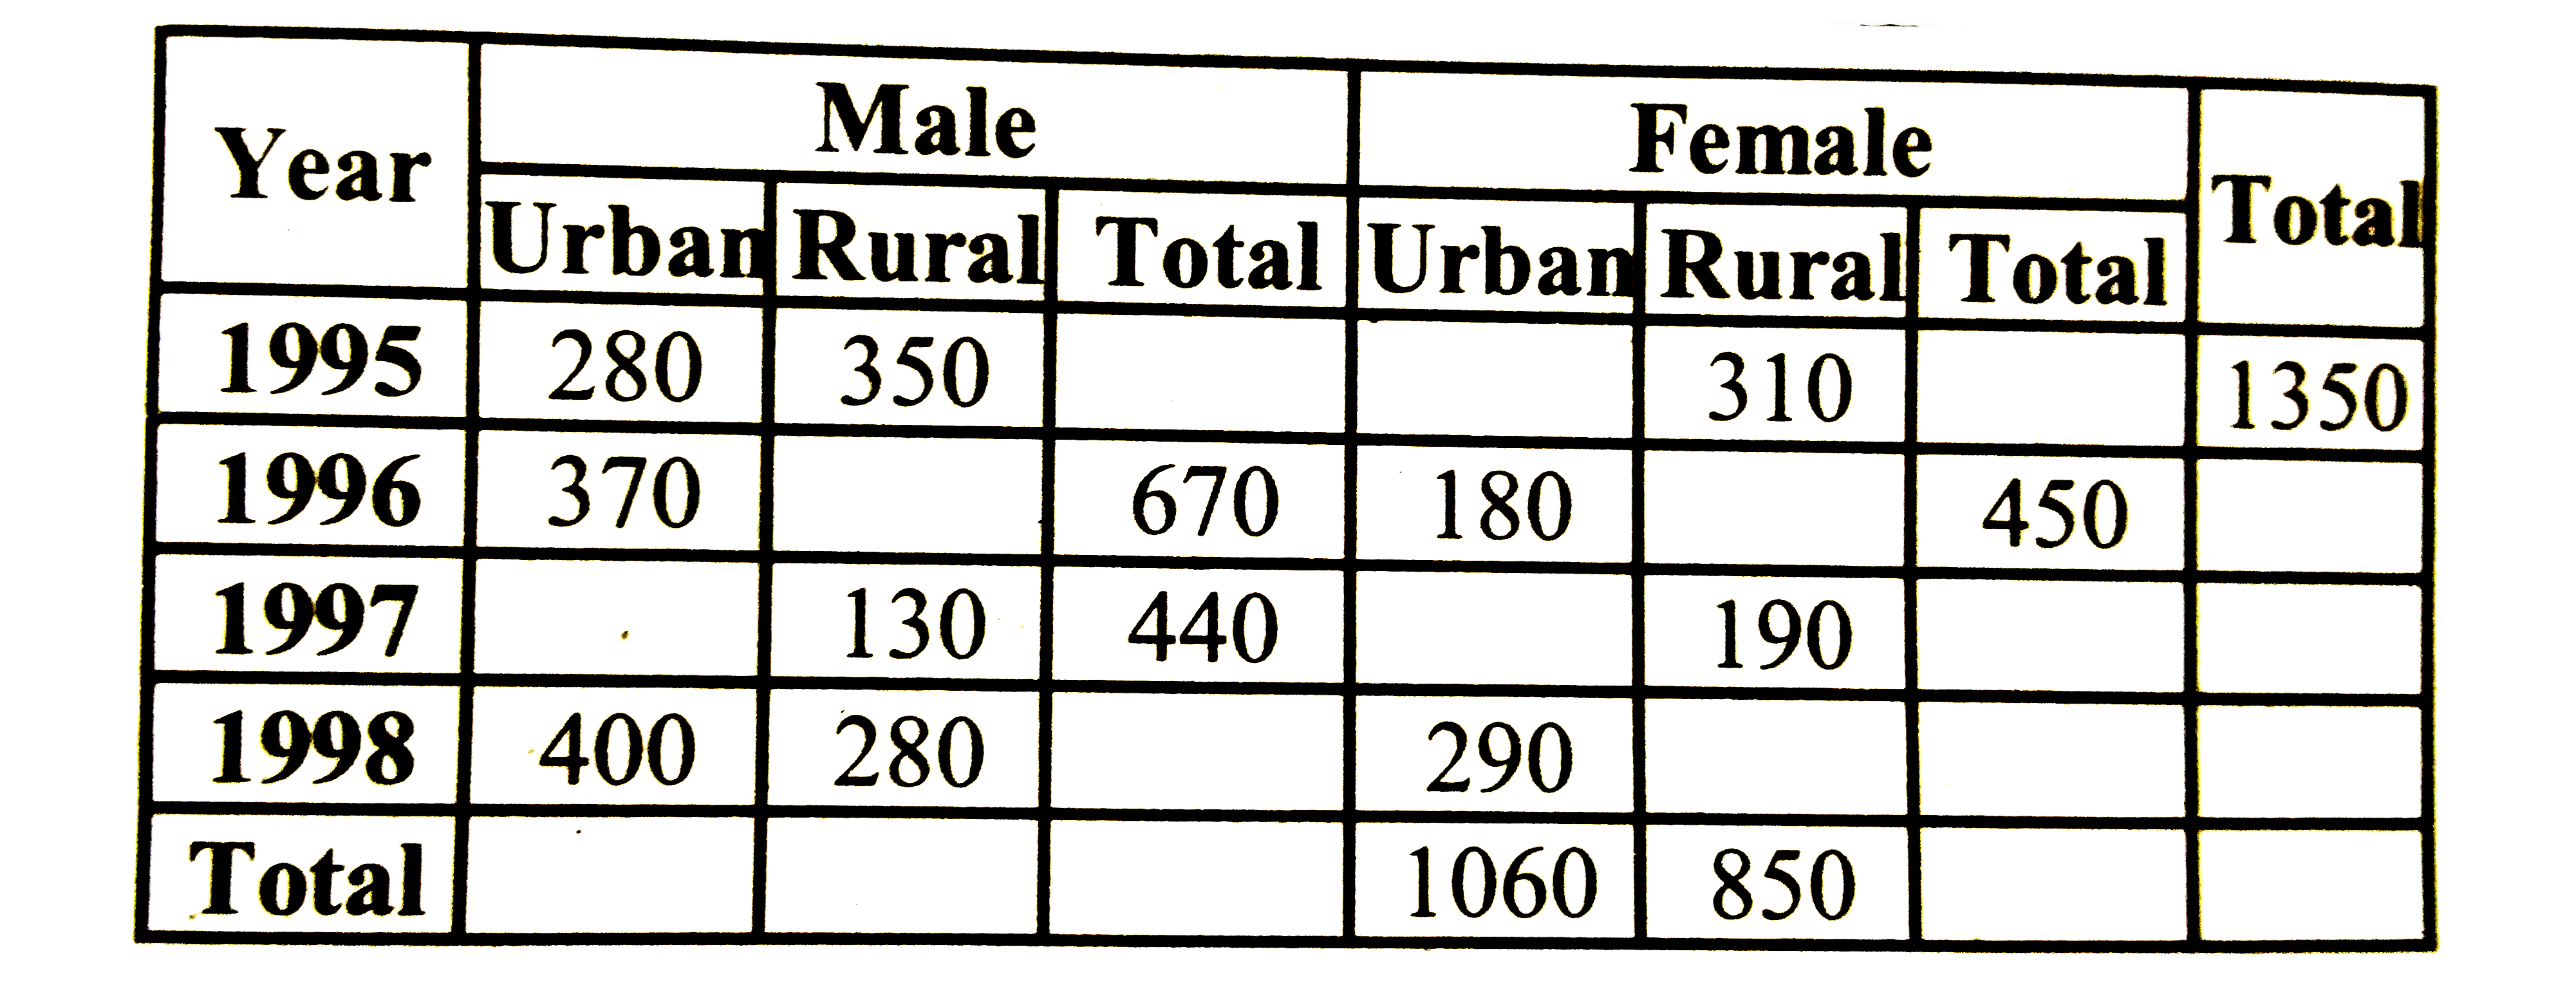
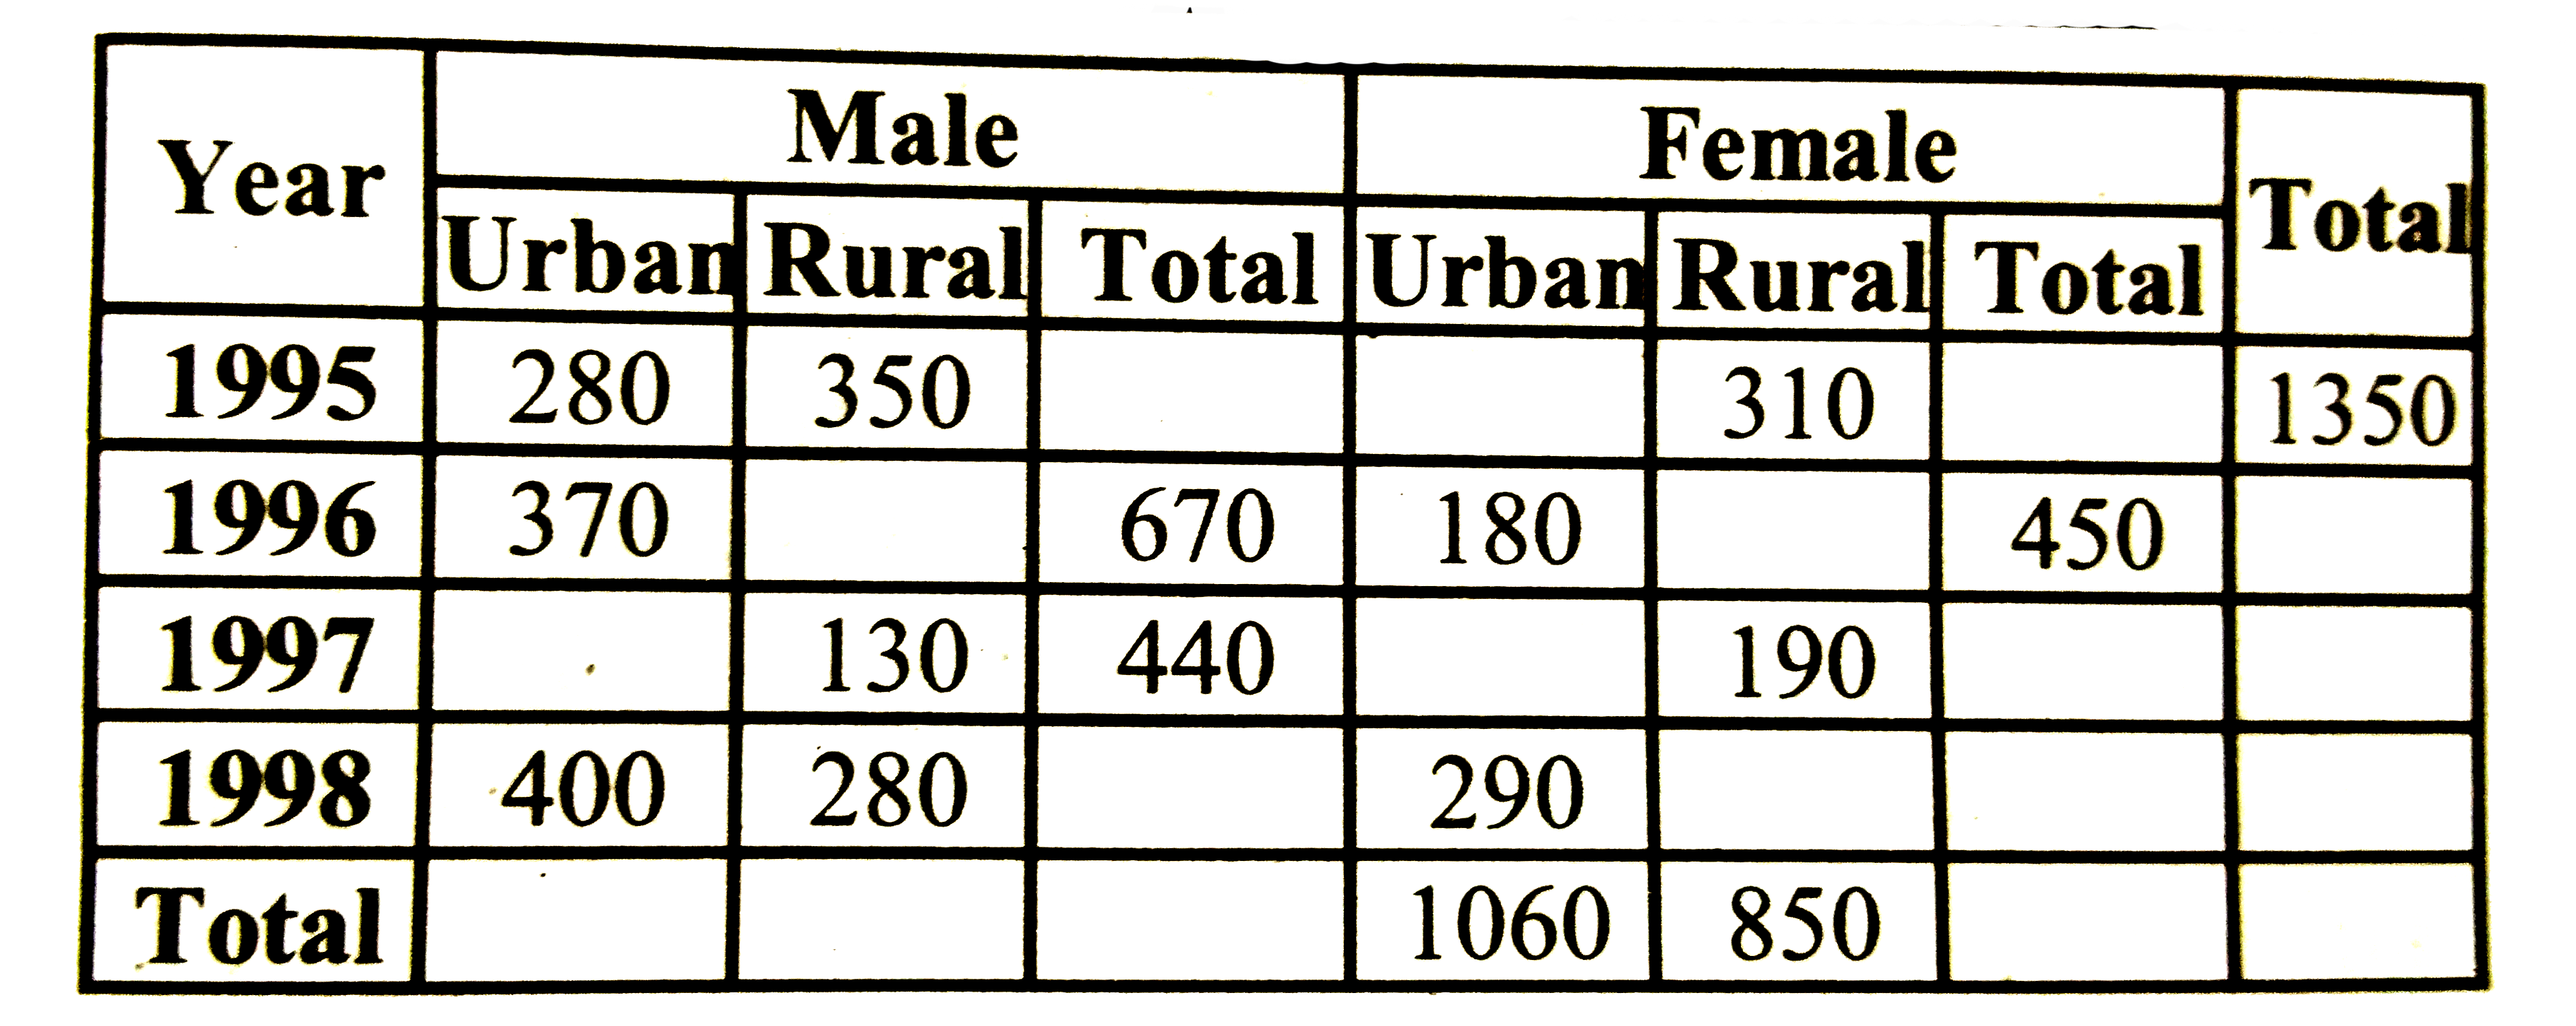
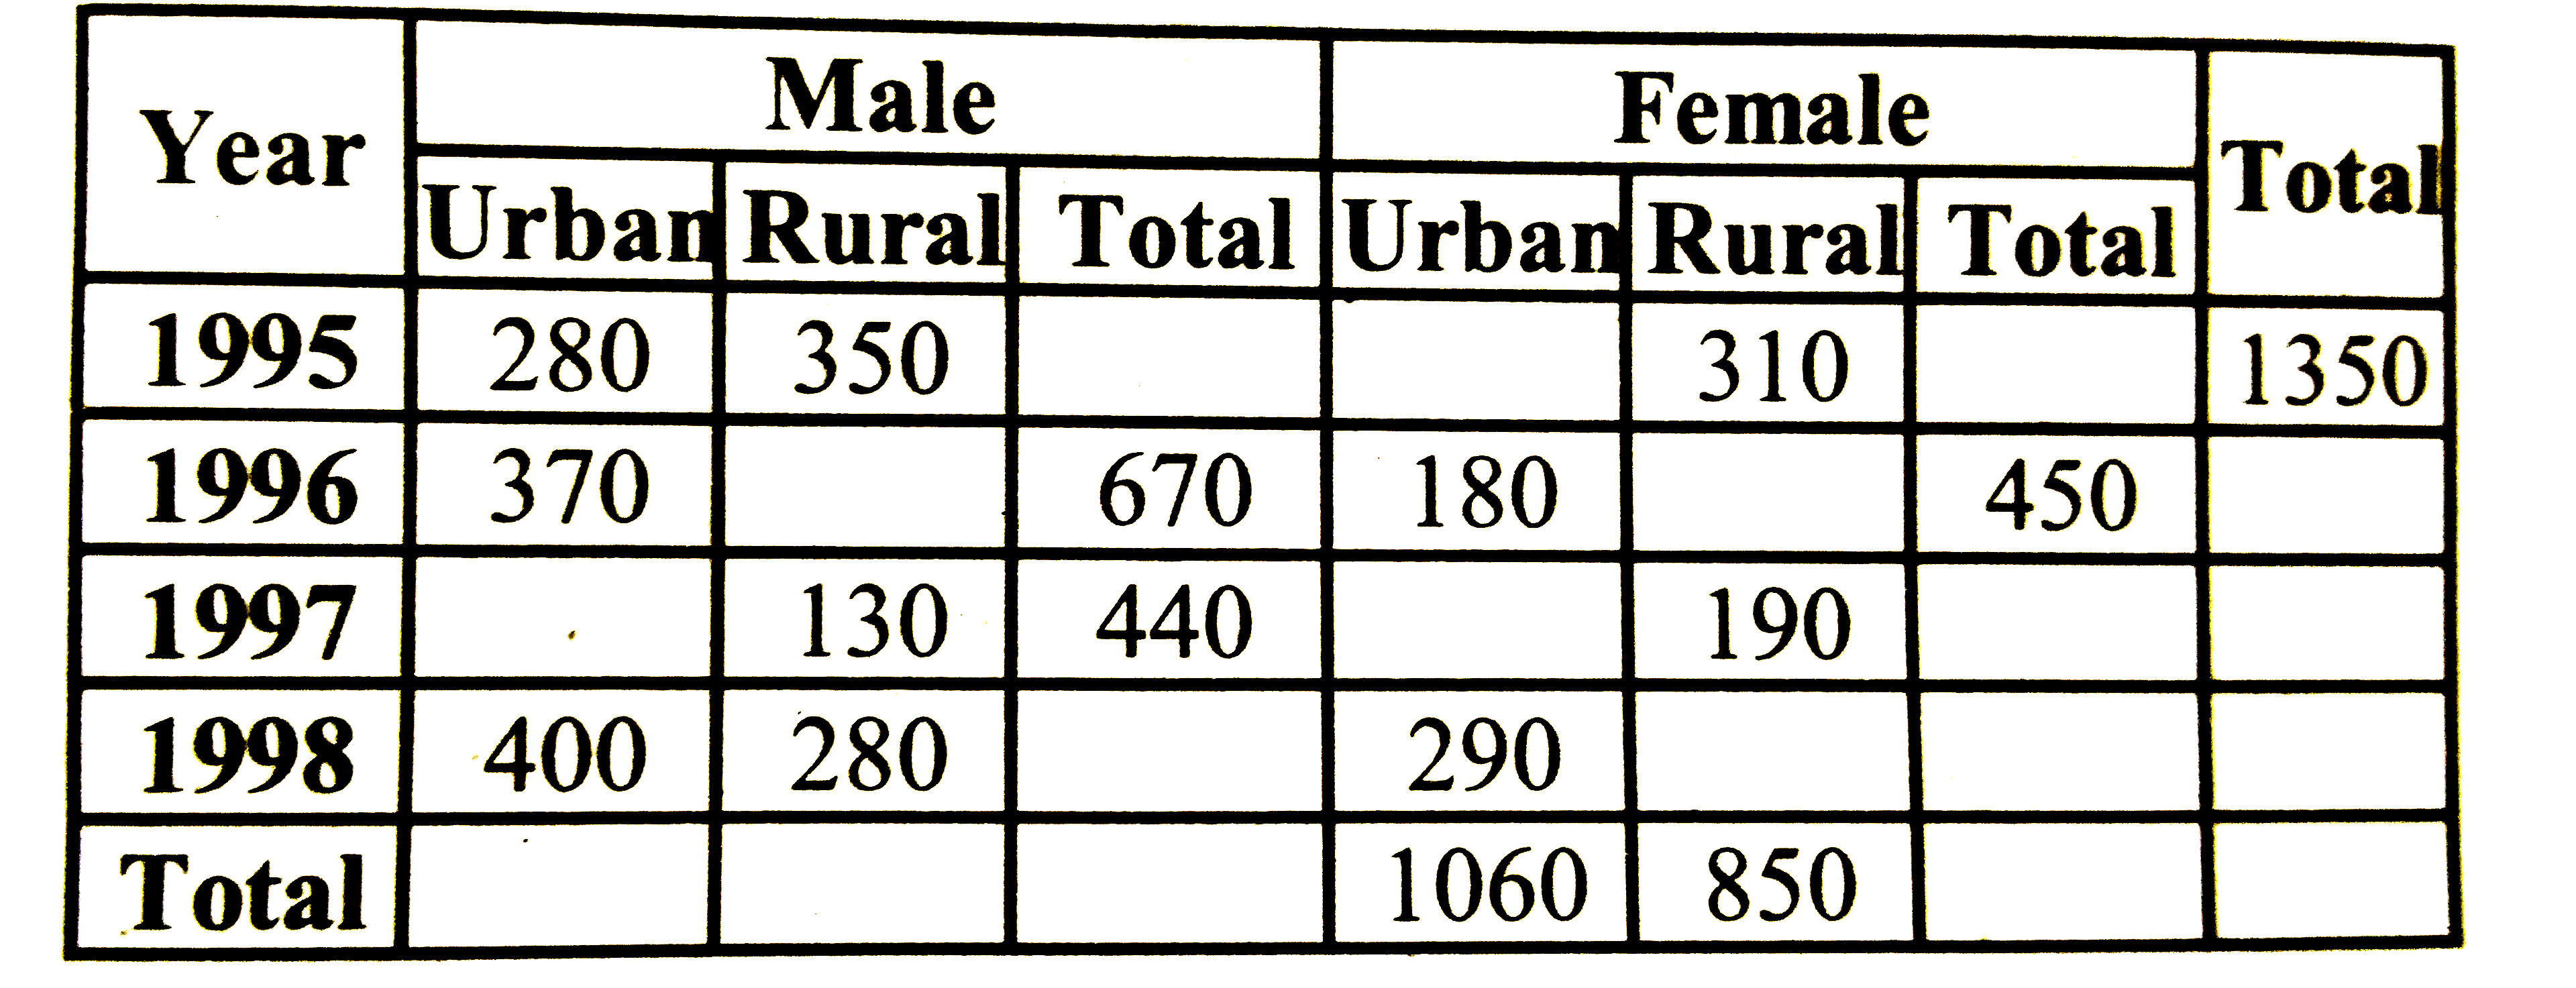
What is the total population for the year 1997?
View Solution
What is the female urban population in the year 1995?
View SolutionThe annual increase in the population of a town is 10%. If the present population of the town is 180000, then what will be its population after two years ?
View SolutionThe population of a town increases at a rate proportional to the population at that time . If the population increases from 40 thousands to 60 thousands in 40 years, What will be the population in another 20 years ? = [ Given: √32=1.2247 ]
View SolutionThe population of a city was 20,000 in the year 1997. It increased at the rate of 5% p.a. Find the population at the end of the year 2000.
View SolutionThe population of a city increases each year by 10%. If the present population of the city is 12000 , then what would be the population after 2 years?
View Solution


