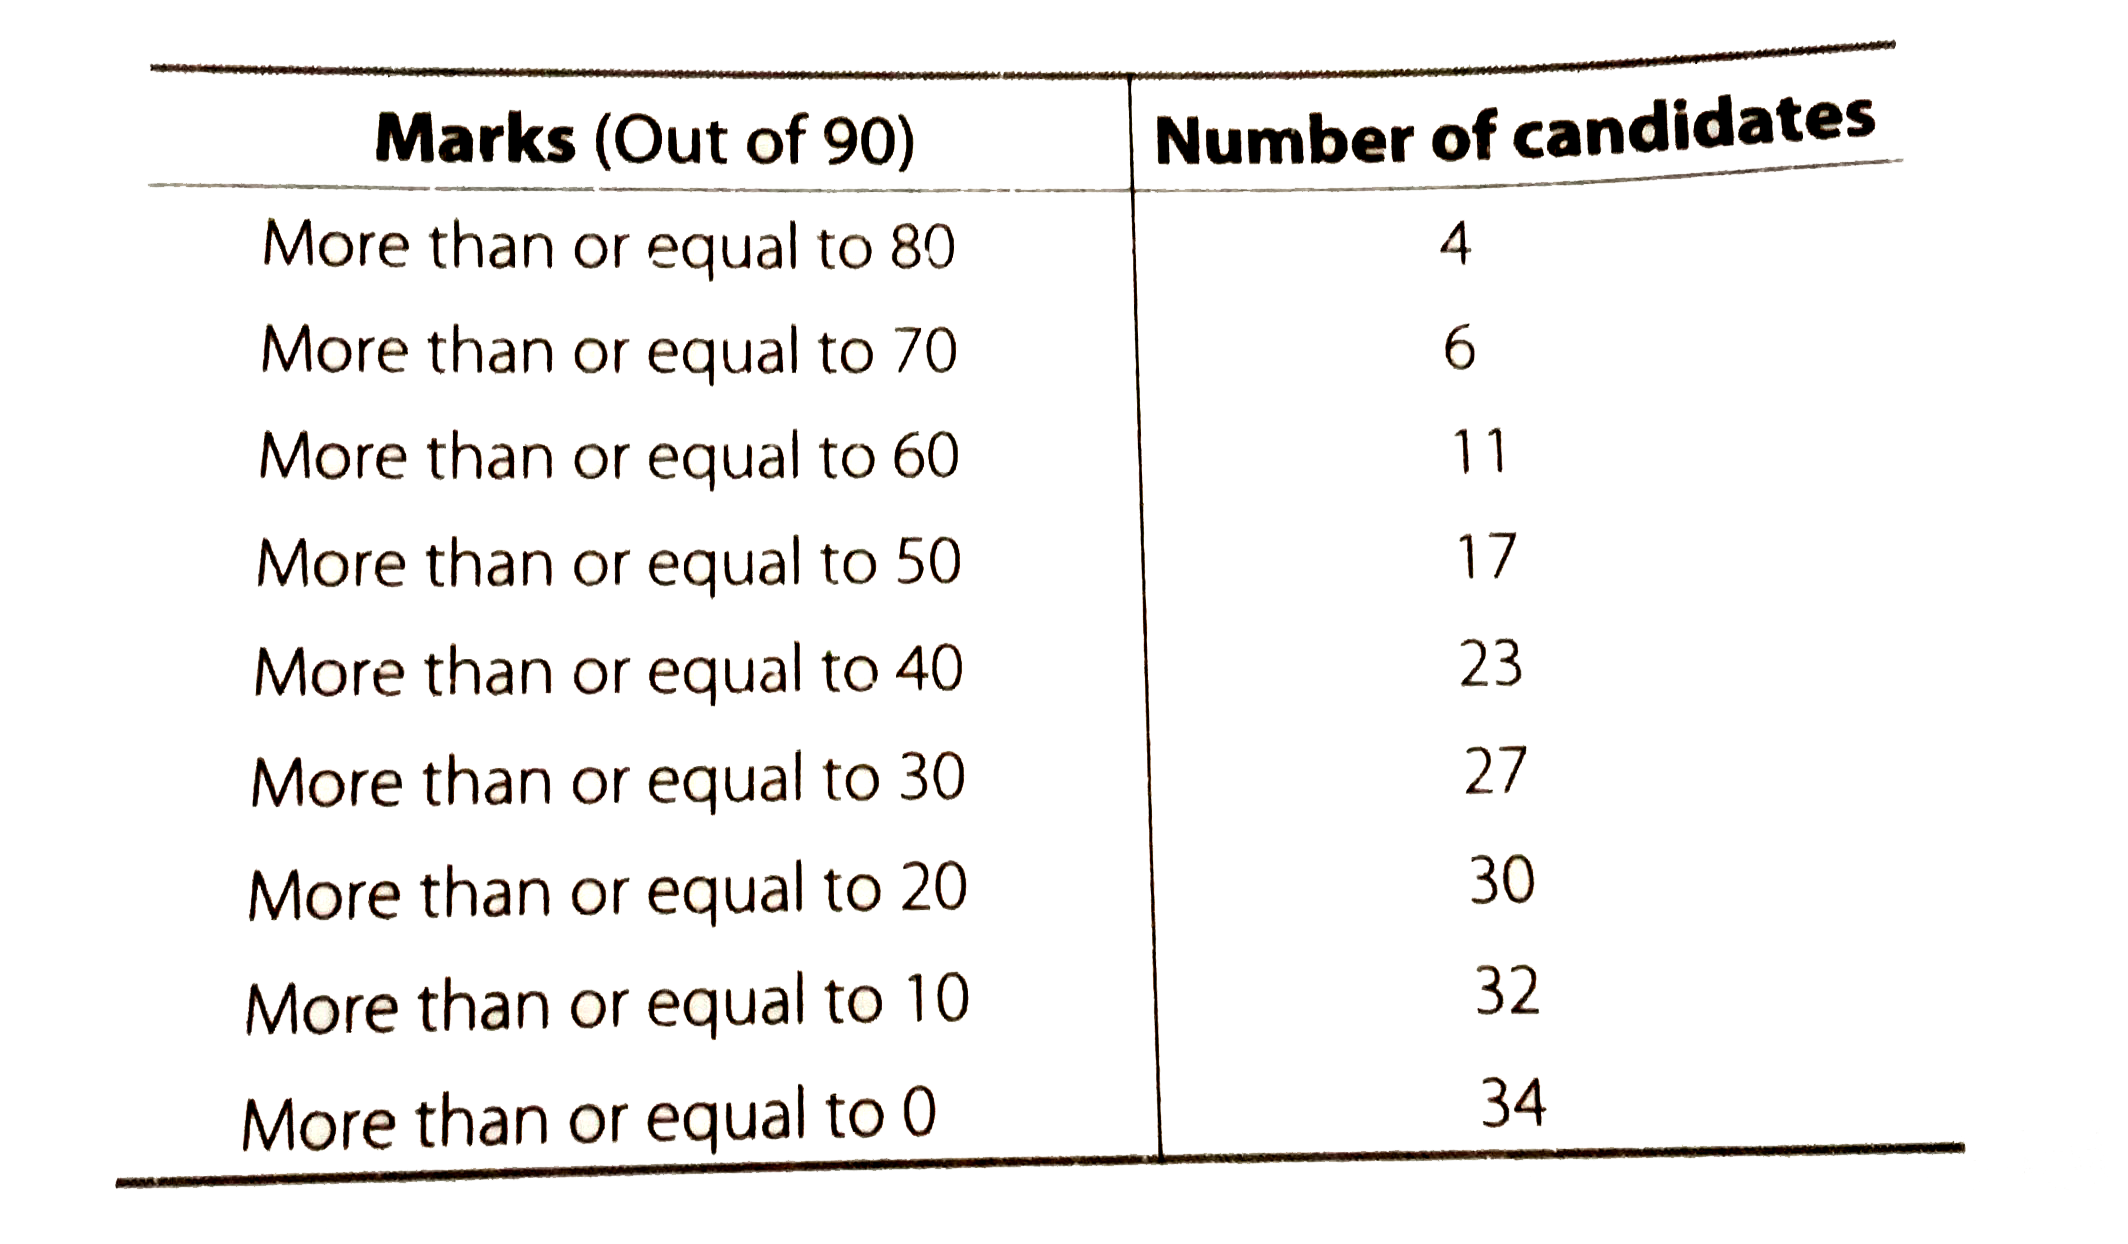
Cumulative Frequency Distribution
To solve the problem of creating a cumulative frequency distribution, we will follow these steps:
Step 1: Identify the Data
We have the following data:
- Values of x: 1, 2, 3, 4
- Corresponding frequencies (f): 60, 40, 30, 20
Step 2: Create a Table
We will create a table to organize the data. The table will have three columns: the class intervals (x), the frequencies (f), and the cumulative frequencies (cf).
| x | f | cf |
|---|----|-----|
| 1 | 60 | |
| 2 | 40 | |
| 3 | 30 | |
| 4 | 20 | |
Step 3: Calculate Cumulative Frequency
Now, we will calculate the cumulative frequency (cf) for each class:
- For the first class (x = 1):
- cf = f(1) = 60
- For the second class (x = 2):
- cf = f(1) + f(2) = 60 + 40 = 100
- For the third class (x = 3):
- cf = f(1) + f(2) + f(3) = 60 + 40 + 30 = 130
- For the fourth class (x = 4):
- cf = f(1) + f(2) + f(3) + f(4) = 60 + 40 + 30 + 20 = 150
Step 4: Complete the Table
Now we can fill in the cumulative frequency values in the table:
| x | f | cf |
|---|----|-----|
| 1 | 60 | 60 |
| 2 | 40 | 100 |
| 3 | 30 | 130 |
| 4 | 20 | 150 |
Step 5: Conclusion
The cumulative frequency distribution is now complete. The last value of the cumulative frequency (150) represents the total frequency of all classes.
---
We have the following data:
- Values of x: 1, 2, 3, 4
- Corresponding frequencies (f): 60, 40, 30, 20
We will create a table to organize the data. The table will have three columns: the class intervals (x), the frequencies (f), and the cumulative frequencies (cf).
|---|----|-----|
| 1 | 60 | |
| 2 | 40 | |
| 3 | 30 | |
| 4 | 20 | |
Now, we will calculate the cumulative frequency (cf) for each class:
- cf = f(1) = 60
- cf = f(1) + f(2) = 60 + 40 = 100
- cf = f(1) + f(2) + f(3) = 60 + 40 + 30 = 130
- cf = f(1) + f(2) + f(3) + f(4) = 60 + 40 + 30 + 20 = 150
Now we can fill in the cumulative frequency values in the table:
|---|----|-----|
| 1 | 60 | 60 |
| 2 | 40 | 100 |
| 3 | 30 | 130 |
| 4 | 20 | 150 |
The cumulative frequency distribution is now complete. The last value of the cumulative frequency (150) represents the total frequency of all classes.
Topper's Solved these Questions
Similar Questions
Define the following terms: (i) Observations (ii) Raw data (iii) Frequency of an observation (iv) Frequency distribution (v) Discrete frequency distribution (vi) Grouped frequency distribution (vii) class-interval (viii) Class-size (ix) Class limits (x) True class limits
View SolutionDefine the following terms: (i)Observations (ii) data (iii) Frequency of an observation (iv) Frequency distribution
View Solution
Knowledge Check
If the median and mean of moderately asymmetrical frequency distribution are 72 and 74 respectively, then the mode is
A68B76C75D70
The median of a given frequency distribution is found graphically with the help of (a) Histogram (b) Frequency curve (c) Frequency polygon (d) Ogive
View SolutionDefine the following terms: (i) Observations (ii) data (iii) Frequency of an observation (iv)Frequency distribution
View SolutionFrom the frequency distribution table from the following data

View SolutionGiven below is the frequency distribution of the heights of playces in a school :

Find the modal height
View SolutionDraw a cumulative frequency curve and cumulative frequency polygon for the following frequency distribution by less than method. Age (in yrs). 0-9 10-19 20-29 30-39 40-49 50-59 60-69 No. of Person 5 15 20 23 17 11 9
View SolutionConstruct a frequency distribution table for each of the following distributions
Marks (more than) 0102030405060708090100 Cumulative Frequency 100876555423631211870
View SolutionConstruct a frequency distribution table for each of the following distributions
Marks (less than) 0102030405060708090100 Cumulative Frequency 0728547184105147180196200
View Solution
