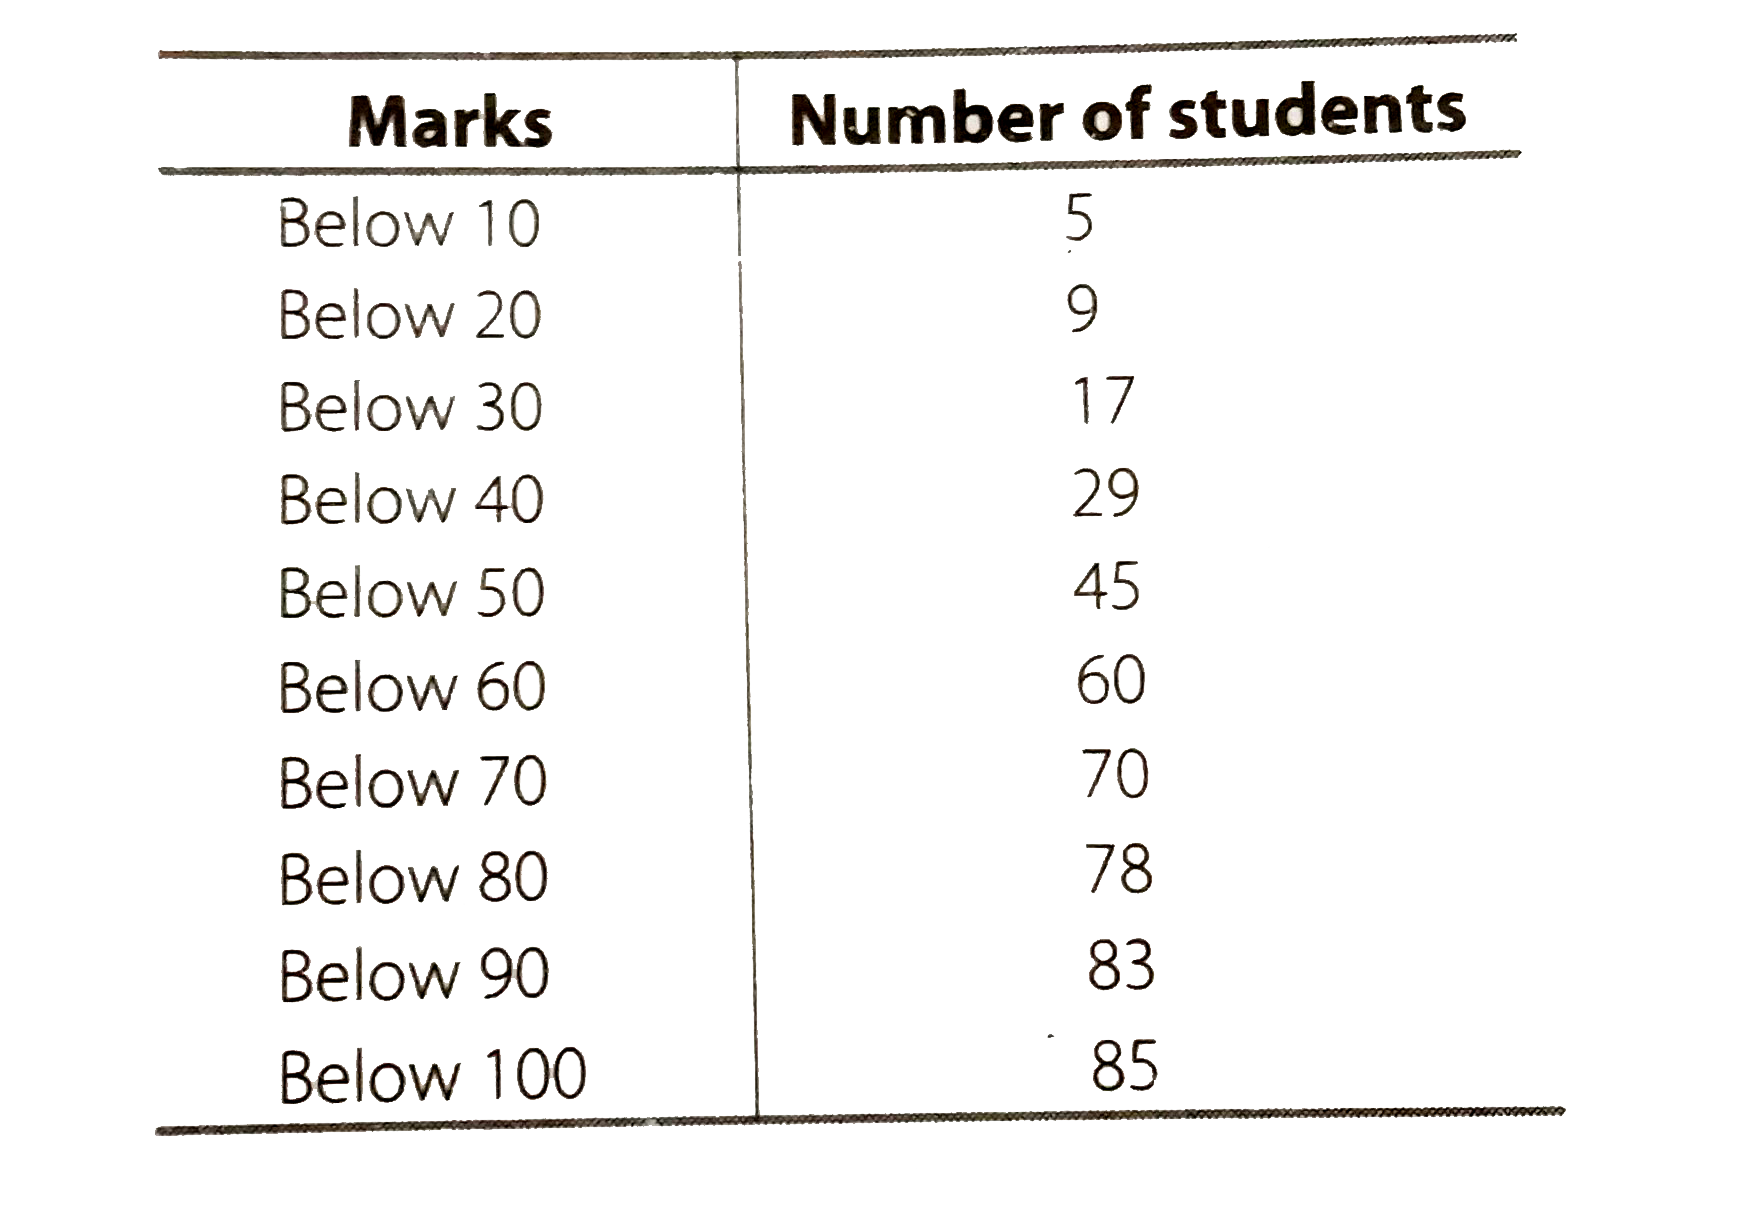
Determine the mean of the following distribution

Text Solution
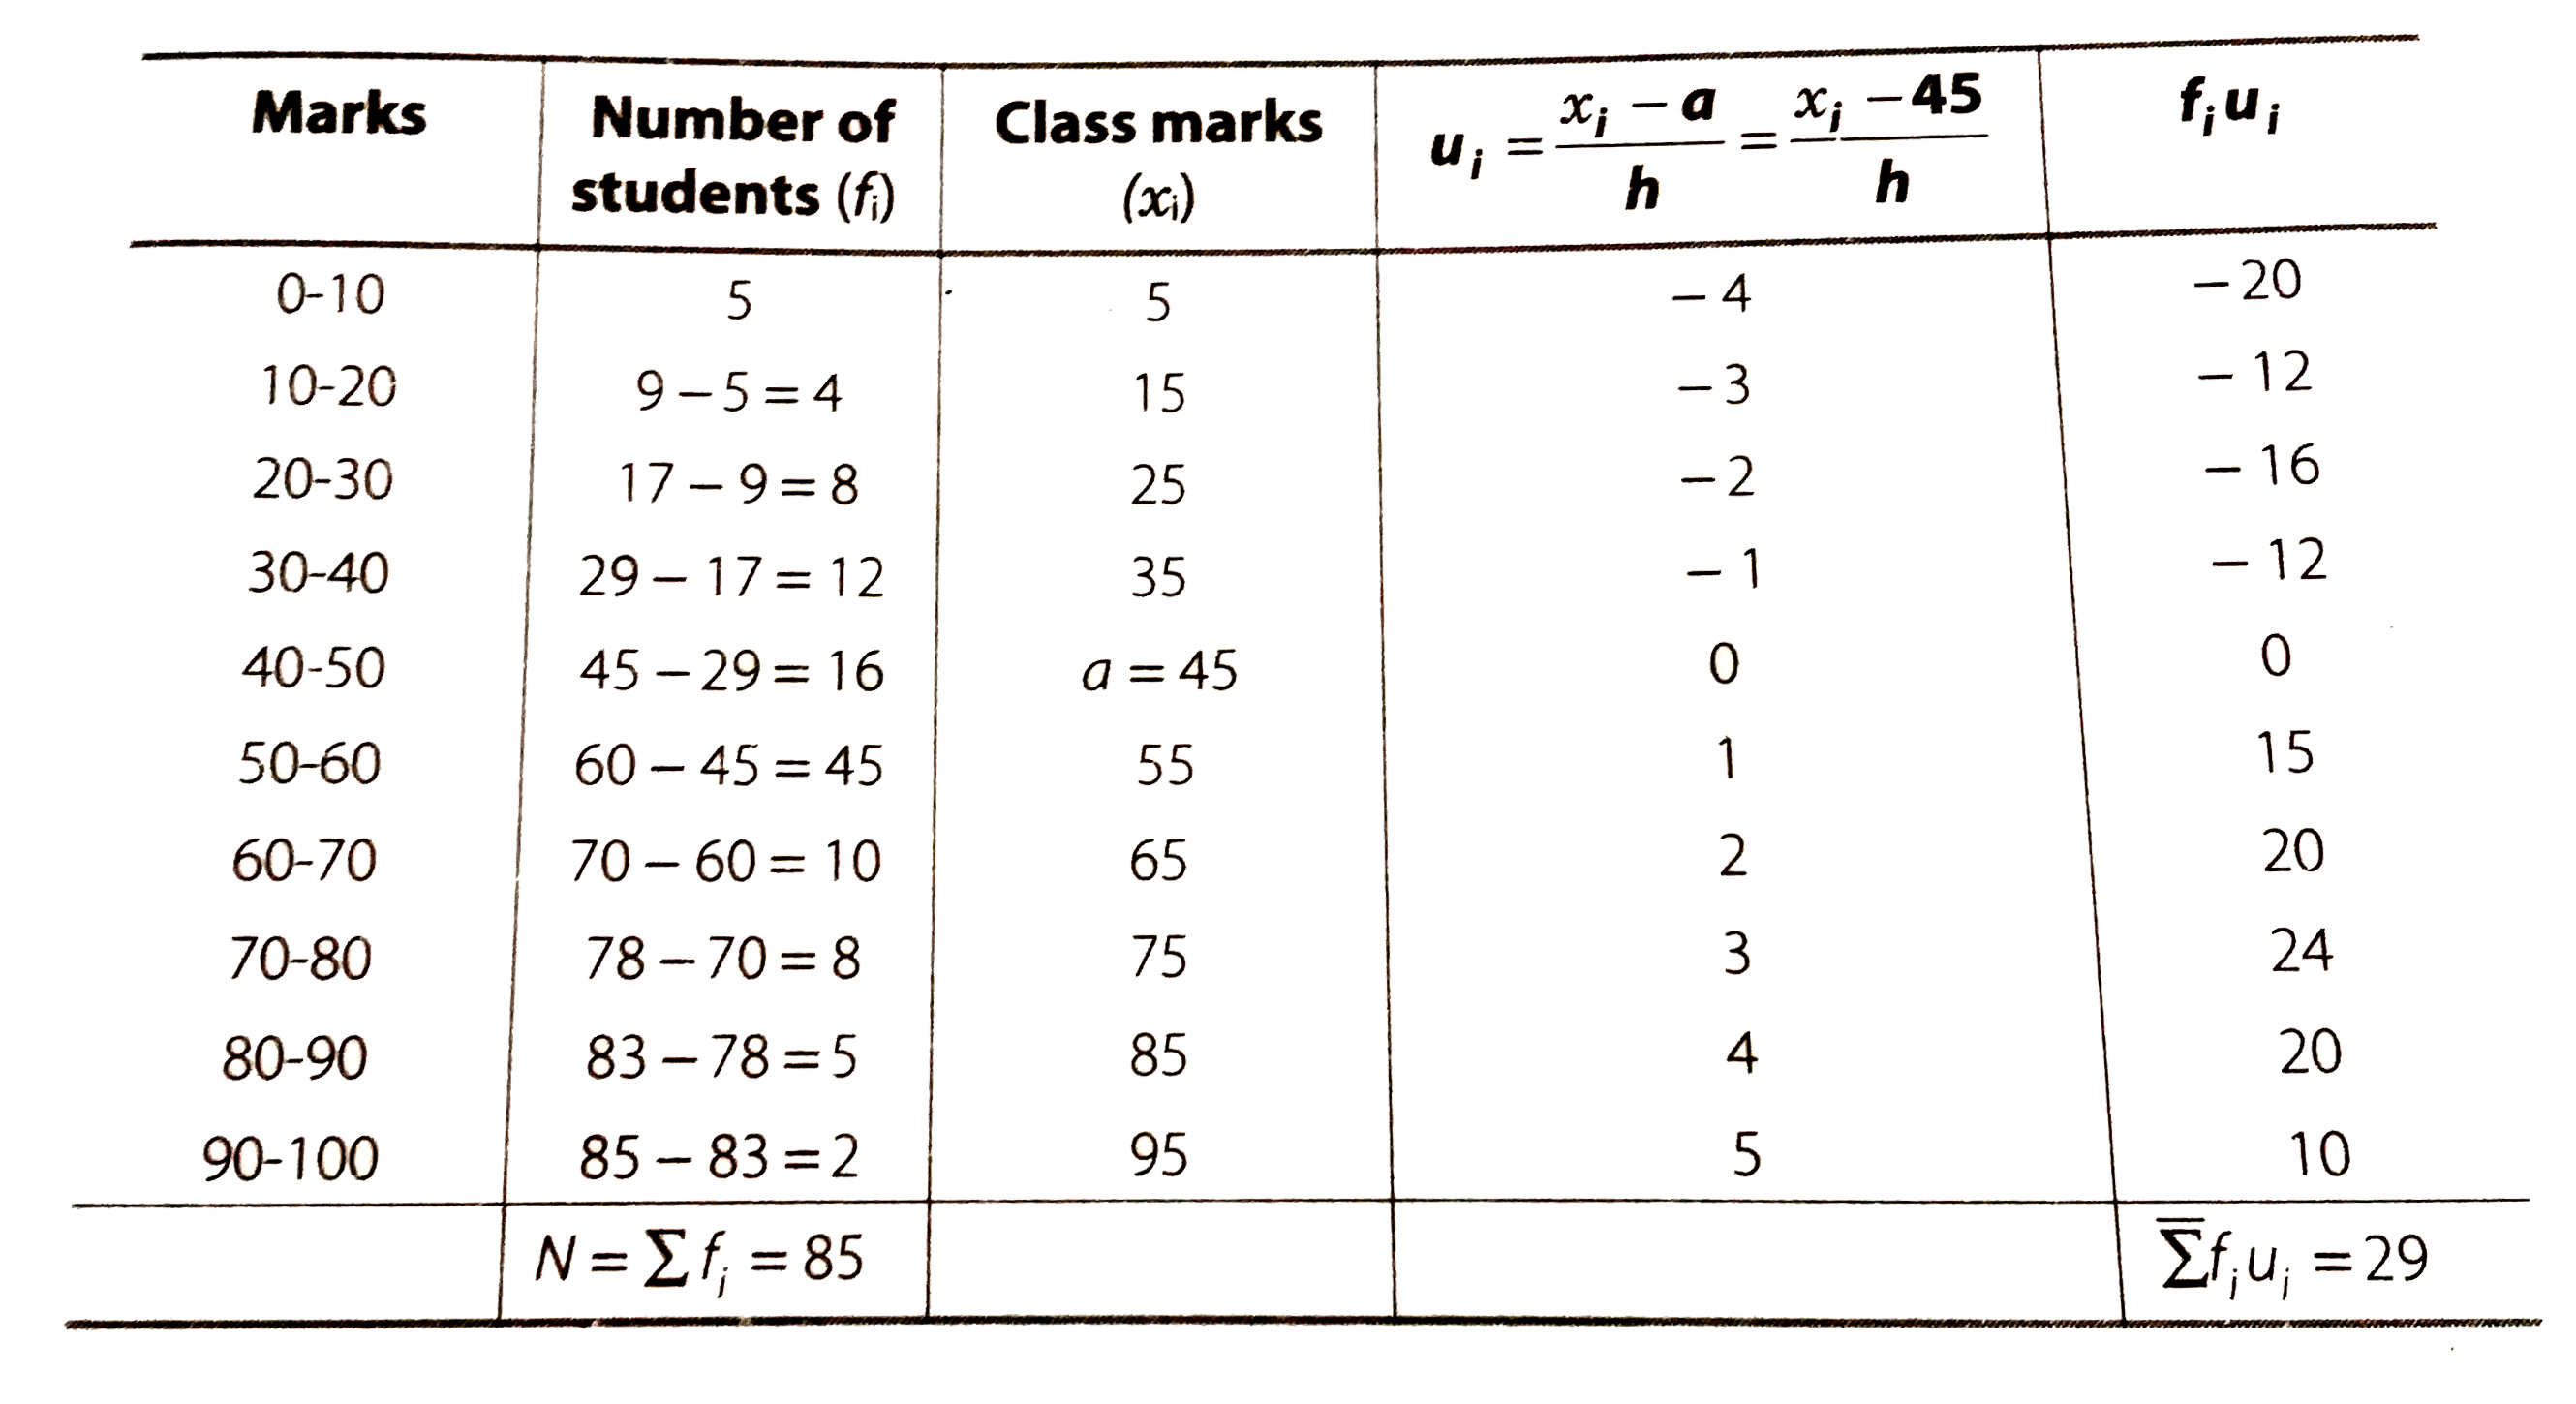
Here, we observe that, 5 students have scored marks below 10 i.e. it lies between class interval 0-10 and 9 students have scored marks below 20. So, (9-5)=4 students lies in the class interval 10-20. Continuing in the same manner, we get the complete frequency distribution table for given data.

Here, (assumed mean)a=45
and (class width)h=10
By step deviation method. Mean(¯x)=a+∑fiui∑fi×h=45+2985×10=45+5817
=45+3.41=48.41
|
Topper's Solved these Questions
- STATISTICS AND PROBABILITYBOOK - NCERT EXEMPLAR ENGLISHCHAPTER - STATISTICS AND PROBABILITYEXERCISE - SHORT ANSWERS QUESTIONS
42 Videos
- REAL NUMBERSBOOK - NCERT EXEMPLAR ENGLISHCHAPTER - REAL NUMBERSEXERCISE - LONG ANSWER TYPE QUESTIONS
5 Videos
- SURFACE AREAS AND VOLUMESBOOK - NCERT EXEMPLAR ENGLISHCHAPTER - SURFACE AREAS AND VOLUMESEXERCISE - LONG ANSWER TYPE QUESTIONS
20 Videos
Similar Questions
Knowledge Check
Find the mean of the following distribution:
 A9B10C11D12
Find the mean of the following distribution:
View SolutionFind the mean of the following distribution:
View SolutionFind the mean of the following distribution:

View SolutionFind the mean of the following distribution :

View SolutionFind the mean of the following distribution:

View SolutionFind the mean of the following distribution:

View SolutionFind the mean of the following distribution:

View Solution

