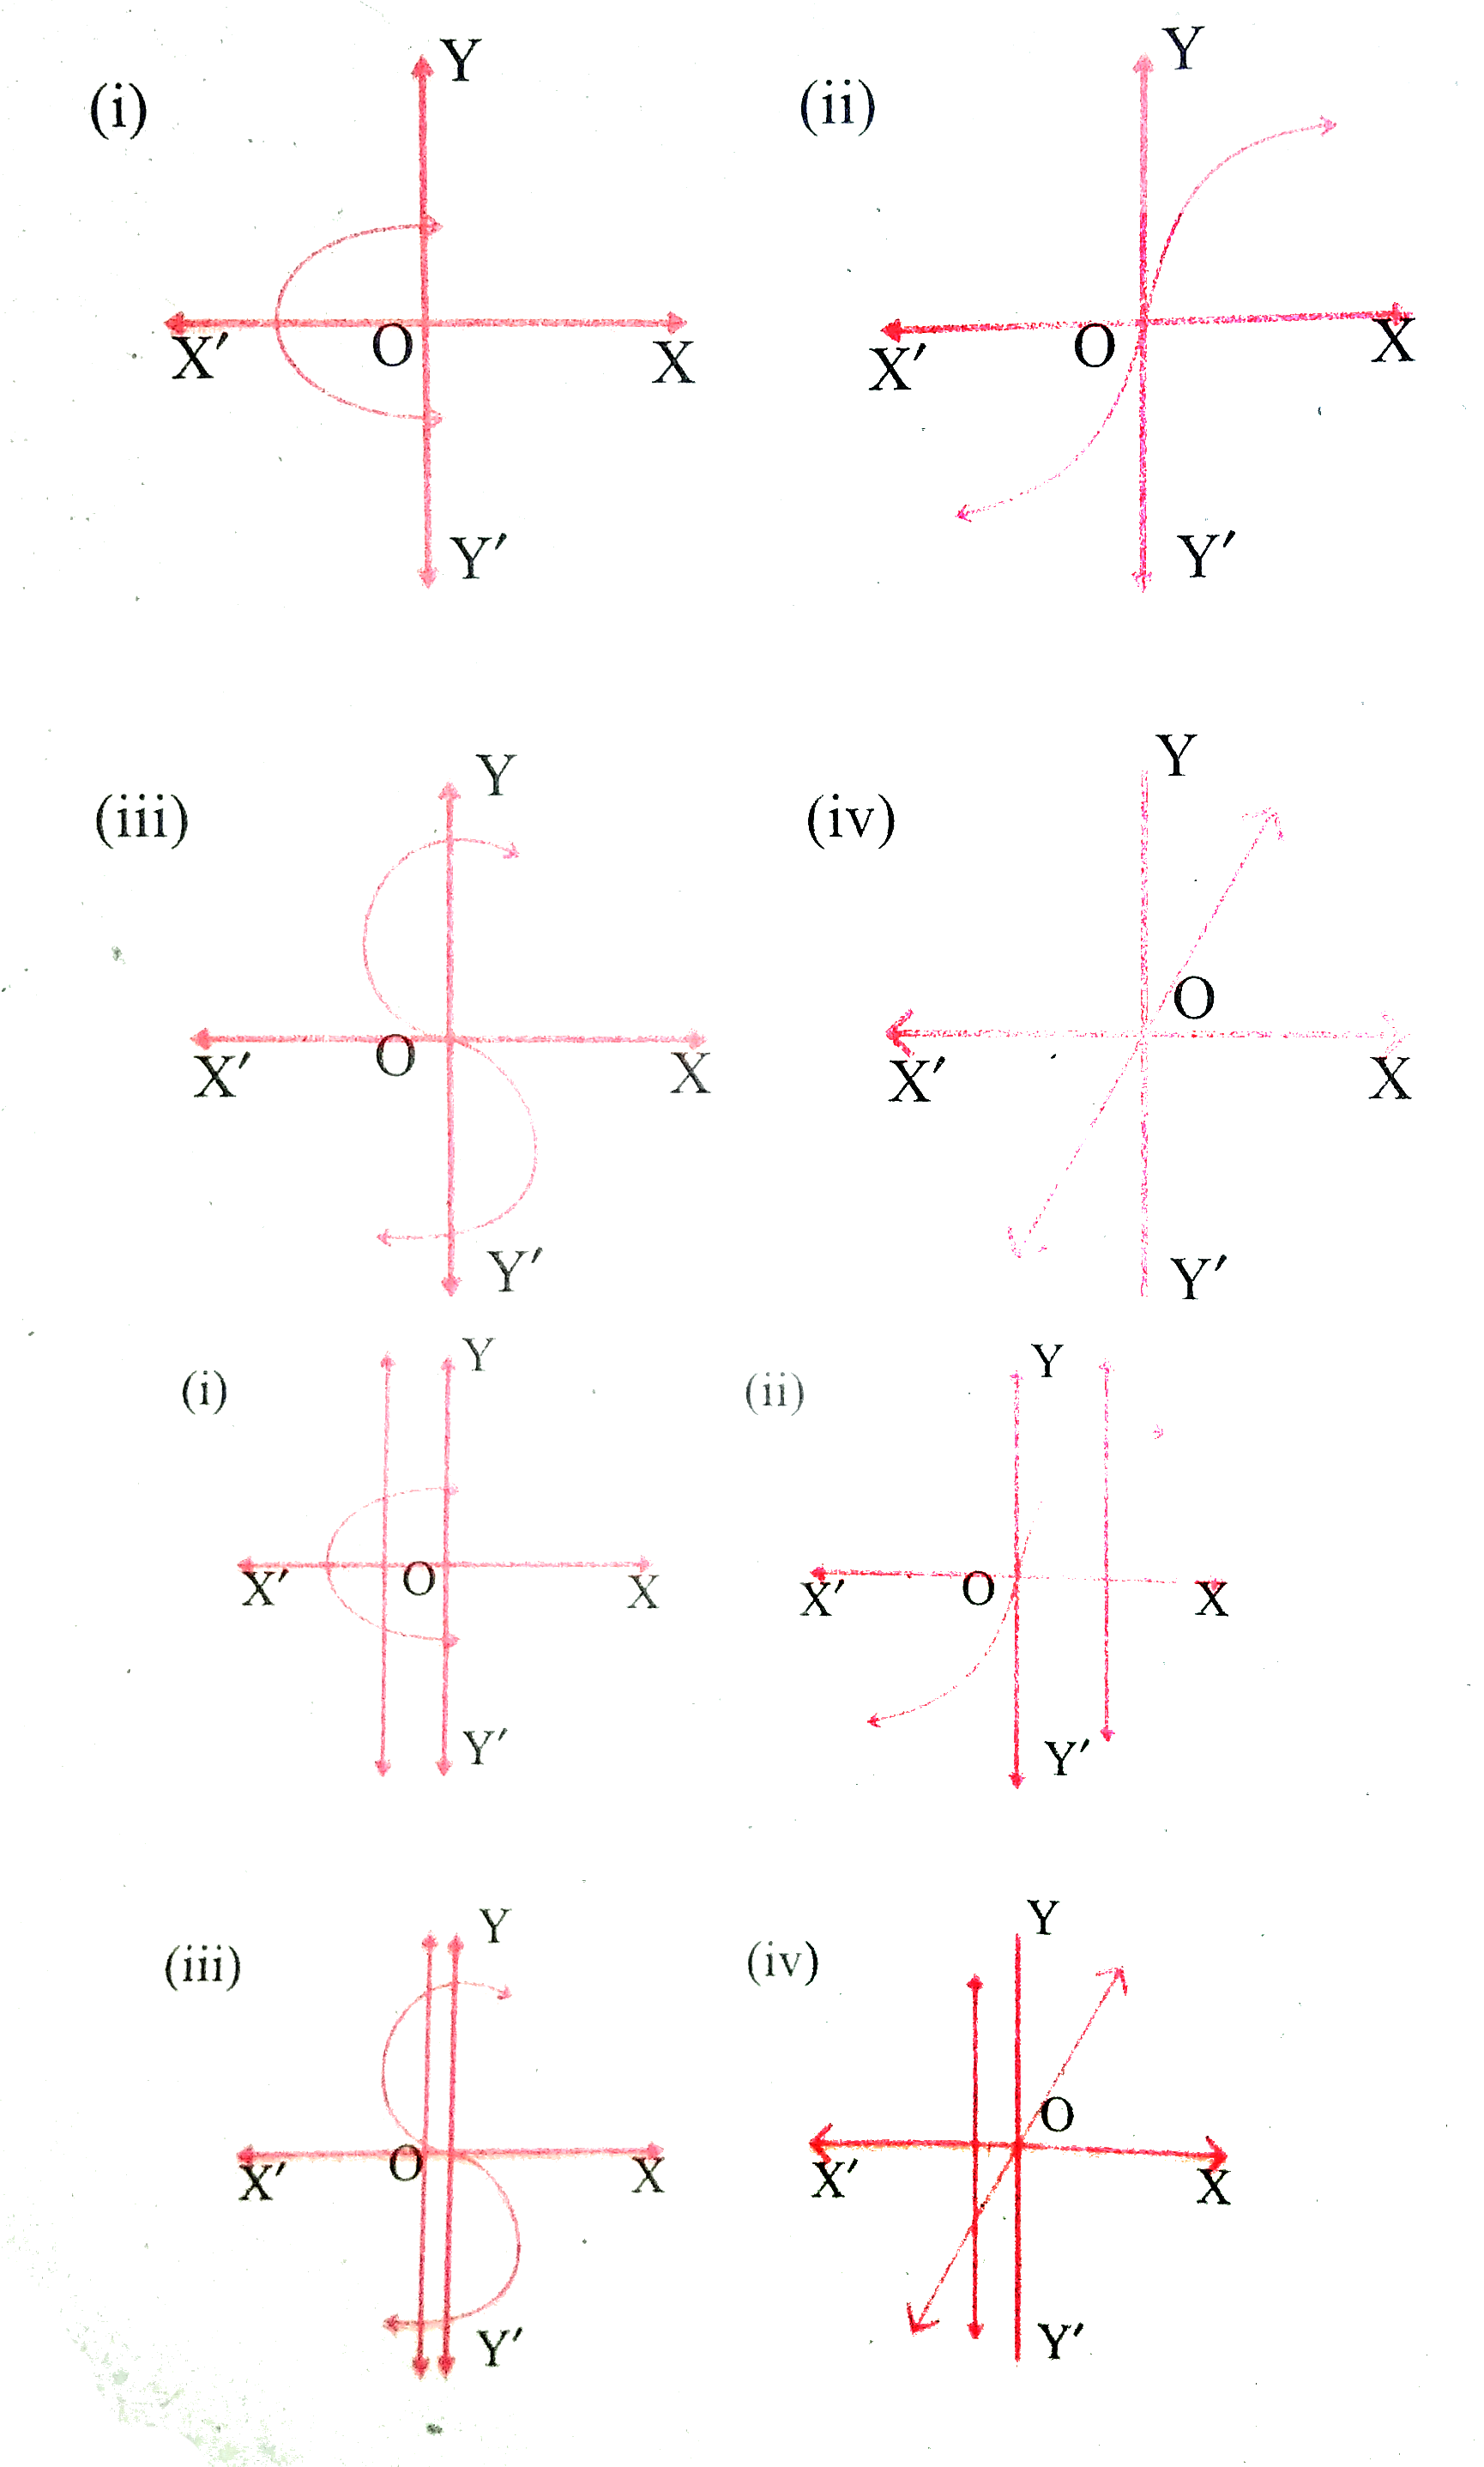
Determine whether the graph given below represents functions. Give reason for your answers concering each graph
 Solution in Tamil
Step by step video & image solution for Determine whether the graph given below represents functions. Give reason for your answers concering each graph by Maths experts to help you in doubts & scoring excellent marks in Class 10 exams.
Updated on:21/07/2023Topper's Solved these Questions
- RELATIONS AND FUNCTIONSBOOK - SURA PUBLICATIONCHAPTER - RELATIONS AND FUNCTIONSEXERCISE - EXECRISE 1.5
19 Videos
- RELATIONS AND FUNCTIONSBOOK - SURA PUBLICATIONCHAPTER - RELATIONS AND FUNCTIONSEXERCISE - EXECRISE 1.6
15 Videos
- RELATIONS AND FUNCTIONSBOOK - SURA PUBLICATIONCHAPTER - RELATIONS AND FUNCTIONSEXERCISE - EXECRISE 1.3
22 Videos
- ONE MARK QUESTIONS SET BOOK - SURA PUBLICATIONCHAPTER - ONE MARK QUESTIONS SET EXERCISE - Multiple Choice Question
250 Videos
- STATISTICS AND PROBABILITY BOOK - SURA PUBLICATIONCHAPTER - STATISTICS AND PROBABILITY EXERCISE - Unit Test (Section -C)
1 Videos
Similar Questions
Using the function f and g given below, find the fog and gof. Check whether fog=gof.
f(x)=x−6,g(x)=x3
View SolutionIf n(A×B)=6andA={1,3}, then n(B) is
View SolutionLet f={(x,y)∣x,y∈Nandy=2x} be a relation on N. Find the domain, co-domain and range. Is this relation a function?
View SolutionIf the ordered pairs (a+2,4)and(5,2a+b) are equal to then (a, b) is
View SolutionThe frequency distribution is given below.
xk2k3k4k5k6kf211111
In the table, k is a positive integer, has a varience of 160. Determine the value of k.
View SolutionDetermine the point of symmetry of a regular hexagon.
View SolutionDtermine the images of the following figure about the given line :
View SolutionMatch the following Column A to Column B

View SolutionMatch the following Column A to Column B

View SolutionMatch the following Column A to Column B

View SolutionFind the area of figure given below.

View SolutionFind the perimeter of the figure given below.

View SolutionFind the area of the figure given below.

View SolutionThe area of the shaded part in the figure given below is ______.

View SolutionThe inequation represented by the graph given below is :
View Solution
