Direction : The given bar graph represents the petrol and diesel cars sold in a mega city from 2010 to 2015 . Study the graph carefully and answer the following questions.
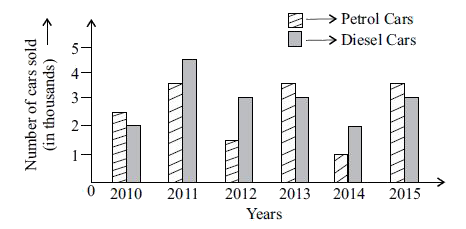
In which year, the total sale of petrol and diesel cars altogether was maximum?
2012
2011
2013
2014
The correct Answer is:B
Step by step video, text & image solution for Direction : The given bar graph represents the petrol and diesel cars sold in a mega city from 2010 to 2015 . Study the graph carefully and answer the following questions. In which year, the total sale of petrol and diesel cars altogether was maximum? by Maths experts to help you in doubts & scoring excellent marks in Class 9 exams.
Updated on:21/07/2023Topper's Solved these Questions
- IMO QUESTION PAPER 2018 SET ABOOK - SCIENCE OLYMPIAD FOUNDATION CHAPTER - IMO QUESTION PAPER 2018 SET AEXERCISE - EVERYDAY MATHEMATICS
10 Videos
- IMO QUESTION PAPER 2018 SET ABOOK - SCIENCE OLYMPIAD FOUNDATION CHAPTER - IMO QUESTION PAPER 2018 SET AEXERCISE - ACHIEVERS SECTION
5 Videos
- IMO QUESTION PAPER 2017 SET BBOOK - SCIENCE OLYMPIAD FOUNDATION CHAPTER - IMO QUESTION PAPER 2017 SET BEXERCISE - ACHIEVERS SECTION
5 Videos
- IMO QUESTION PAPER 2018 SET B BOOK - SCIENCE OLYMPIAD FOUNDATION CHAPTER - IMO QUESTION PAPER 2018 SET B EXERCISE - Achievers Section
5 Videos
Similar Questions
Knowledge Check
Study the graph carefully and answer the following questions.
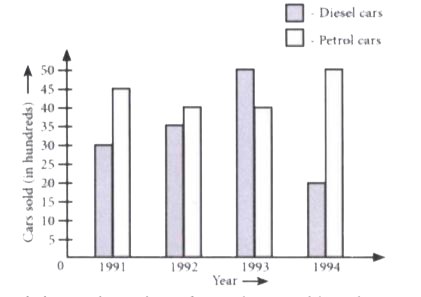
Find the mean sale of Petrol cars.A4735B5745C5740D4375Study the graph carefully and answer the following questions.
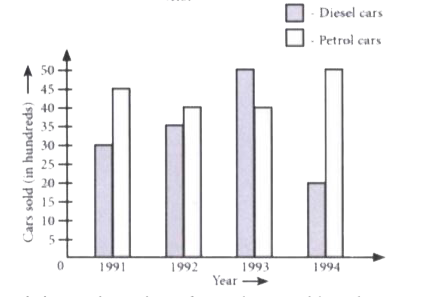
How many cars were sold during the year 1991?A9000B6500C7500D7000Study the graph carefully and answer the following questions.
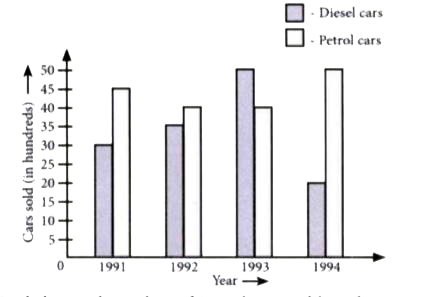
Find the total number of Diesel cars sold in the year 1992 and 1994 together.A2500B5500C1500D4500
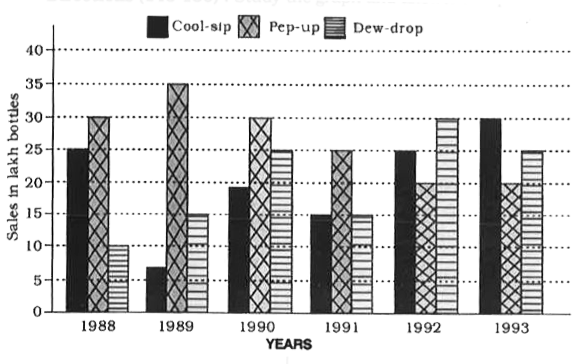
Study the graph and answer the questions.
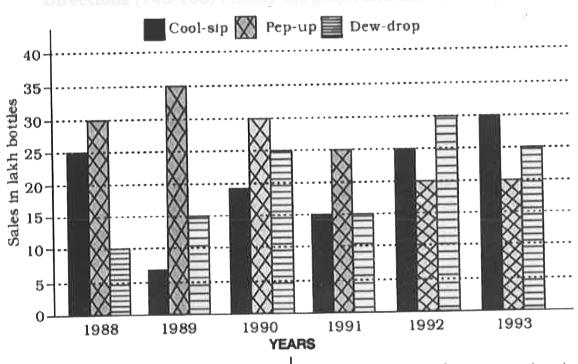
In which year sale of Dew -drop is maximum ?
View SolutionObserve the graph below and answer the following question.
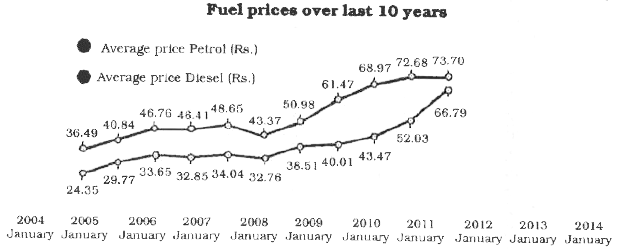
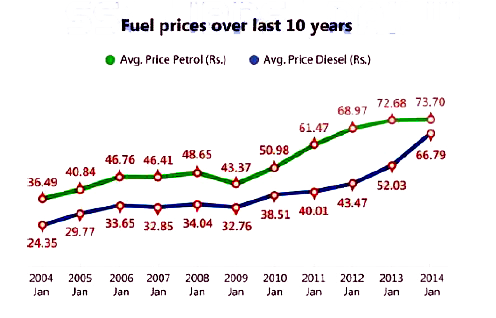
In which year the difference between average prices of petrol and Diesel is minimum?
View SolutionStudy the graph carefully and answer the following questions.
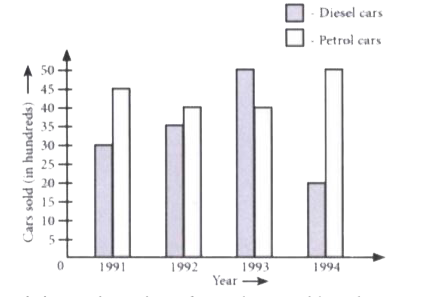
How many more Diesel cars were sold in 1991 than in 1994?
View SolutionStudy the graph and answer the questions.
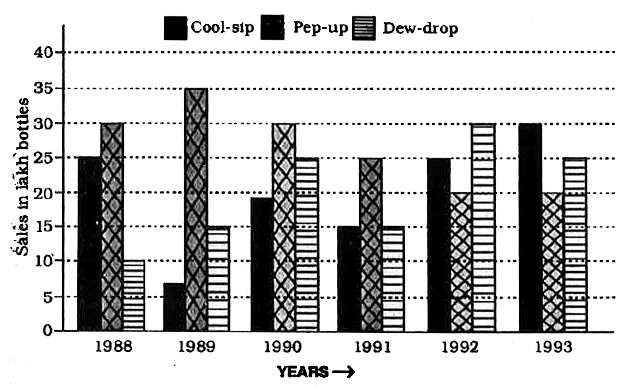
In which year the sale of cool-sip is minimum ?
View SolutionStudy the graph and answer the questions.
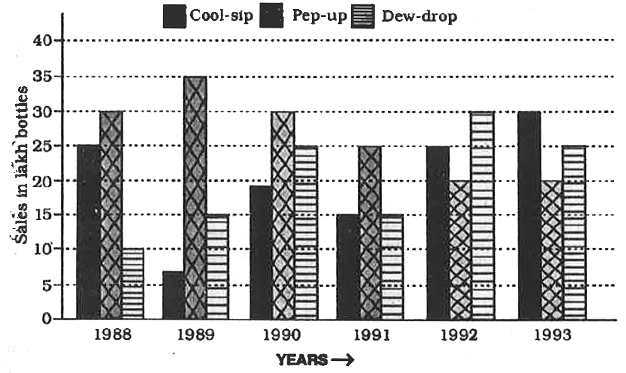
In which year sale of Drew-drop is maximum ?
View Solution

