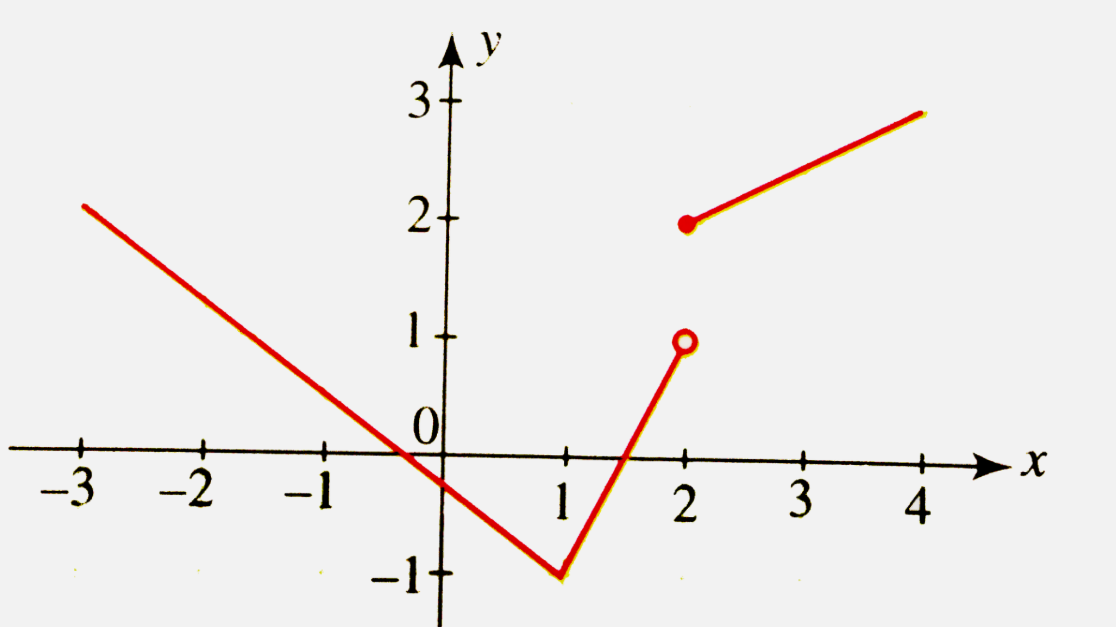
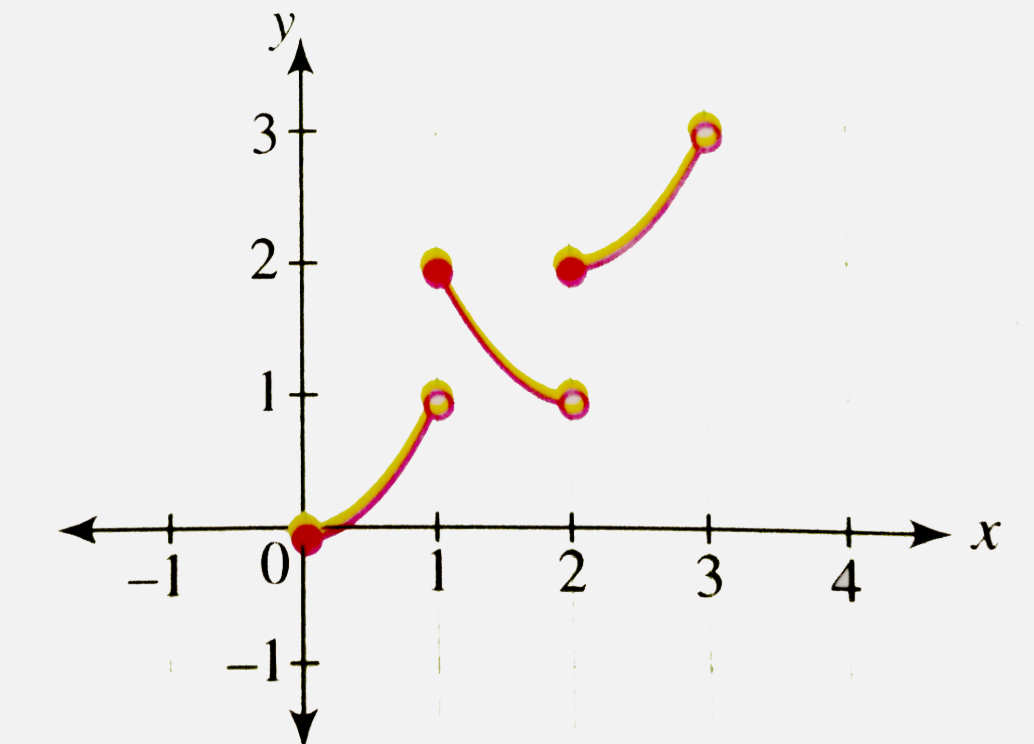
Does the following graph represent a function or a relation?
 Solution in Tamil
No matter where you try to draw a vertical line, it only hits the graph once, so this is a function.

The point (2, 1) is not filled in, indicating that the graph does not include the point (2, 1). However, notice that (2, 2) is completely filled in, because that point is included in the graph.
Topper's Solved these Questions
- GETTING STARTED WITH GRAPHSBOOK - CENGAGECHAPTER - GETTING STARTED WITH GRAPHSEXERCISE - Exercise
18 Videos
- FUNCTIONSBOOK - CENGAGECHAPTER - FUNCTIONSEXERCISE - Question Bank
21 Videos
- GRAPH OF INVERSE TRIGONOMETRIC FUNCTIONSBOOK - CENGAGECHAPTER - GRAPH OF INVERSE TRIGONOMETRIC FUNCTIONSEXERCISE - Exercise
18 Videos
Similar Questions
Does the following graph pass the vertical or horizontal line test ?

View SolutionIf there are four distinct real numbers satisfying thẻ equation ∣∣x2−4x−7∣∣=n, then number of integers in the range of n is
View SolutionDraw the graph of y=tan−1x+cot−1x
View SolutionMatch the following lists:

View SolutionHow many lines of symmetry does the above figure have ?
View SolutionWhich of the following are correct chain isomers of butane ? (i)
View SolutionDetermine the point of symmetry of a regular hexagon.
View SolutionDtermine the images of the following figure about the given line :
View SolutionMatch the following Column A to Column B

View SolutionMatch the following Column A to Column B

View SolutionMatch the following Column A to Column B

View SolutionThe inequation represented by the graph given below is :
View SolutionThe inequation that best describes the graph given below is _________
View SolutionThe inequation that best describes the following graph is _________
View SolutionWhich inequations represent the shaded region in the given figure
View SolutionFrom the following figure, the correct observation is :- ltimg src="https://d10lpgp6xz60nq.cloudfront.net/physics_images/ALN_PHY_R03_E08_015_Q01.png" width="80%"gt
View Solution
