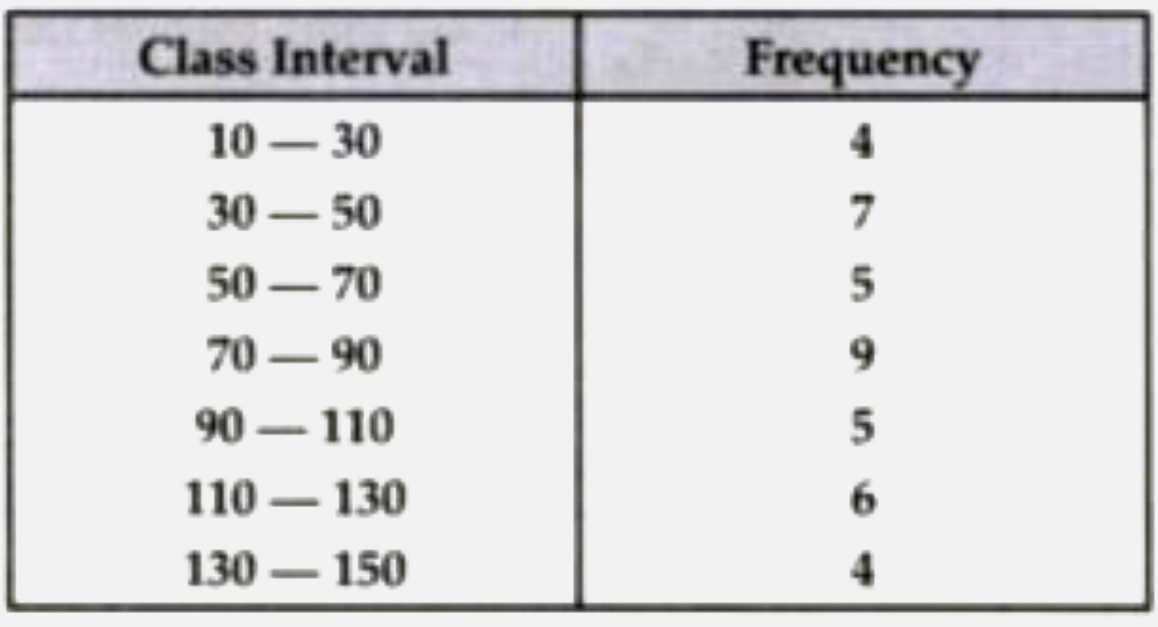
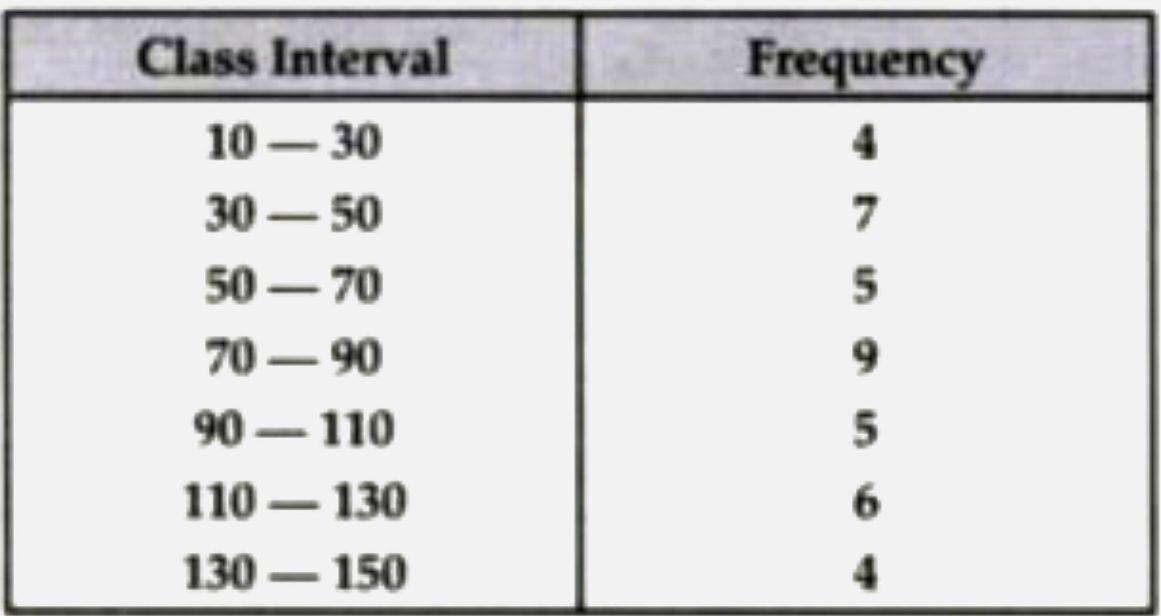
Draw a frequency polygon from the following data, giving the age of doctors working in C.GH.S. in a city

Step by step video & image solution for Draw a frequency polygon from the following data, giving the age of doctors working in C.GH.S. in a city by Maths experts to help you in doubts & scoring excellent marks in Class 9 exams.
Updated on:21/07/2023Topper's Solved these Questions
- STATISTICSBOOK - ICSECHAPTER - STATISTICSEXERCISE - EXERCISE 18 (A)
21 Videos
- STATISTICSBOOK - ICSECHAPTER - STATISTICSEXERCISE - EXERCISE 18 (B)
6 Videos
- SOLUTION OF RIGHT TRIANGLESBOOK - ICSECHAPTER - SOLUTION OF RIGHT TRIANGLESEXERCISE - EXERCISE 24
35 Videos
- STATISTICS AND GRAPH WORK BOOK - ICSECHAPTER - STATISTICS AND GRAPH WORK EXERCISE - TOPIC - 2 (4 Marks Questions)
14 Videos
Similar Questions
Draw a frequency polygon from the following data, giving the age of doctors working in C.G.H.S. in a city.

View SolutionConstruct a frequency polygon for the following data:

View SolutionConstruct a frequency polygon for the following data :

View SolutionDraw a histogram and frequency polygon from the following data:

View SolutionDraw a frequency polygon from the following frequency distribution

View SolutionDraw frequency polygons for each of the following :
Using histogram

View SolutionDraw a histogram from the following data:

View SolutionDraw frequency polygons for each of the following :
Without using histogram.

View SolutionDraw a bar graph from the following data:

View SolutionFrom the frequency distribution table from the following data

View Solution
