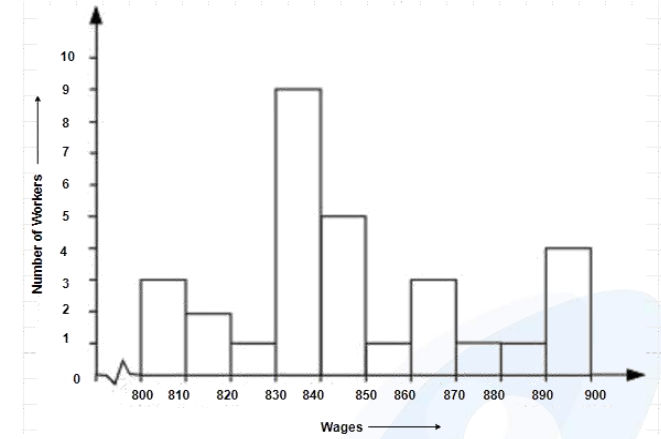
Draw a histogram for the frequency table made for the data in Question 3, and answer the following questions.(i) Which group has the maximum number of workers?(ii) How many workers earn Rs 850 and more?(iii) How many workers earn less than Rs 850?
(i)830−840 group has the maximum number of workers.
(ii) 10 workers can earn more than Rs850.
(iii)20 workers earn less than Rs850.
Topper's Solved these Questions
Similar Questions
The weekly wages (in Rs.) of 30 workers in a factory are give: 830,835,890,810,835,836,869,845,898,890, 820,860,832,833,855,845,804,808,812,,840,885,835,835,836,878,840,868,890,806,840 Mark a frequency table with intervals as 800-810, 810-820 and so on, using tally marks.
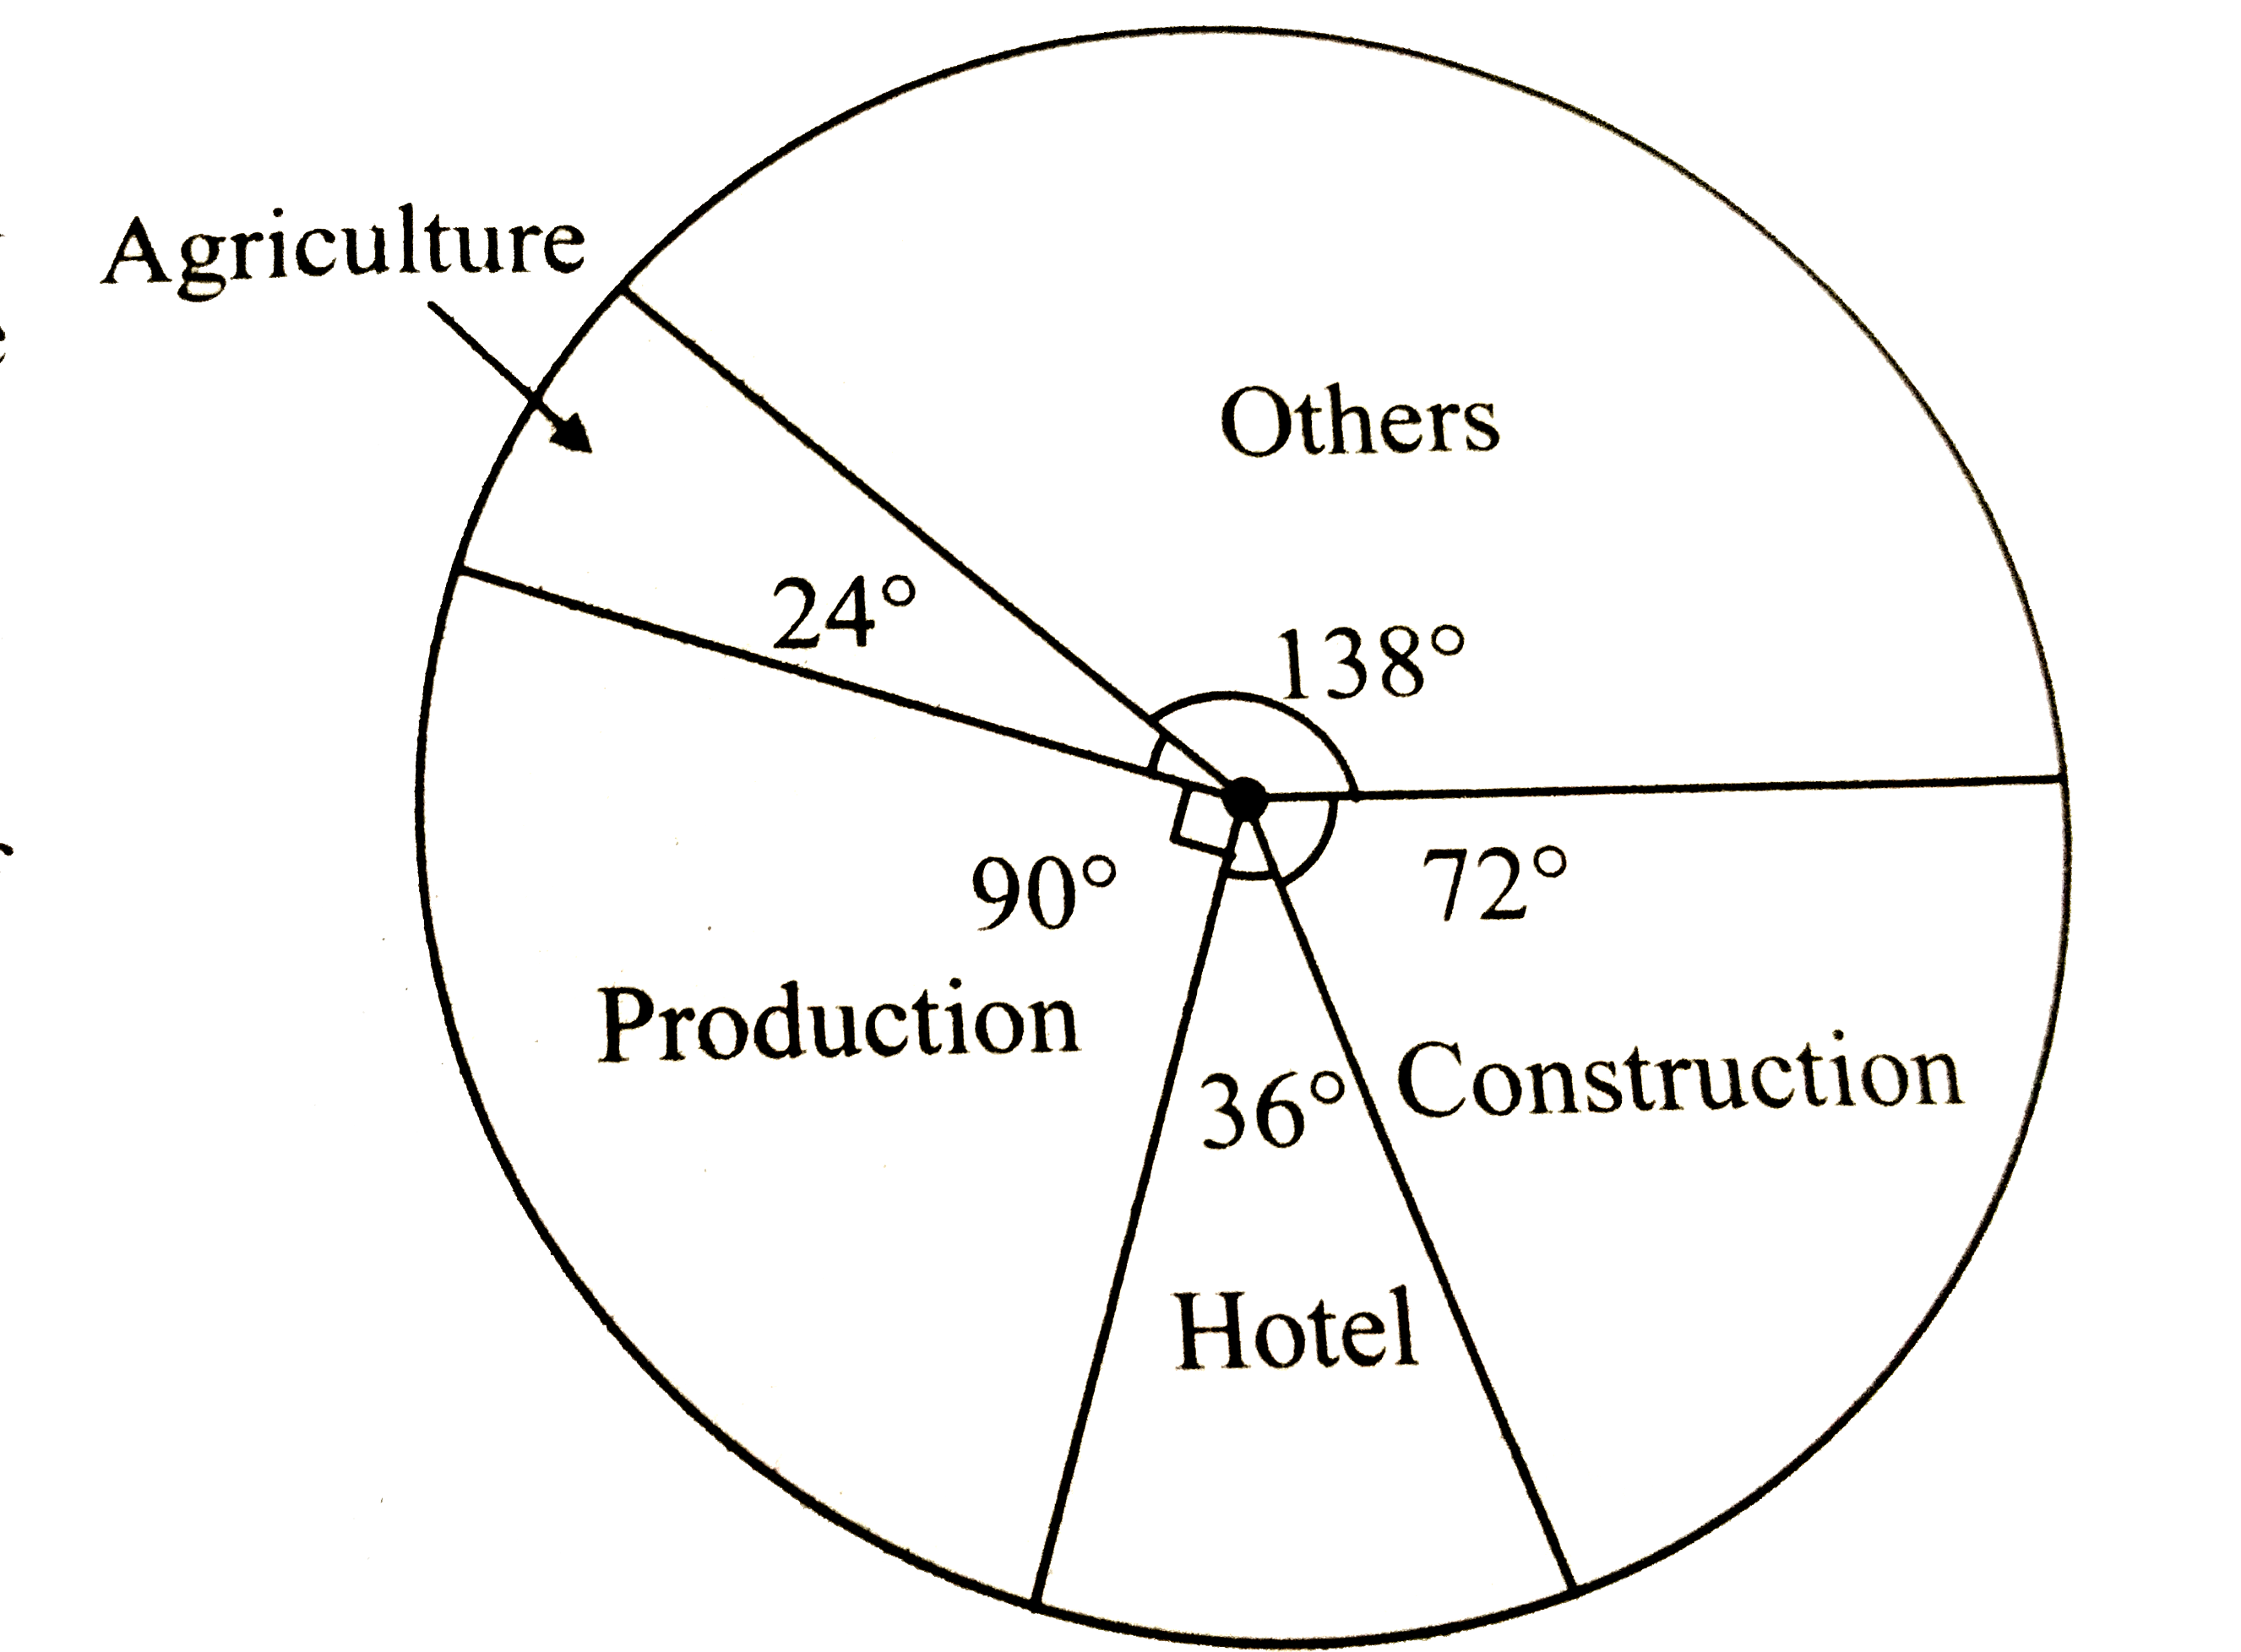
View SolutionThe pie diagram shows the classification of skilled workers.
If the number of workers in construction sector is 3600, answer the following questions:
(i) What is the total number of skilled workers in all fields?
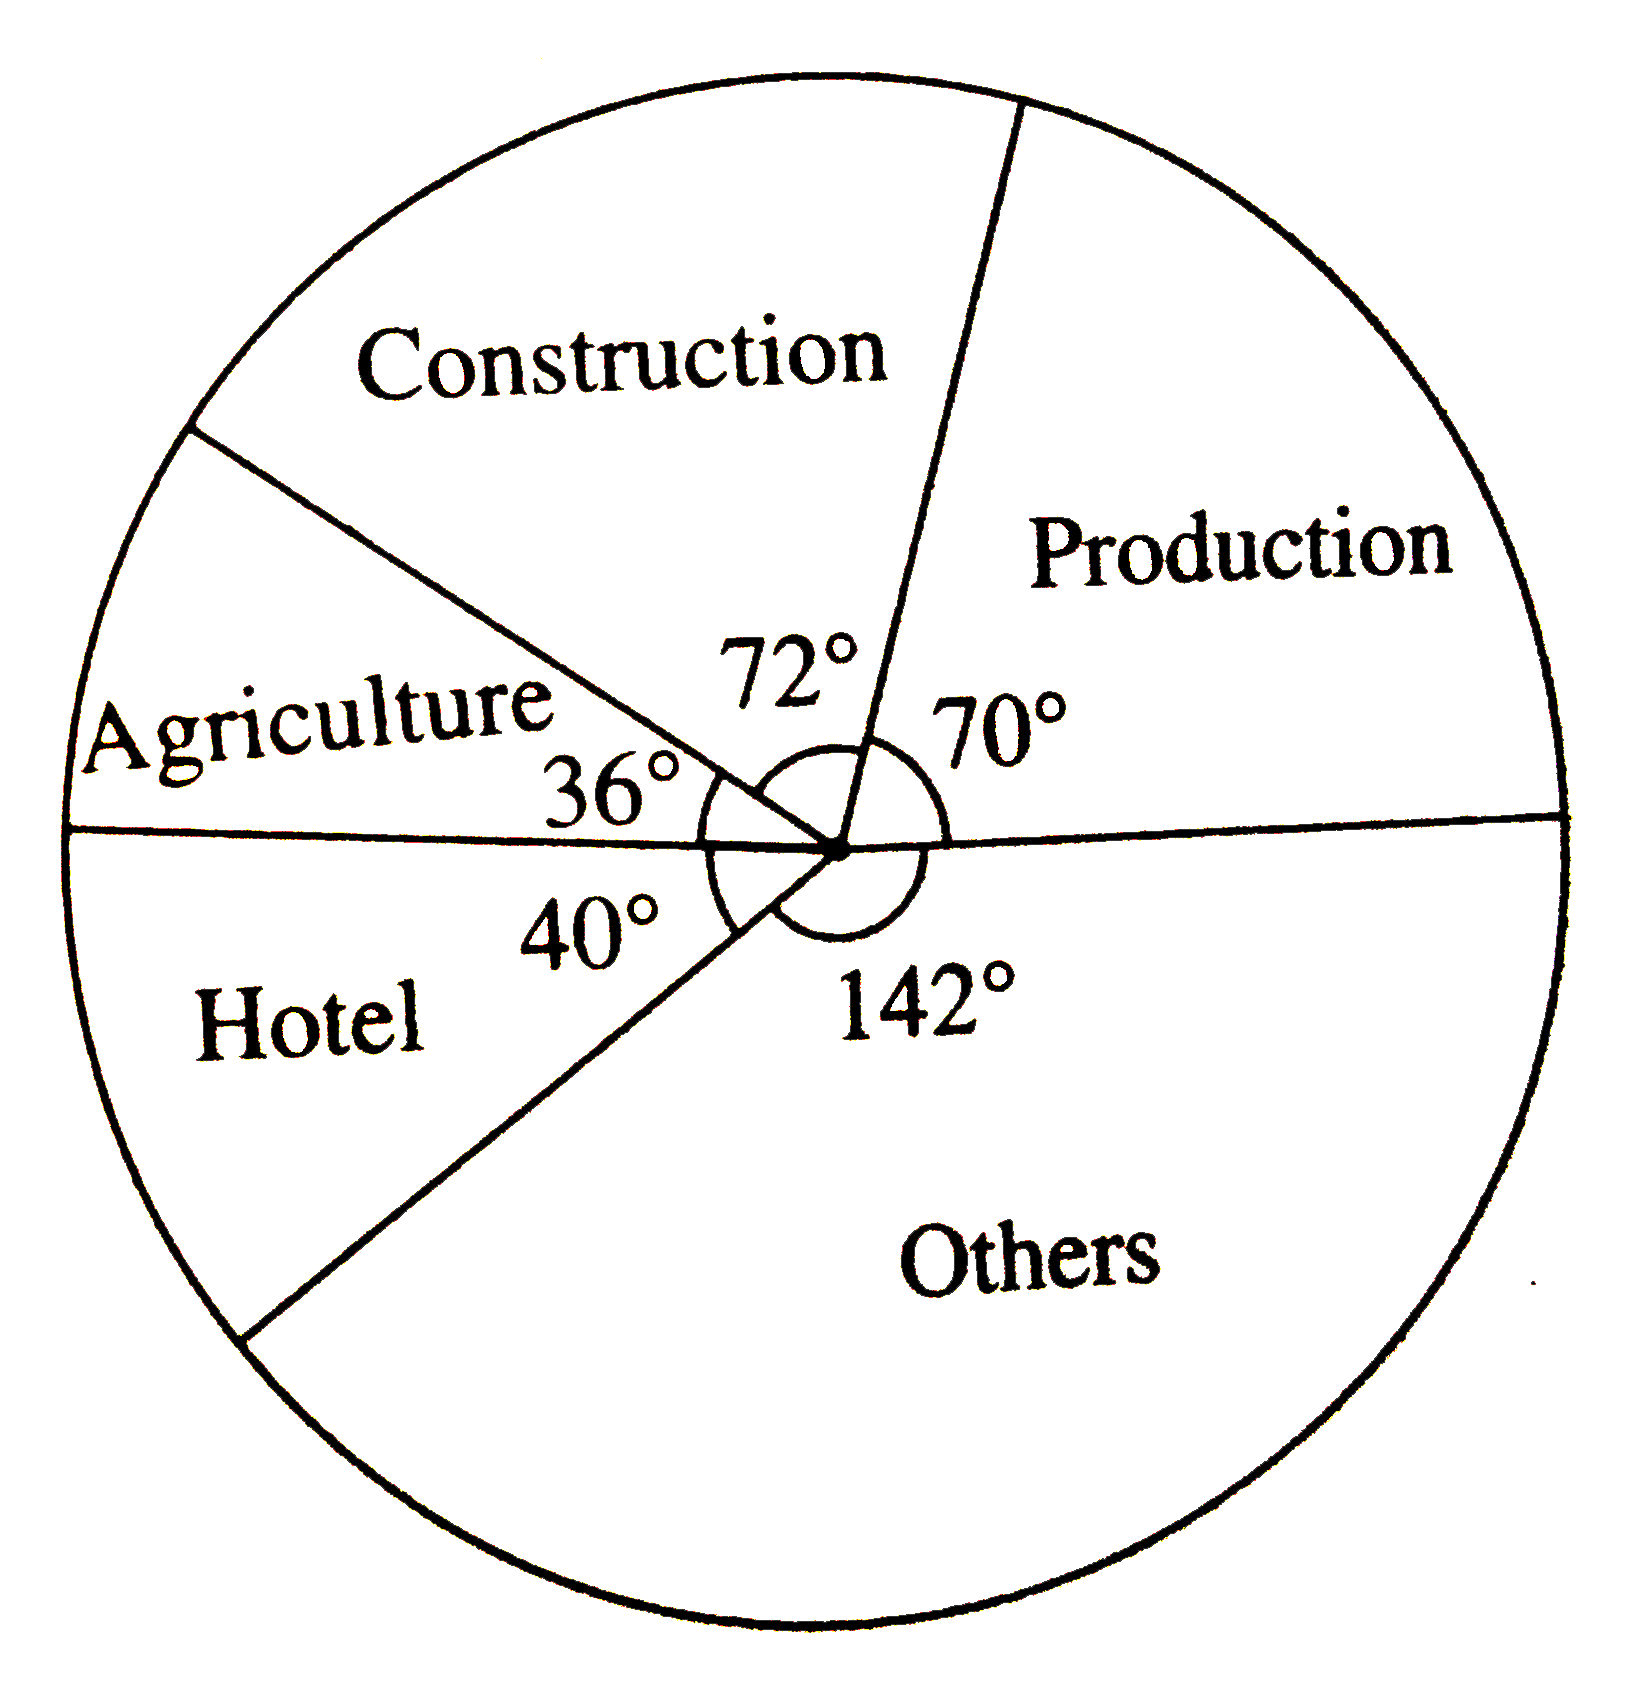
(ii) What is the number of skilled workers in hotel sector?
(iii) How many skilled workers are there in production sector?
(iv) What is the difference between the number of skilled workers in production sector and agriculture sector?
View Solution
Knowledge Check
The following table shows the daily earnings of 45 skilled workers: How many workers earn less than ₹ 1,100 in a day?
निम्नलिखित तालिका 45 कुशल श्रमिकों की दैनिक आय को दर्शाती है |
कितने श्रमिक एक दिन में 1,100 रुपये से कम कमाते हैं ?A29B10C39D43
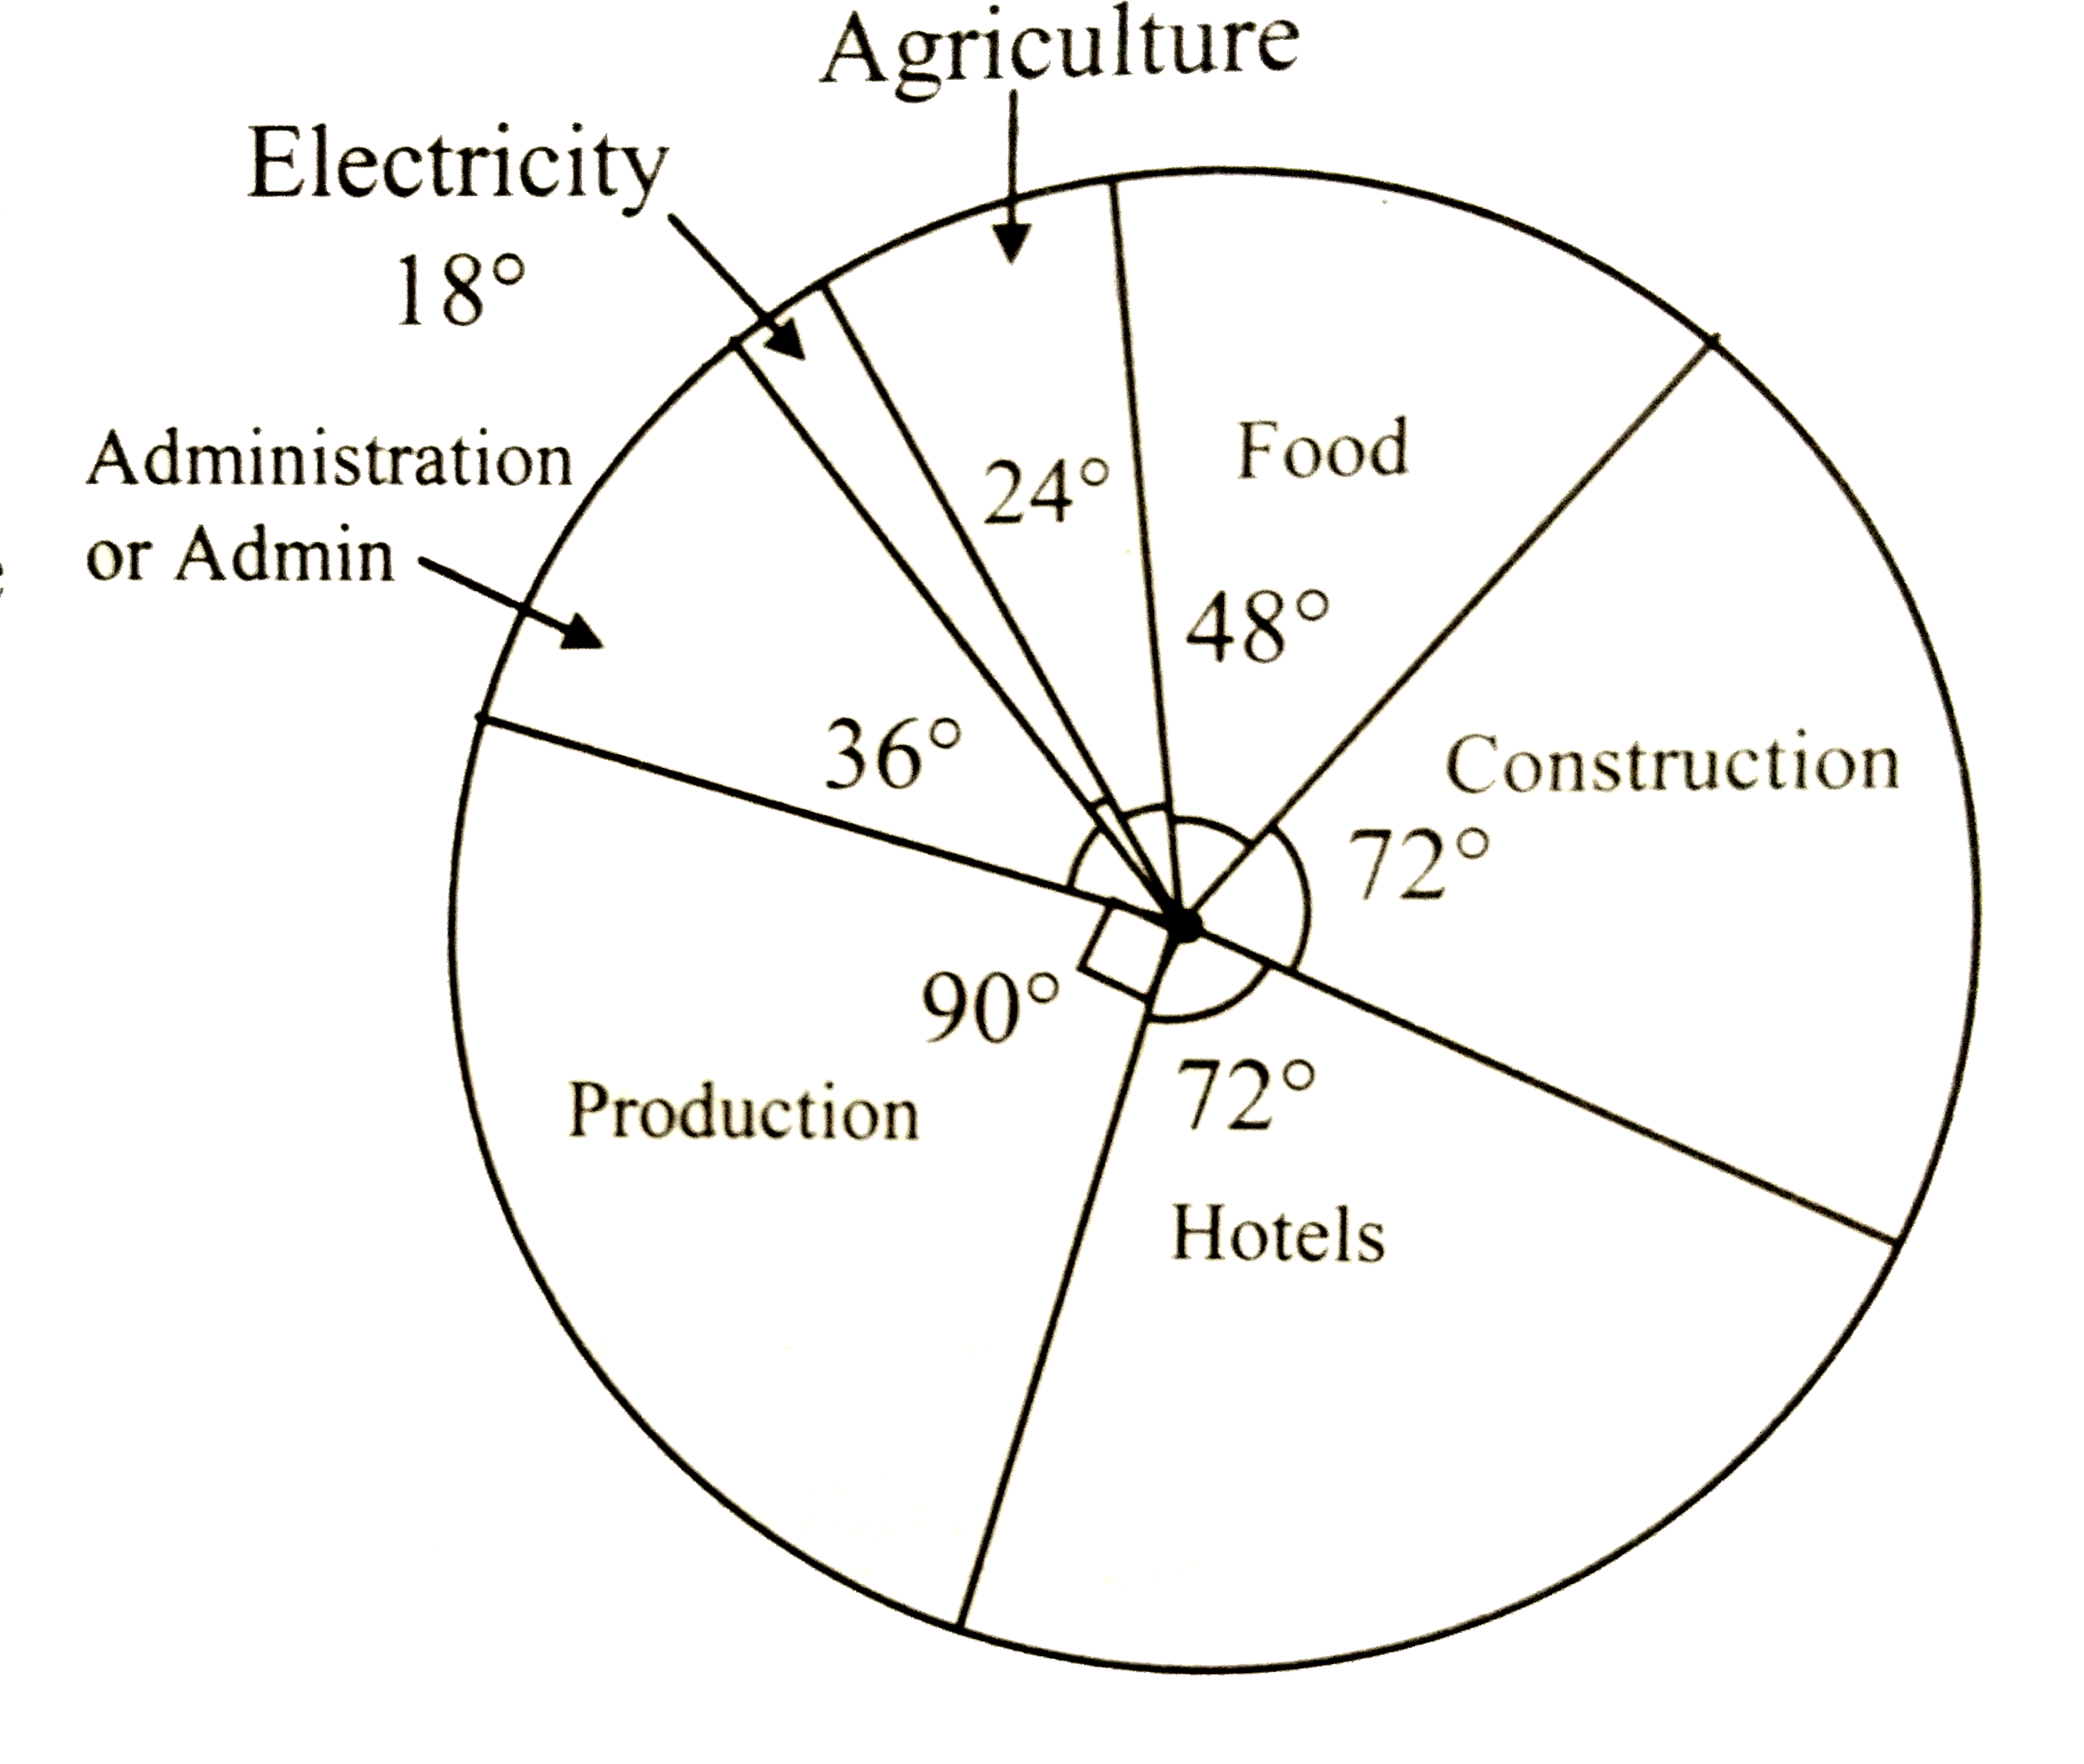
The pie diagram in figure, shows the proportions of different workers in a town. Answer the following questions with its help .
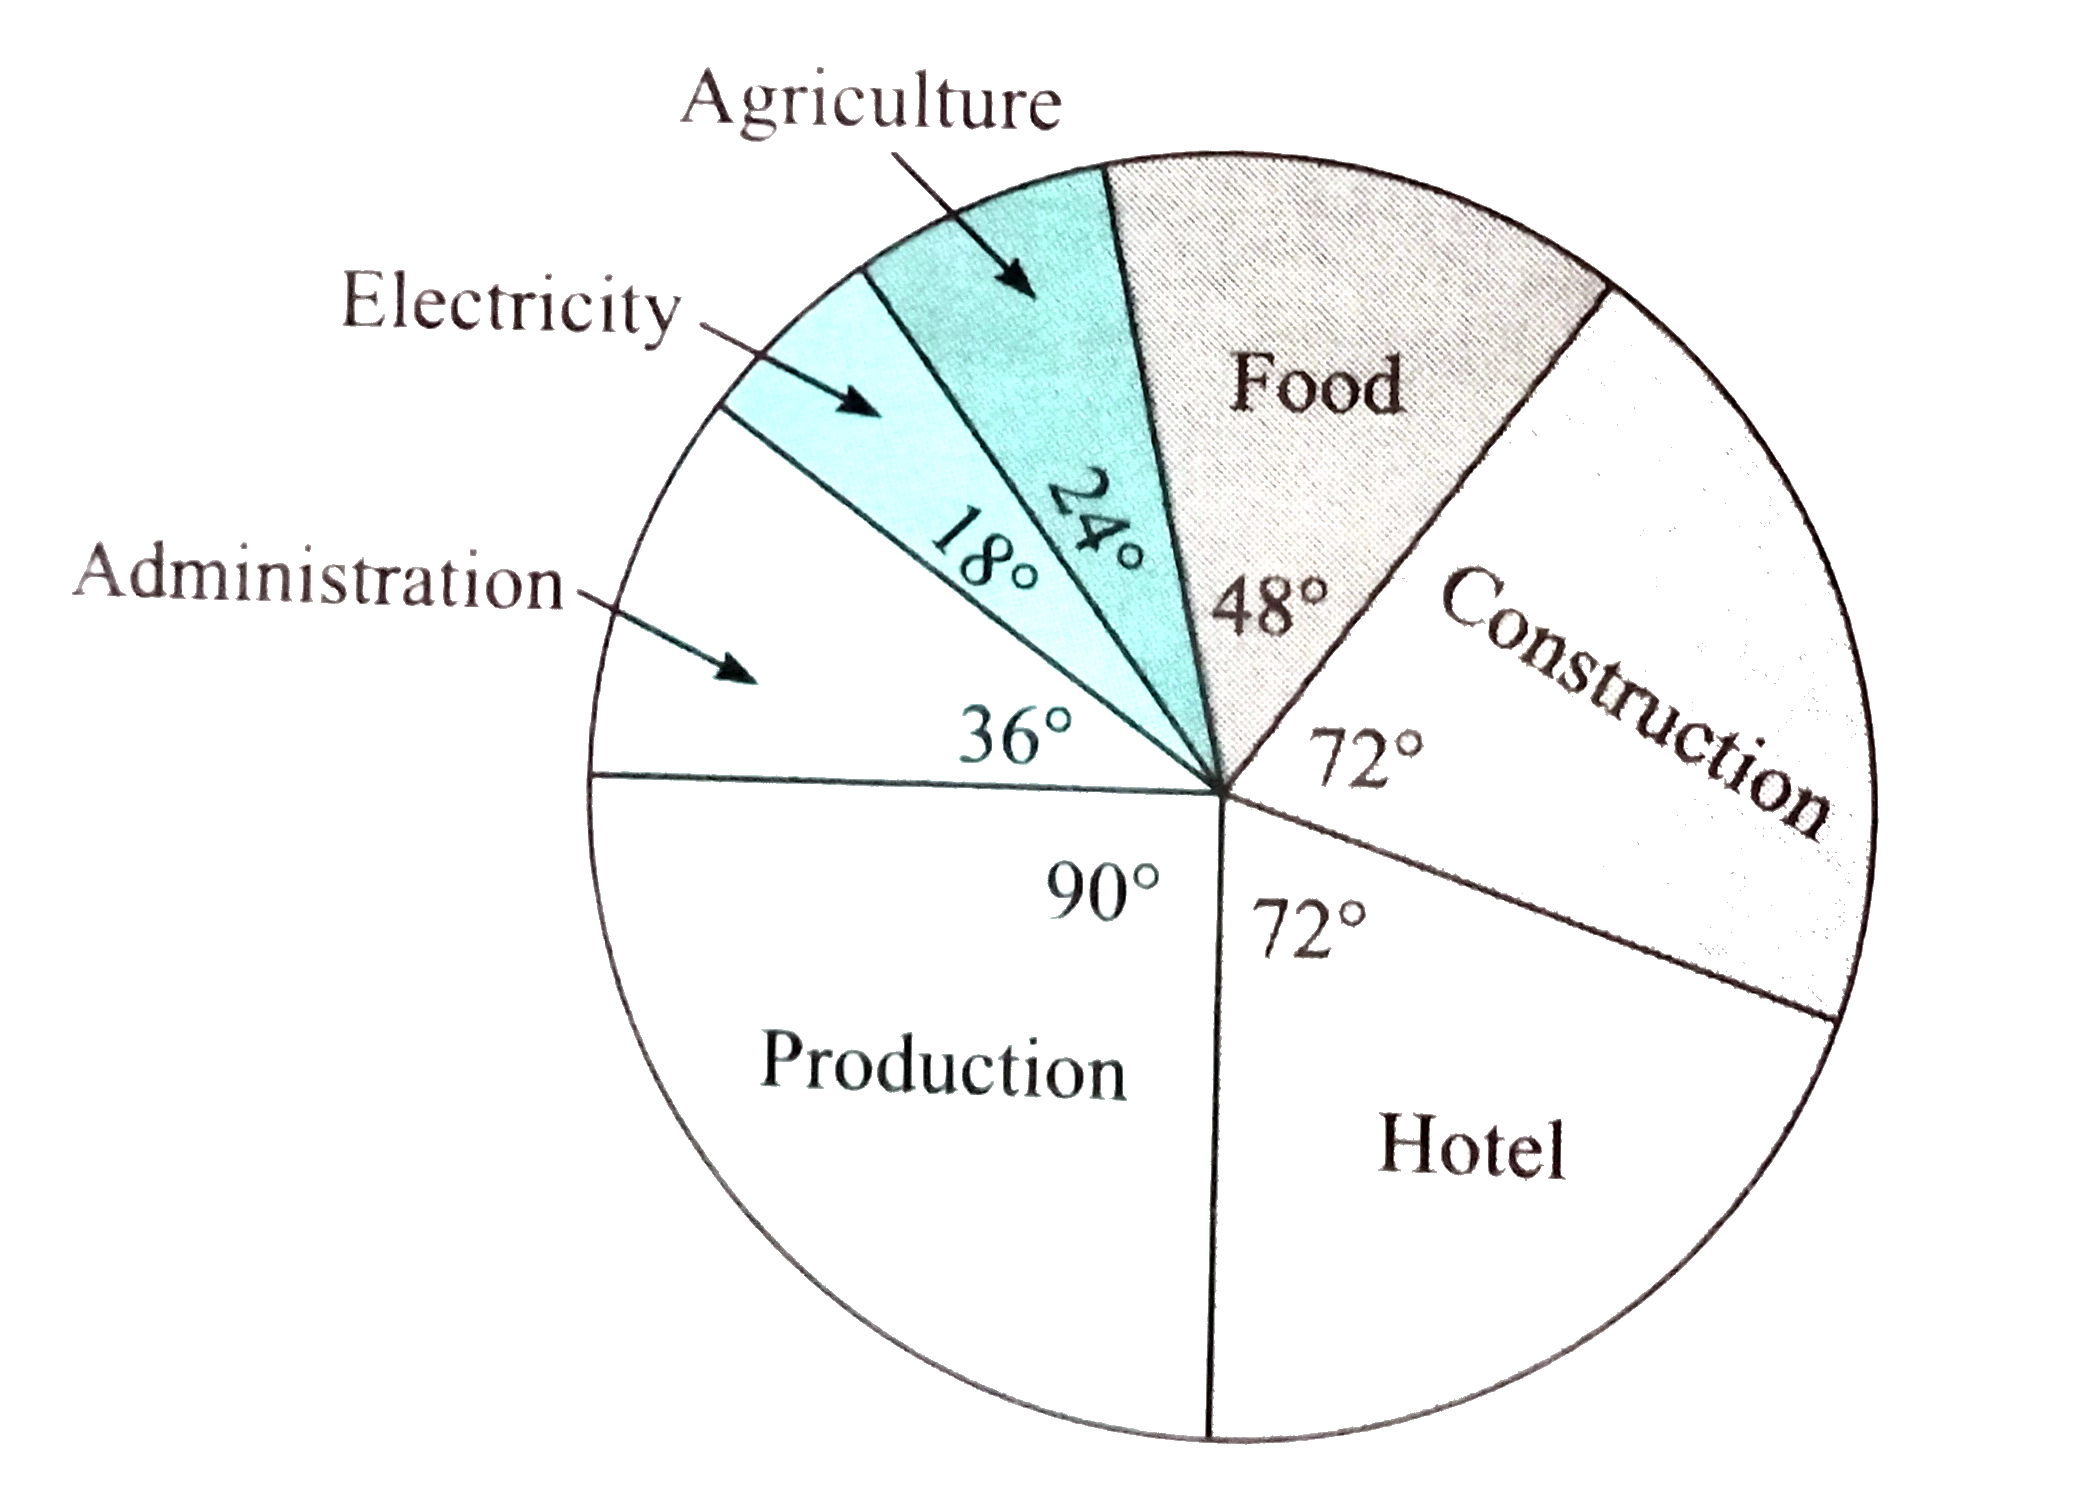
(1) If the total number of workers is 10,000, how many of them are in the field of construction ?
(2) How many workers are working in the administration ?
(3) What is the percentage of workers in the production ?
View SolutionStudy the graph and answer the question
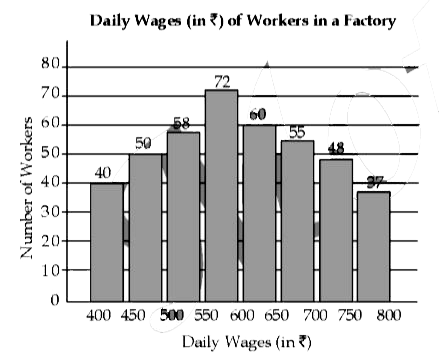
The number of workers in the factory whose daily wages are Rs 450 or more but less than Rs 600 is
View SolutionAs deduced from a survey, the classification of skilled workers is shown in the pie diagram. If the number of workers in the production sector is 4500, answer the following questions.
i. What is the total number of skilled workers in all fields?
ii. What is the number of skilled workers in the field of constructions ?
iii. How many skilled workers are in agriculture?
iv. Find the difference between the number of workers in the field of production and construction.
View SolutionLook at the bar graph and answer the following questions.
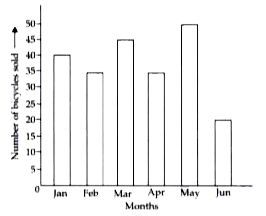
How many less bicycles sold in June than in March?
View SolutionStudy the graph and answer the question
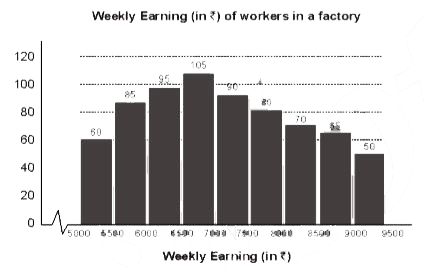
the number of workers in the factory whose weekly earnings are below Rs 5500 or more but less than Rs 7500 is
View SolutionThe pie diagram in the given figure shows the proportions of different workers in a town. Answer the following questions with its help.
i. If the total workers is 10000, how many of them are in the field of construction?
ii. How many workers are working in the administration?
iii. What is the percentage of workers in production
View SolutionStudy the graph and answer the question that follows
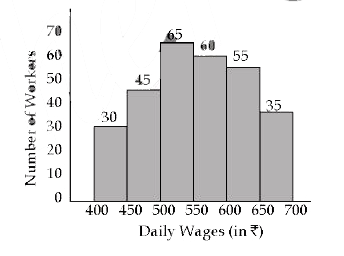
What is the ratio of the total number of workers whose daily wages are less than Rs 500 to the total number of workers whose daily wages are Rs 600 and above?
View Solution
