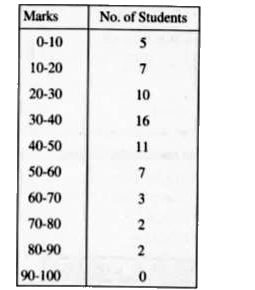
Draw a histogram for the marks of students given below:

Text Solution
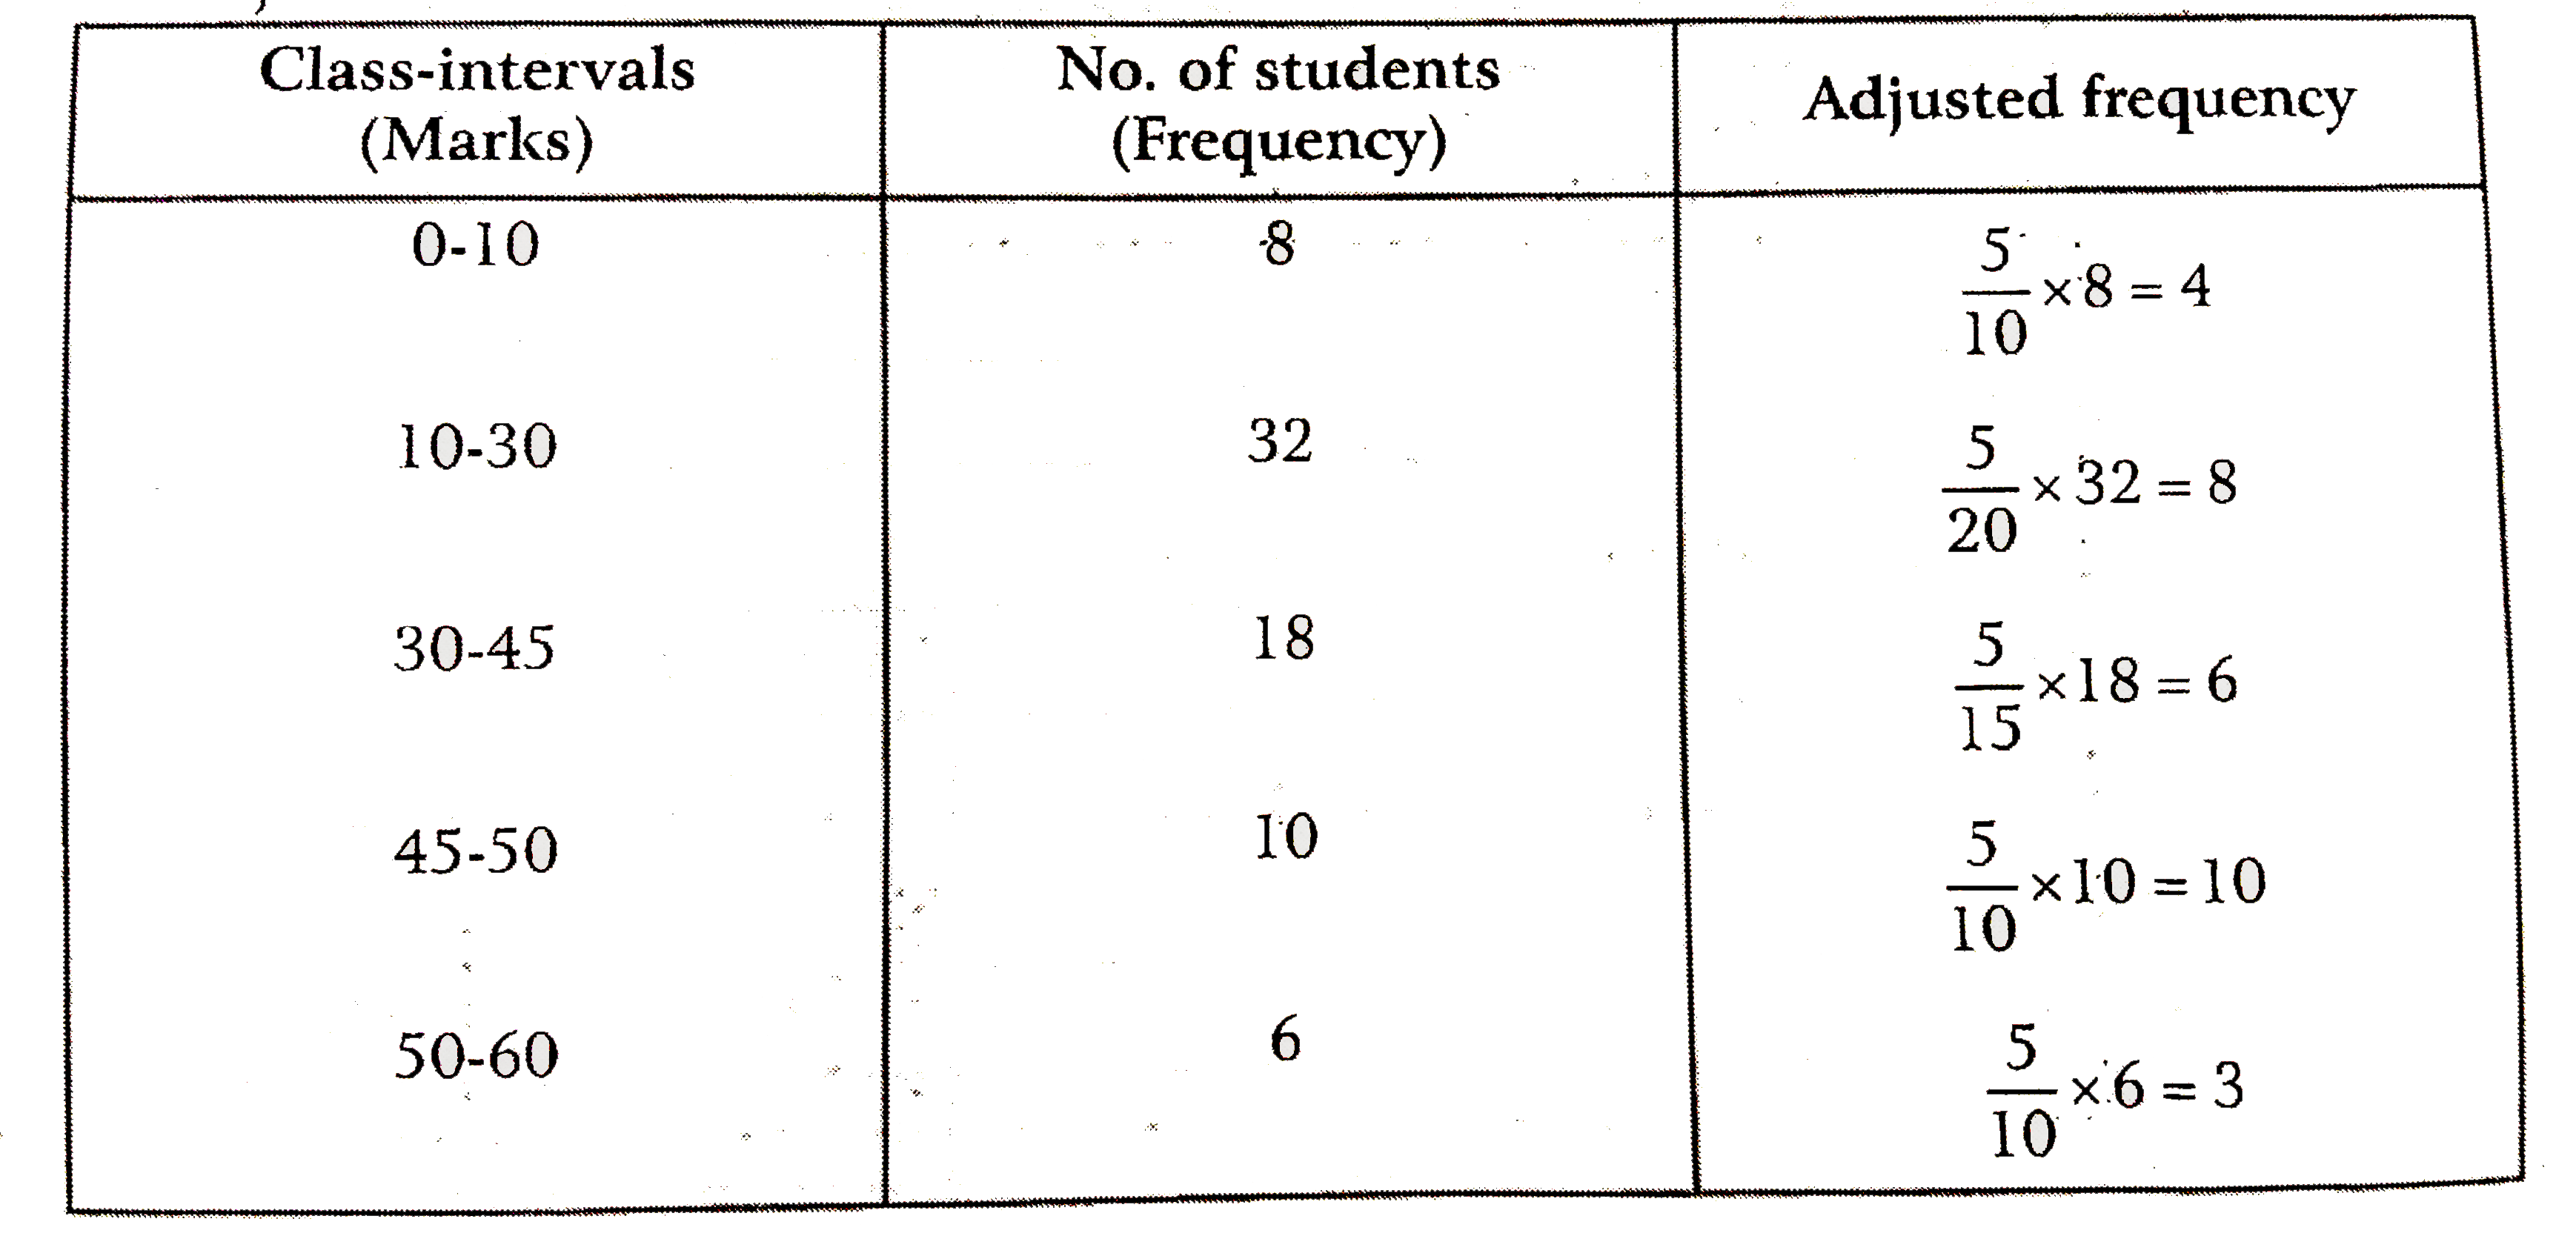
Here, minimum class-size = 5. So, we adjust the frequencies by using the following formula:
Adjusted frequency of a class =Minimum class-sizecalss-size×frequency of the class
The adjusted frequencies are computed as follows:

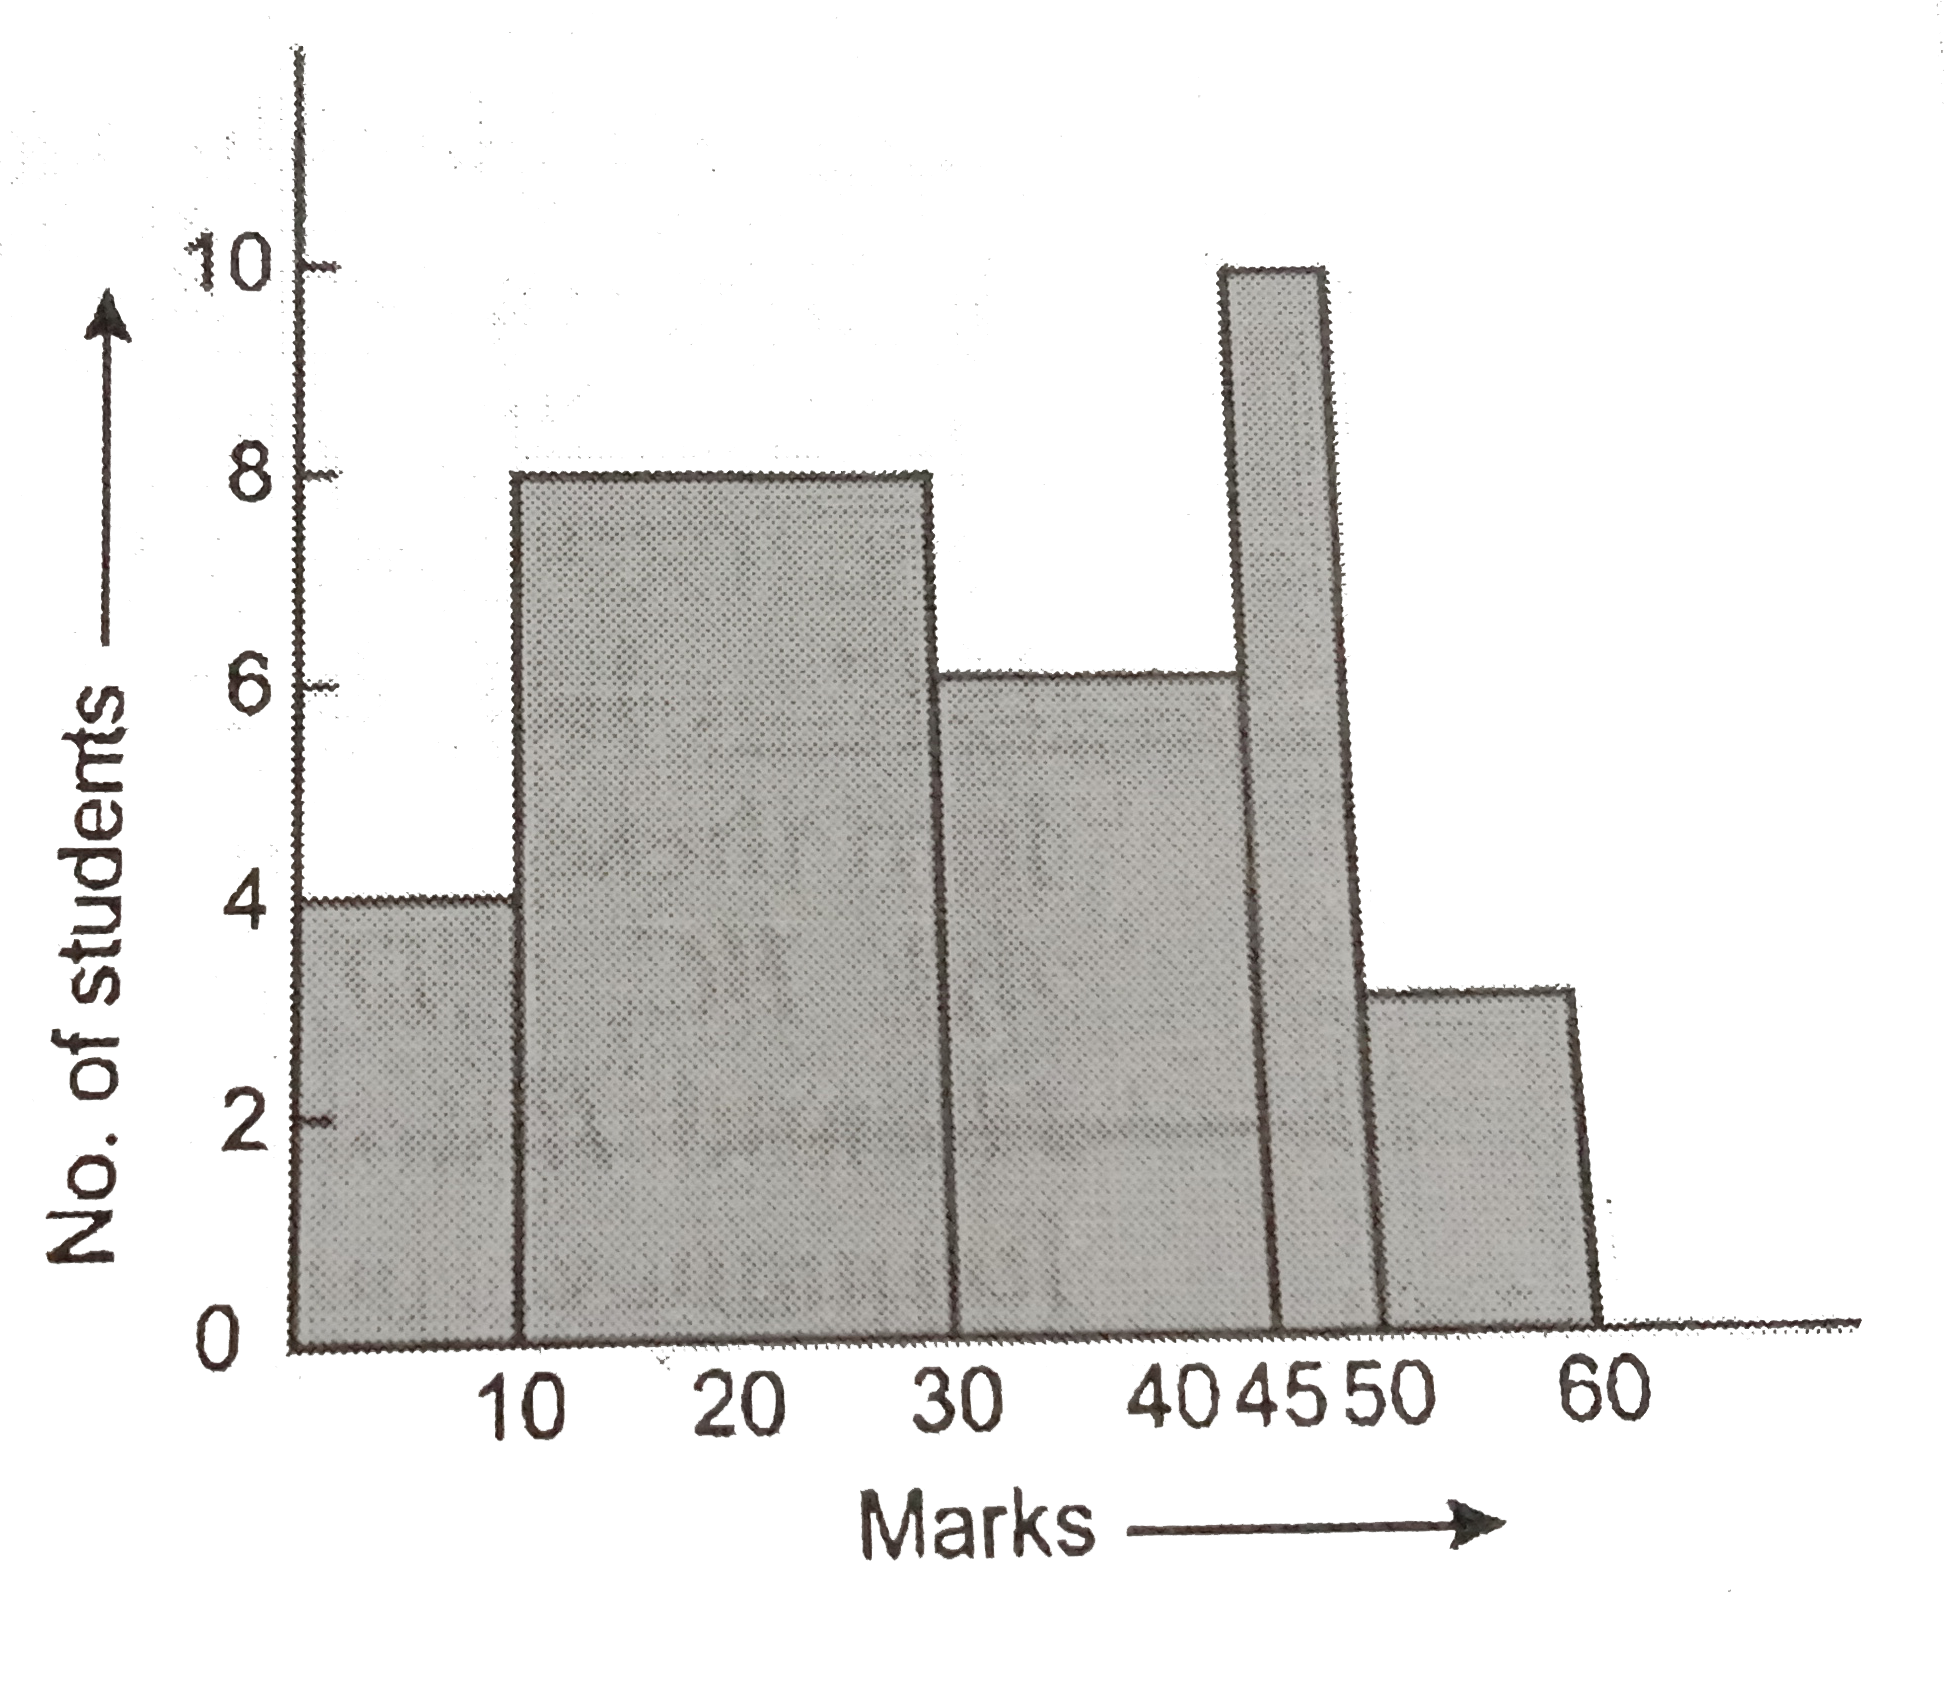
Now, we construct rectangles with class-limits as bases and respective adjusted frequencies as heights.

|
Topper's Solved these Questions
- STATISTICSBOOK - NAGEEN PRAKASHANCHAPTER - STATISTICSEXERCISE - Problems From NCERT/exemplar
22 Videos
- STATISTICSBOOK - NAGEEN PRAKASHANCHAPTER - STATISTICSEXERCISE - Exercise 14a
10 Videos
- QUADRILATERALSBOOK - NAGEEN PRAKASHANCHAPTER - QUADRILATERALSEXERCISE - Revision Exercise (long Answer Questions)
5 Videos
- SURFACE AREA AND VOLUMEBOOK - NAGEEN PRAKASHANCHAPTER - SURFACE AREA AND VOLUMEEXERCISE - Revision Exercise (long Answer Questions)
10 Videos
Similar Questions
Knowledge Check
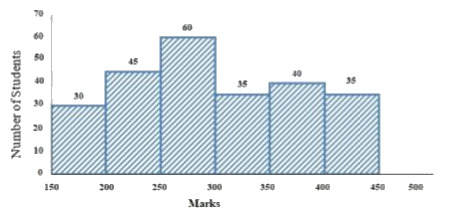
Study the given histogram that shows the marks obtained by students in examination and answer the question that follows

The number of students who obtained less than 200 marks is :AA)45BB)135CC)30DD)75
Draw a histogram for the following data:

View SolutionDraw a histogram for the following data:

View SolutionDraw a histogram for the following data:

View SolutionDraw a histogram for the following data:

View SolutionDraw a histogram of the following data

View SolutionCalculate the quartile deviation of the marks of 63 students in statistics given below :

View SolutionDraw a histogram of the following data.

View Solution


