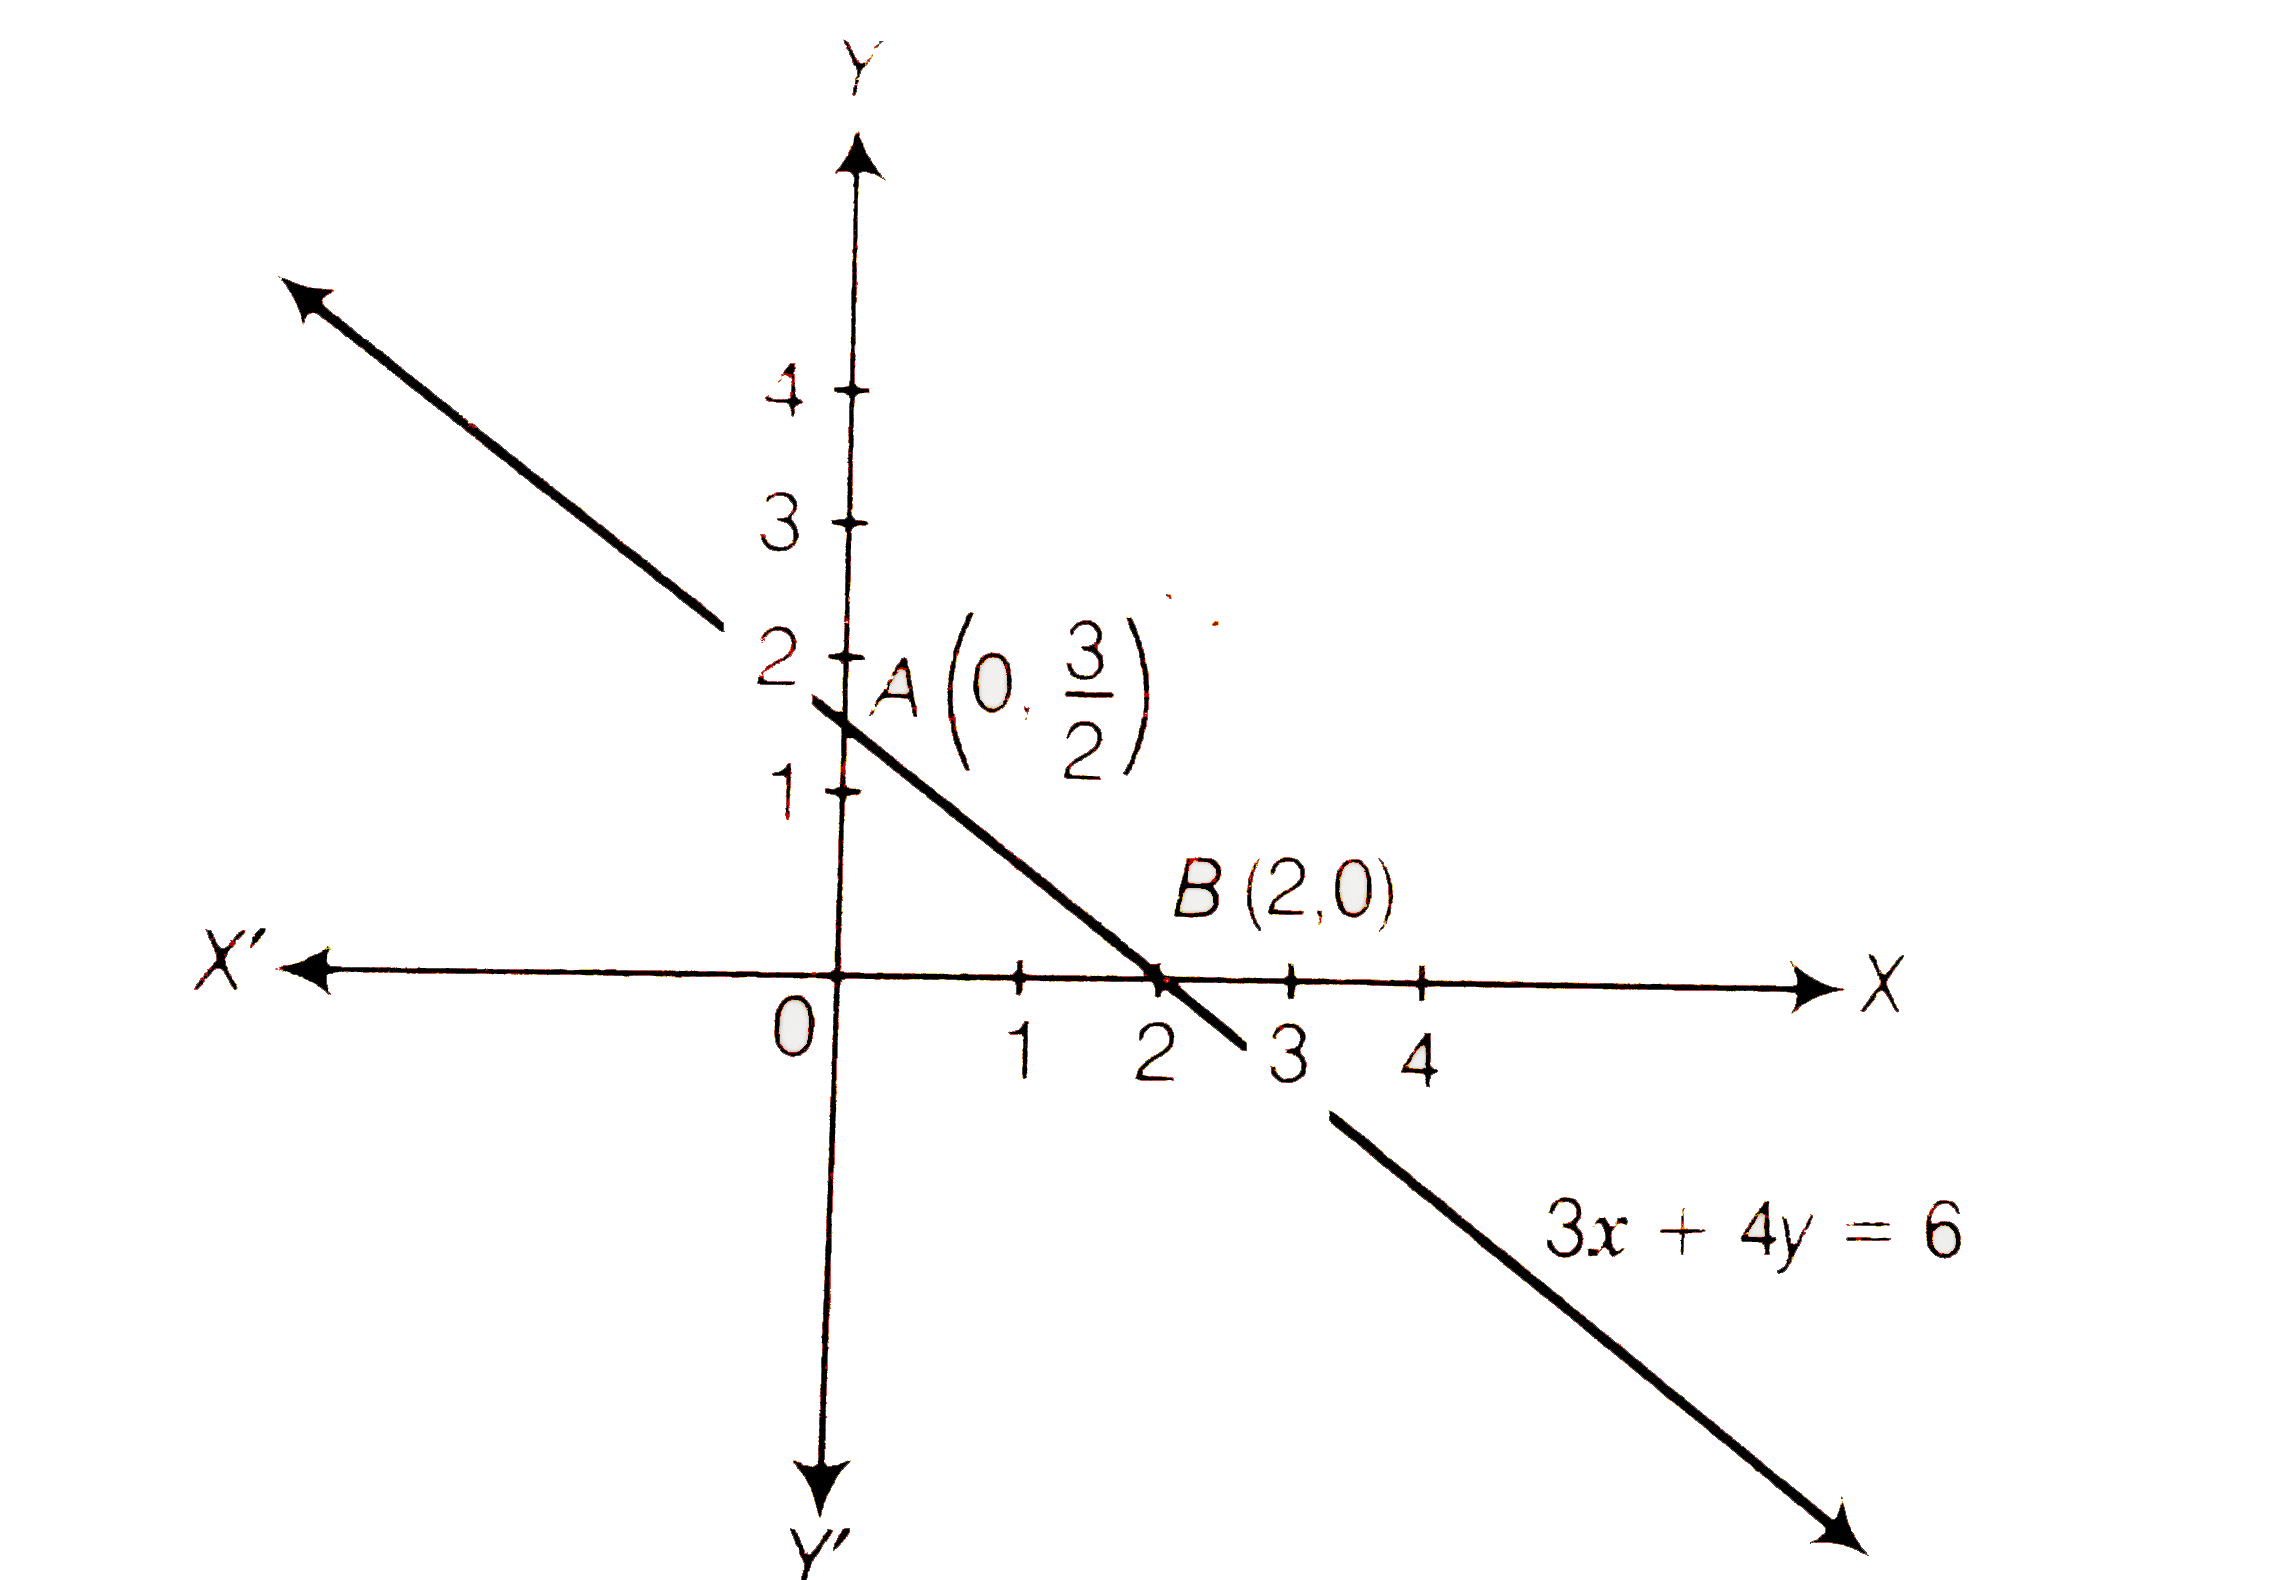
Draw the graph of the linear equation 3x + 4y = 6. At what points, the graph cuts X and Y-axes ?
Video Solution
Text Solution
The given equation is 3x+4y=6. To draw the graph of this equation, we need atleast two points lying on the graph of
4y=6-3x
⇒ y=6−3x4
When x=2, then y=6−3×24=6−64=0
When x= 0, then y=6−3×04=64=32

Here, we find two points A(0,32) and B (2,0).
Now, plot the points A(0,32) and B (2, 0) and join them, to get the line AB. Line AB is the required graph.

You can see that the graph (line AB) cuts the X-axis at the point (2, 0) and the Y-axis at the point (0,32).
|
Topper's Solved these Questions
- LINEAR EQUATION IN TWO VARIABLESBOOK - NCERT EXEMPLAR ENGLISHCHAPTER - LINEAR EQUATION IN TWO VARIABLESEXERCISE - Exercise 4.5
1 Videos
- LINEAR EQUATION IN TWO VARIABLESBOOK - NCERT EXEMPLAR ENGLISHCHAPTER - LINEAR EQUATION IN TWO VARIABLESEXERCISE - Exercise 4.6
1 Videos
- LINEAR EQUATION IN TWO VARIABLESBOOK - NCERT EXEMPLAR ENGLISHCHAPTER - LINEAR EQUATION IN TWO VARIABLESEXERCISE - Exercise 4.3
11 Videos
- INTRODUCTION TO EUCLID GEOMETRYBOOK - NCERT EXEMPLAR ENGLISHCHAPTER - INTRODUCTION TO EUCLID GEOMETRYEXERCISE - Exercise 5.4 Long Answer Type Questions
5 Videos
- LINES AND ANGLES BOOK - NCERT EXEMPLAR ENGLISHCHAPTER - LINES AND ANGLES EXERCISE - MULTIPLE CHOICE QUESTIONS
34 Videos
Similar Questions
Draw the graph of the equation x−y=0.
View SolutionDraw the graph of the equation 2x+y=3
View SolutionDraw the graph of the equation y−x=2
View SolutionDraw the graph of y=|x|
View SolutionDraw the graph of y=3x−4
View SolutionDraw the graph of y=3sin2x
View SolutionThe graph of the linear equation 2x−y=4 cuts x-axis at
View SolutionThe graph of the linear equation y=x passes through the point
View SolutionDraw the graph of y=tan(3x).
View SolutionDraw a graph of the equation: x=−2y
View Solution
