Draw the graph of y=x−1x−2. Solution in Tamil
We have y=f(x)=(x−1)(6x−1)2x−1.
The domain of the function is R−{1/2}.
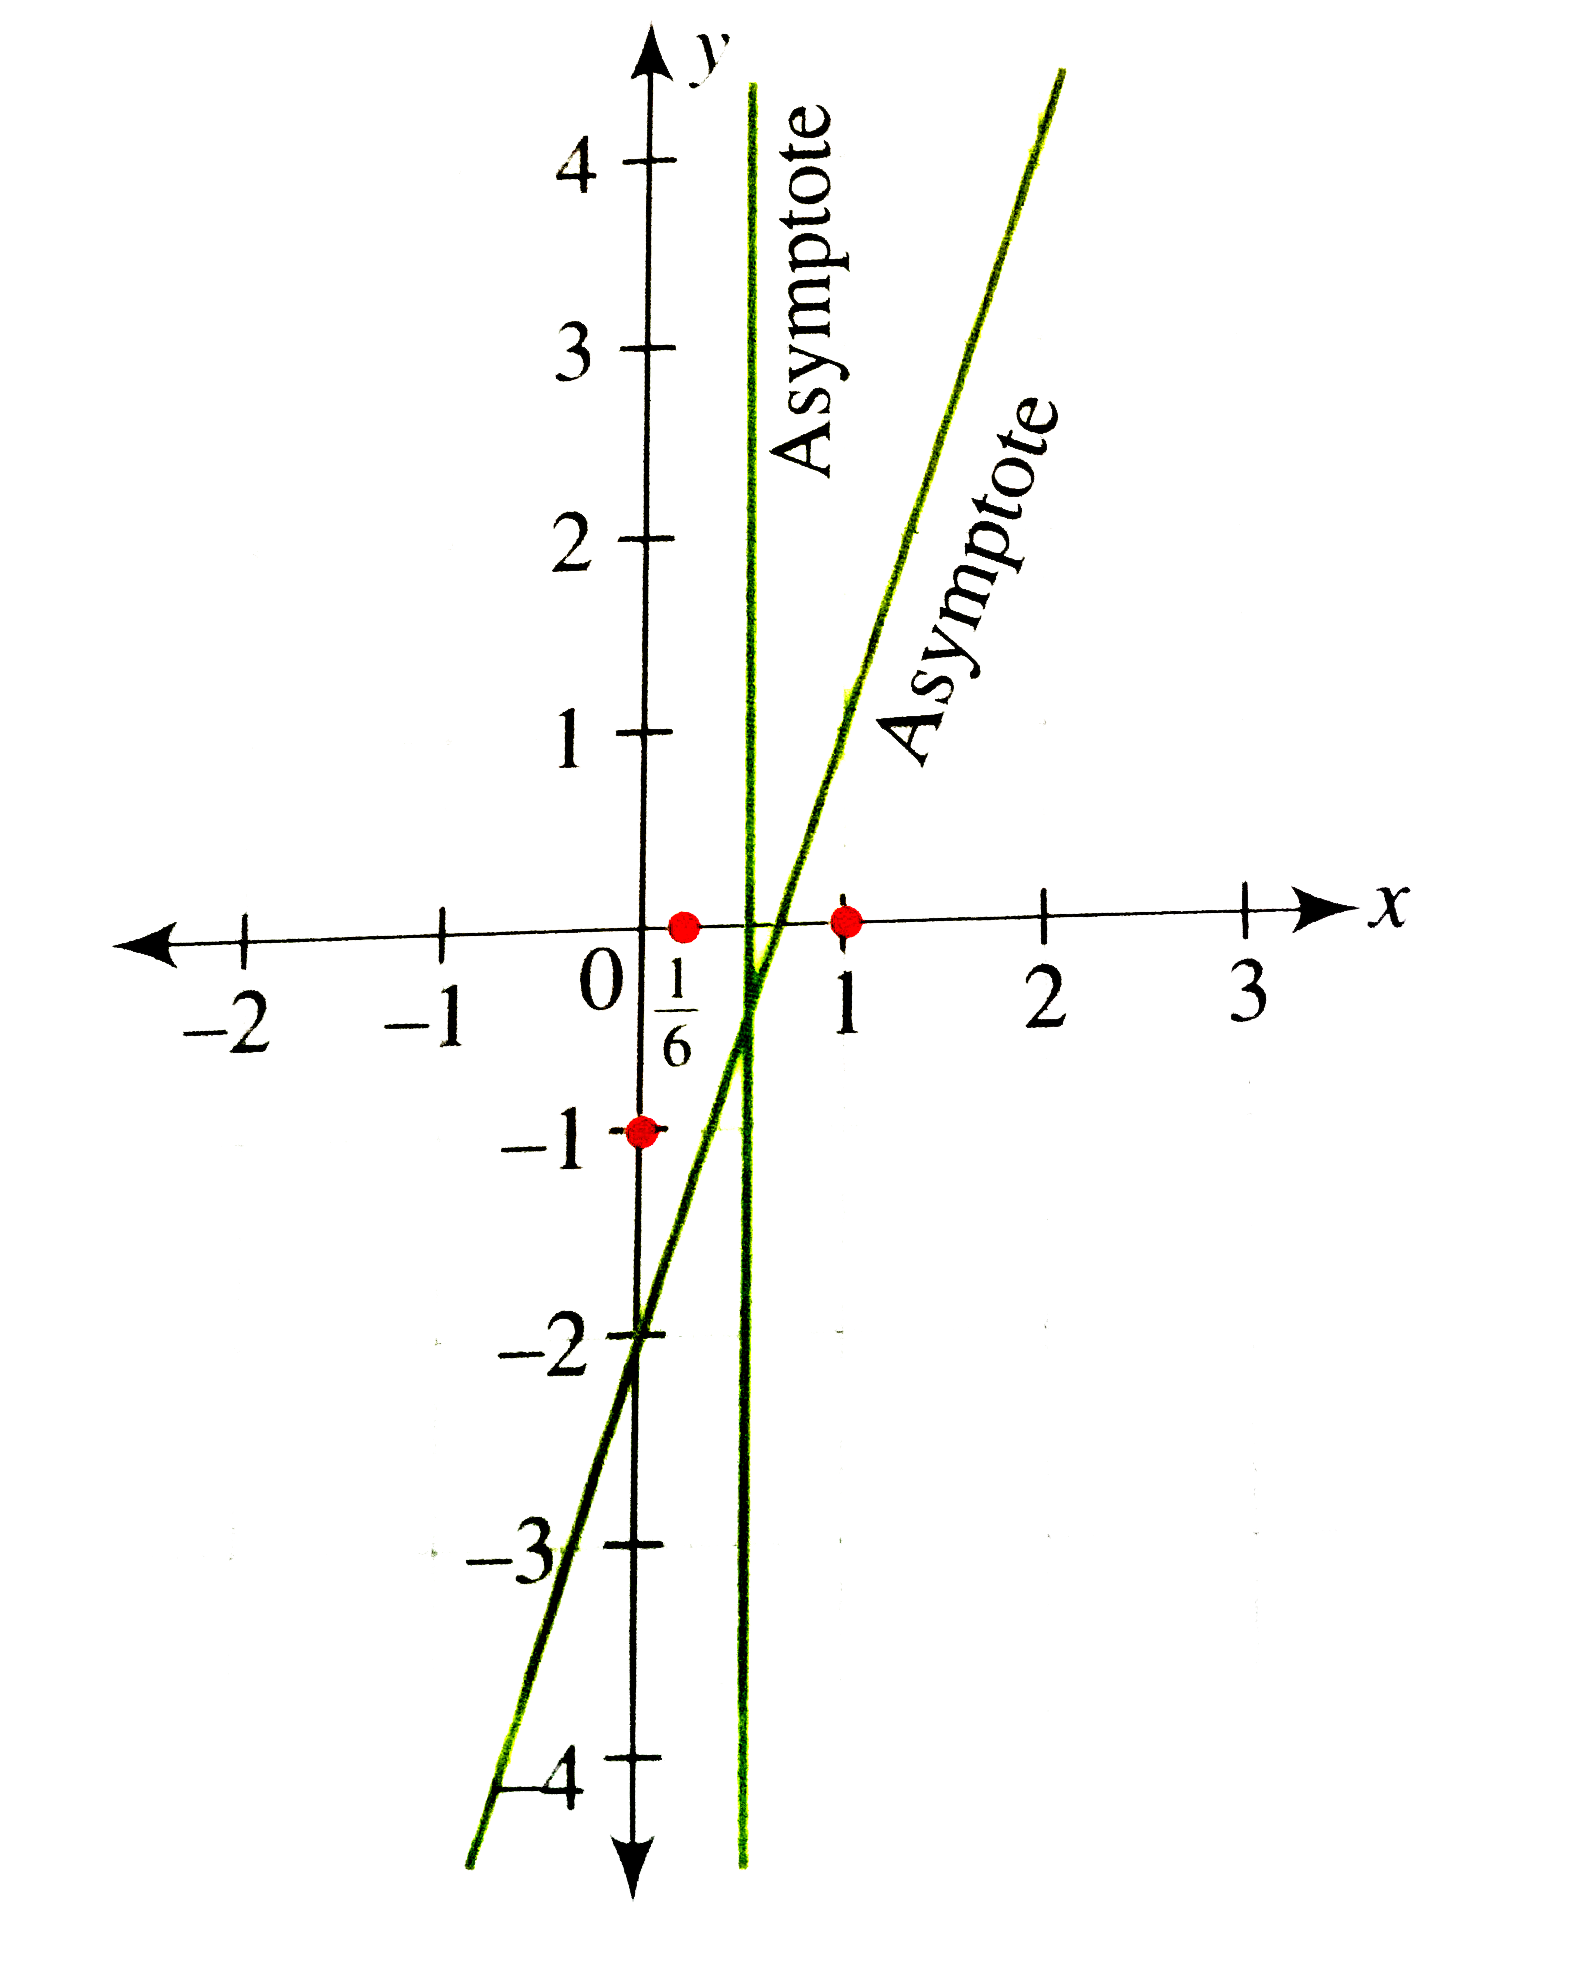
1. y-intercept f(0)=1 So the graph cuts the y-axis at (0,-1).
2. x-intercept (zeros)
Put y=0 or (x−1)(6x−1)=0
So the graph meets the x-axis at (1/6,0) and (1,0).
3. Asymptotes
Vertical asymptotes
Clearly, the graph has vertical asymptote x = 1/2, where the denominator becomes zero.
Horizontal asymptotes Clearly, the graph has no horizontal asymptote.
Oblique asymptotes
y=6x2−7x+12x−1
=3x−2−12x−1
Thus, important points and lines are as follows.

4. Momotonicity/Extremum
f'(x)=(12x−7)(2x−1)−2(6x2−7x+1)(2x−1)2
=(12x2−12x+5)(2x−1)2>0,∀x∈R−{1/2}
Hence the function is increasing throughout.
limx→−∞(x−1)(6x−1)2x−1=−∞ and limx→1−2(x−1)(6x−1)2x−1=∞
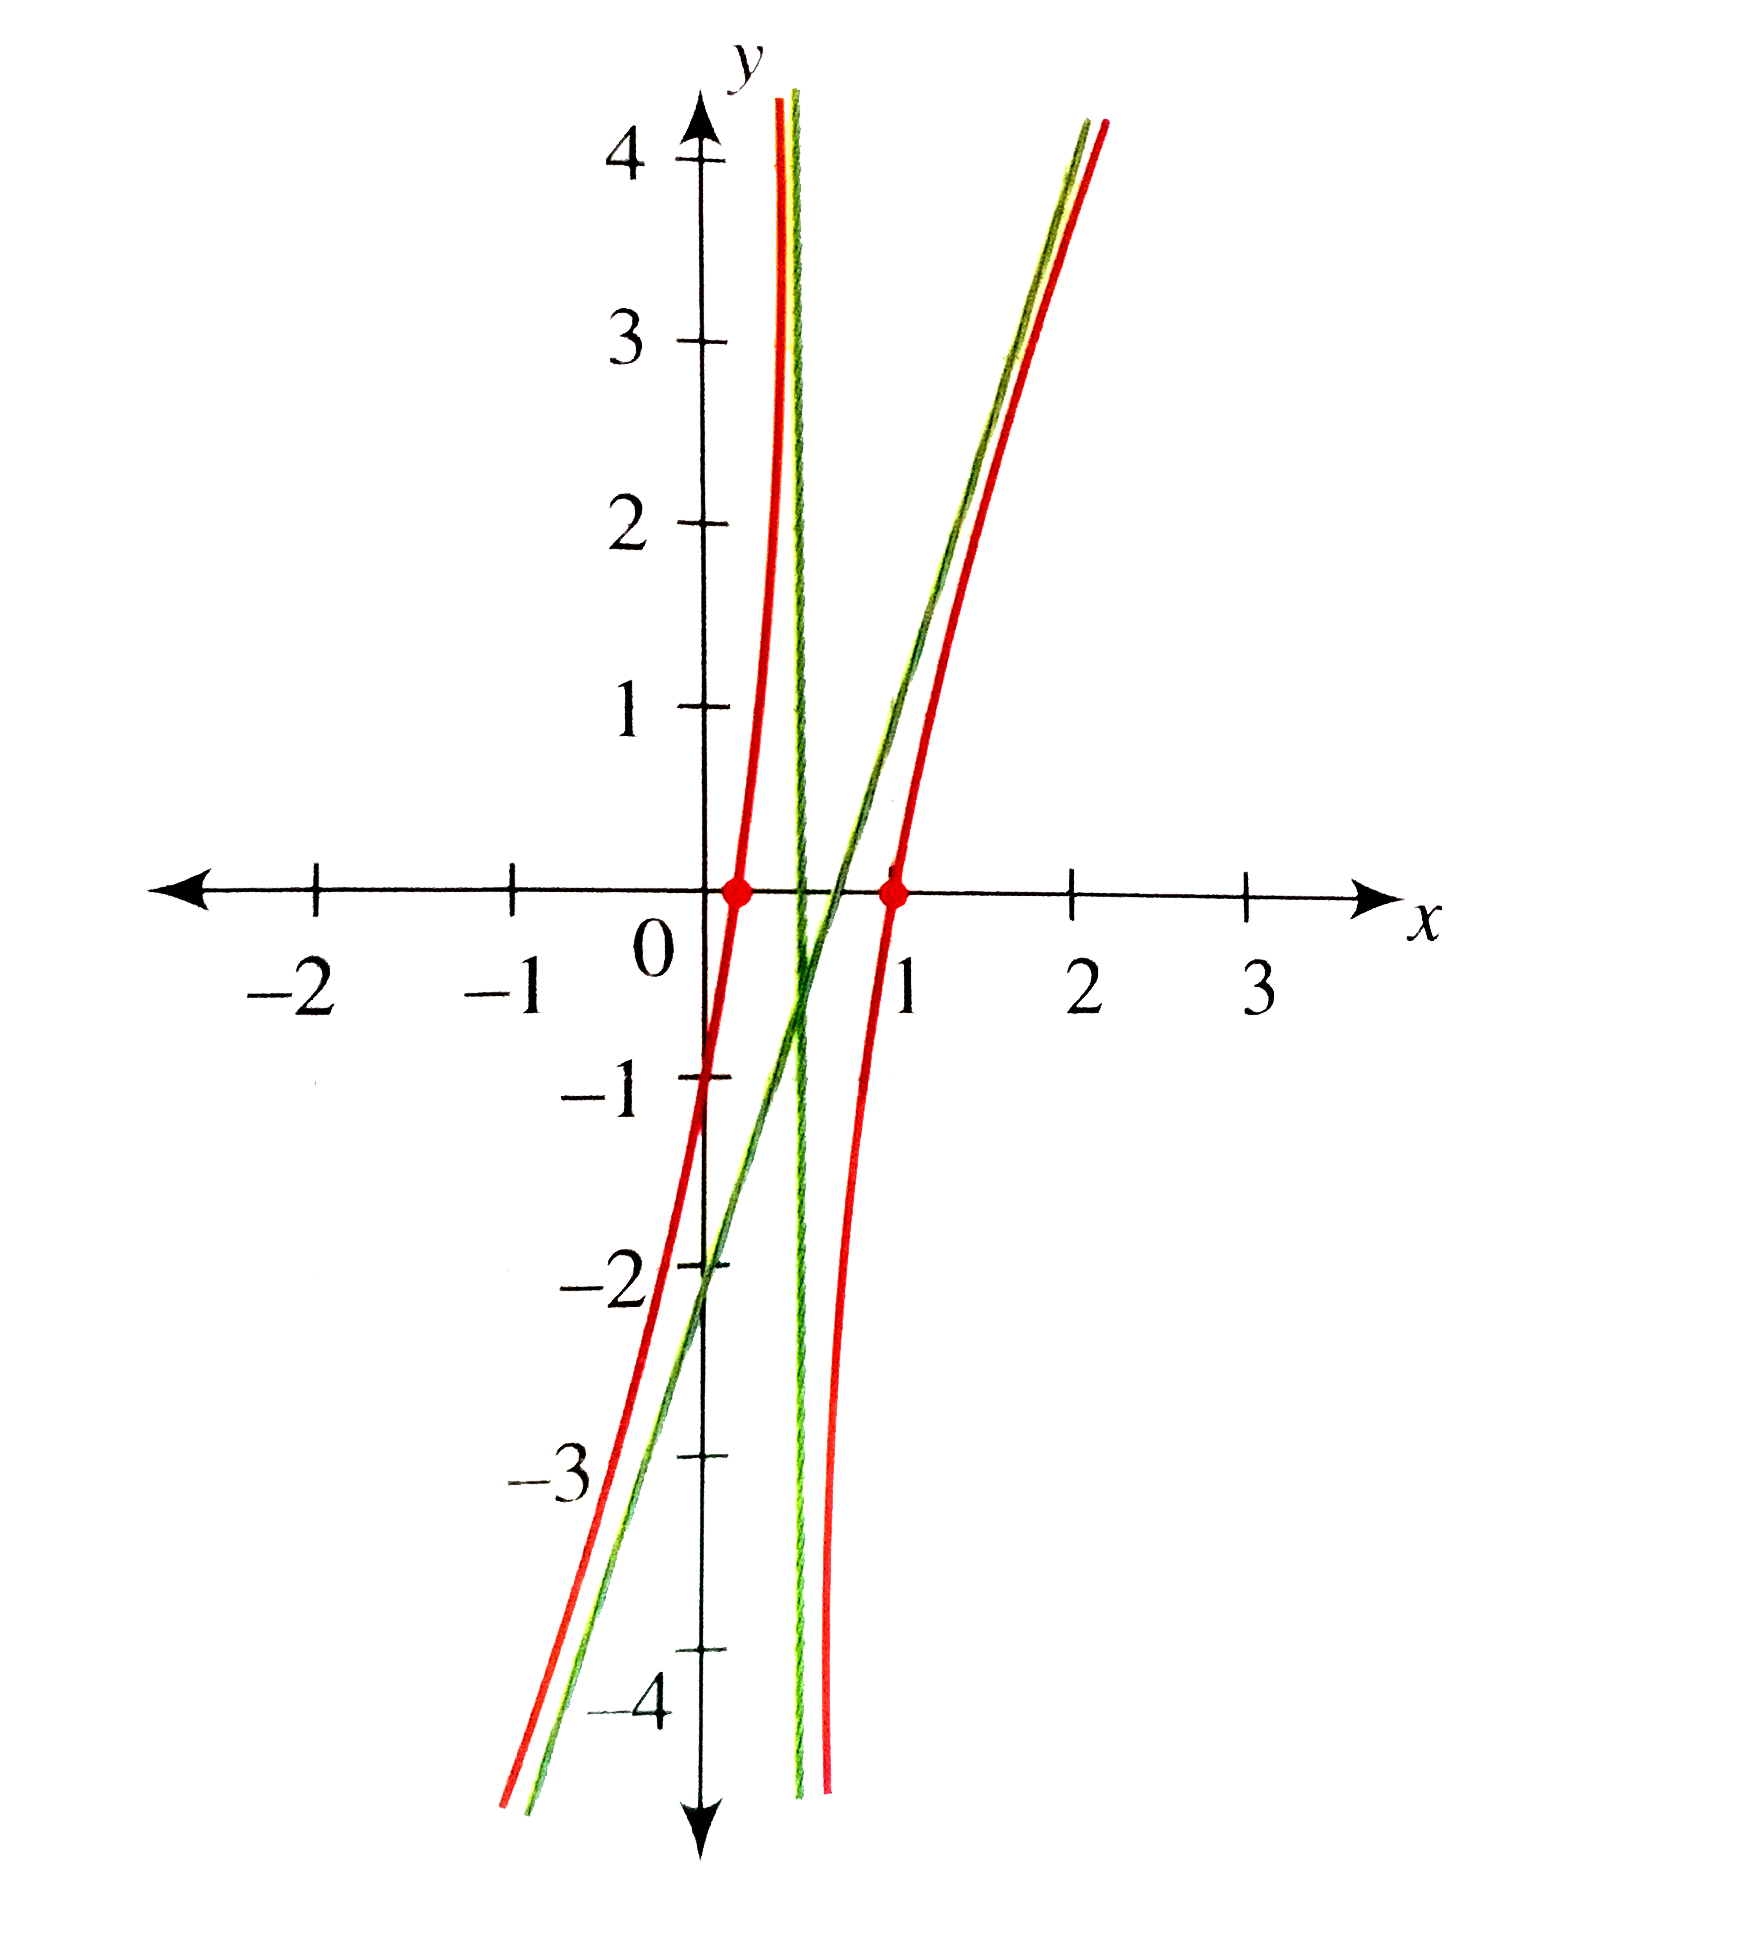
Thus, f(x) increases from −∞ to ∞ when x increases from −∞ to 1/2 crossing the x-axis at (1/6,0) and approaching asymptote y=3x−2 to the left of it.
limx→1+2(x−1)(6x−1)2x−1=−∞ and limx→∞(x−1)(6x−1)2x−1=∞
Thus, f(x) increases from −∞ to ∞ when x increases from 1/2 to ∞ crossing the x-axis at (1,0) . f(x) approaches asymptote y=3x−2 to the right of the asymptote.
Hence the graph of y=f(x) can be drawn as shown in the following figure.

Topper's Solved these Questions
- BOOK - CENGAGECHAPTER - GRAPHS OF POLYNOMIAL AND RATIONAL FUNCTIONSEXERCISE - Exercise13videos
GRAPHS OF POLYNOMIAL AND RATIONAL FUNCTIONS
- BOOK - CENGAGECHAPTER - GRAPHS OF POLYNOMIAL AND RATIONAL FUNCTIONSEXERCISE - Exercises4videos
GRAPHS OF POLYNOMIAL AND RATIONAL FUNCTIONS
- BOOK - CENGAGECHAPTER - GRAPHICAL TRANSFORMATIONSEXERCISE - Exercise14videos
GRAPHICAL TRANSFORMATIONS
- BOOK - CENGAGECHAPTER - GRAPHS OF ELEMENTARY FUNCTIONS EXERCISE - Exercise34videos
GRAPHS OF ELEMENTARY FUNCTIONS
Similar Questions
Draw the graph of y=(x−1)(x2−x+1).
06:20View SolutionSketch the graph of an example of a rational function f that satisfies all the given conditions.
(i) f(0)=0,f(1),limx→∞f(x)=0,f is odd
(ii) limx→0+f(x)=∞,limx→0−f(x)=−∞,limx→∞f(x)=1,limx→−∞f(x)=1
(iii) limx→−2f(x)=∞,limx→−∞f(x)=3,limx→∞f(x)=3,f(0)=001:33View SolutionDraw the graph of y=tan−1x−cot−1x.
04:14View SolutionDraw the graph of y=1(1/x).
02:16View SolutionDraw graph of |x-1|=y^(2)+1
01:18View SolutionDraw the graph of y=∣∣∣1−1|x|−2∣∣∣.
01:32View SolutionDraw the graph of y=x−1x2 and hence the graph of y=|x−1|x2.
09:45View SolutionDraw graph of y=1x2−x.
02:16View SolutionDraw the graph of y=x−1x−2.
03:14View SolutionDraw the graph for |y|=(x−1)(x−2).
03:03View SolutionDraw the graph of y=∣∣∣1−1|x|−2∣∣∣.
02:29View SolutionDraw the graph of y=x−1x2 and hence the graph of y=|x−1|x2.
01:35View SolutionDraw graph of y=1x2−x.
02:24View SolutionDraw the graph of y=x−1x−2.
03:59View SolutionDraw the graph for |y|=(x−1)(x−2).
01:39View SolutionDraw the graph of y=|1-(1)/(|x|-2)| .
11:15View Solution

