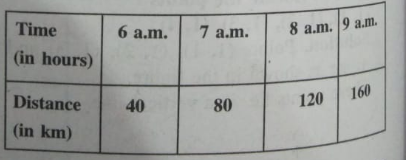
Draw the graphs for the following tables of value ,with suitable scales on the axes.
Distance travelled by a car.
What was the time when the car had covered a distance of 100 km,since it's start ?
 Solution in Punjabi
The correct Answer is:20 km
Step by step video, text & image solution for Draw the graphs for the following tables of value ,with suitable scales on the axes.Distance travelled by a car.What was the time when the car had covered a distance of 100 km,since it's start ? by Maths experts to help you in doubts & scoring excellent marks in Class 8 exams.
Updated on:21/07/2023Topper's Solved these Questions
- INTRODUCTION TO GRAPHS Book:SWAN PUBLICATIONChapter:INTRODUCTION TO GRAPHS Exercise:Exercise 15.2
Explore 8 Videos
- FACTORISATIONBook:SWAN PUBLICATIONChapter:FACTORISATIONExercise:EXERCISE 14.4
Explore 23 Videos
- LINEAR EQUATIONS IN ONE VARIABLE Book:SWAN PUBLICATIONChapter:LINEAR EQUATIONS IN ONE VARIABLE Exercise:EXERCISE 2.6
Explore 14 Videos
Similar Questions
Plot the following points on a graph sheet .Verify if they lie on a line.
A (4,0),B(4,2),C(4,6),D(4,2.5).
View SolutionFind and correct the errors in the following mathematical statement
4(x−5)=4x−5
View SolutionSolve the following equations. 8x−33x=2
View SolutionWhich of the following are correct chain isomers of butane ? (i)
View SolutionDetermine the point of symmetry of a regular hexagon.
View SolutionDtermine the images of the following figure about the given line :
View SolutionDraw the bisector of ∠AOB=58∘
ltimg src="https://d10lpgp6xz60nq.cloudfront.net/physics_images/PS_MATH_VII_C05_S01_009_Q01.png" width="80%"gt
View SolutionMatch the following Column A to Column B

View SolutionMatch the following Column A to Column B

View SolutionMatch the following Column A to Column B

View SolutionThe inequation represented by the graph given below is :
View SolutionThe inequation that best describes the graph given below is _________
View SolutionThe inequation that best describes the following graph is _________
View SolutionWhat is the distance OA for the square shown in figure :- ltimg src="https://d10lpgp6xz60nq.cloudfront.net/physics_images/ALN_PHY_R05_E01_015_Q01.png" width="80%"gt
View SolutionDraw the graphs for the following tables of values, with suitable scales on the axes.
Distance travelled by a car

What was the time when the car had covered a distance of 100 km since it's start?
View SolutionDraw the graphs for the following tables of value ,with suitable scales on the axes.
Distance travelled by a car.
What was the time when the car had covered a distance of 100 km,since it's start ?
View Solution