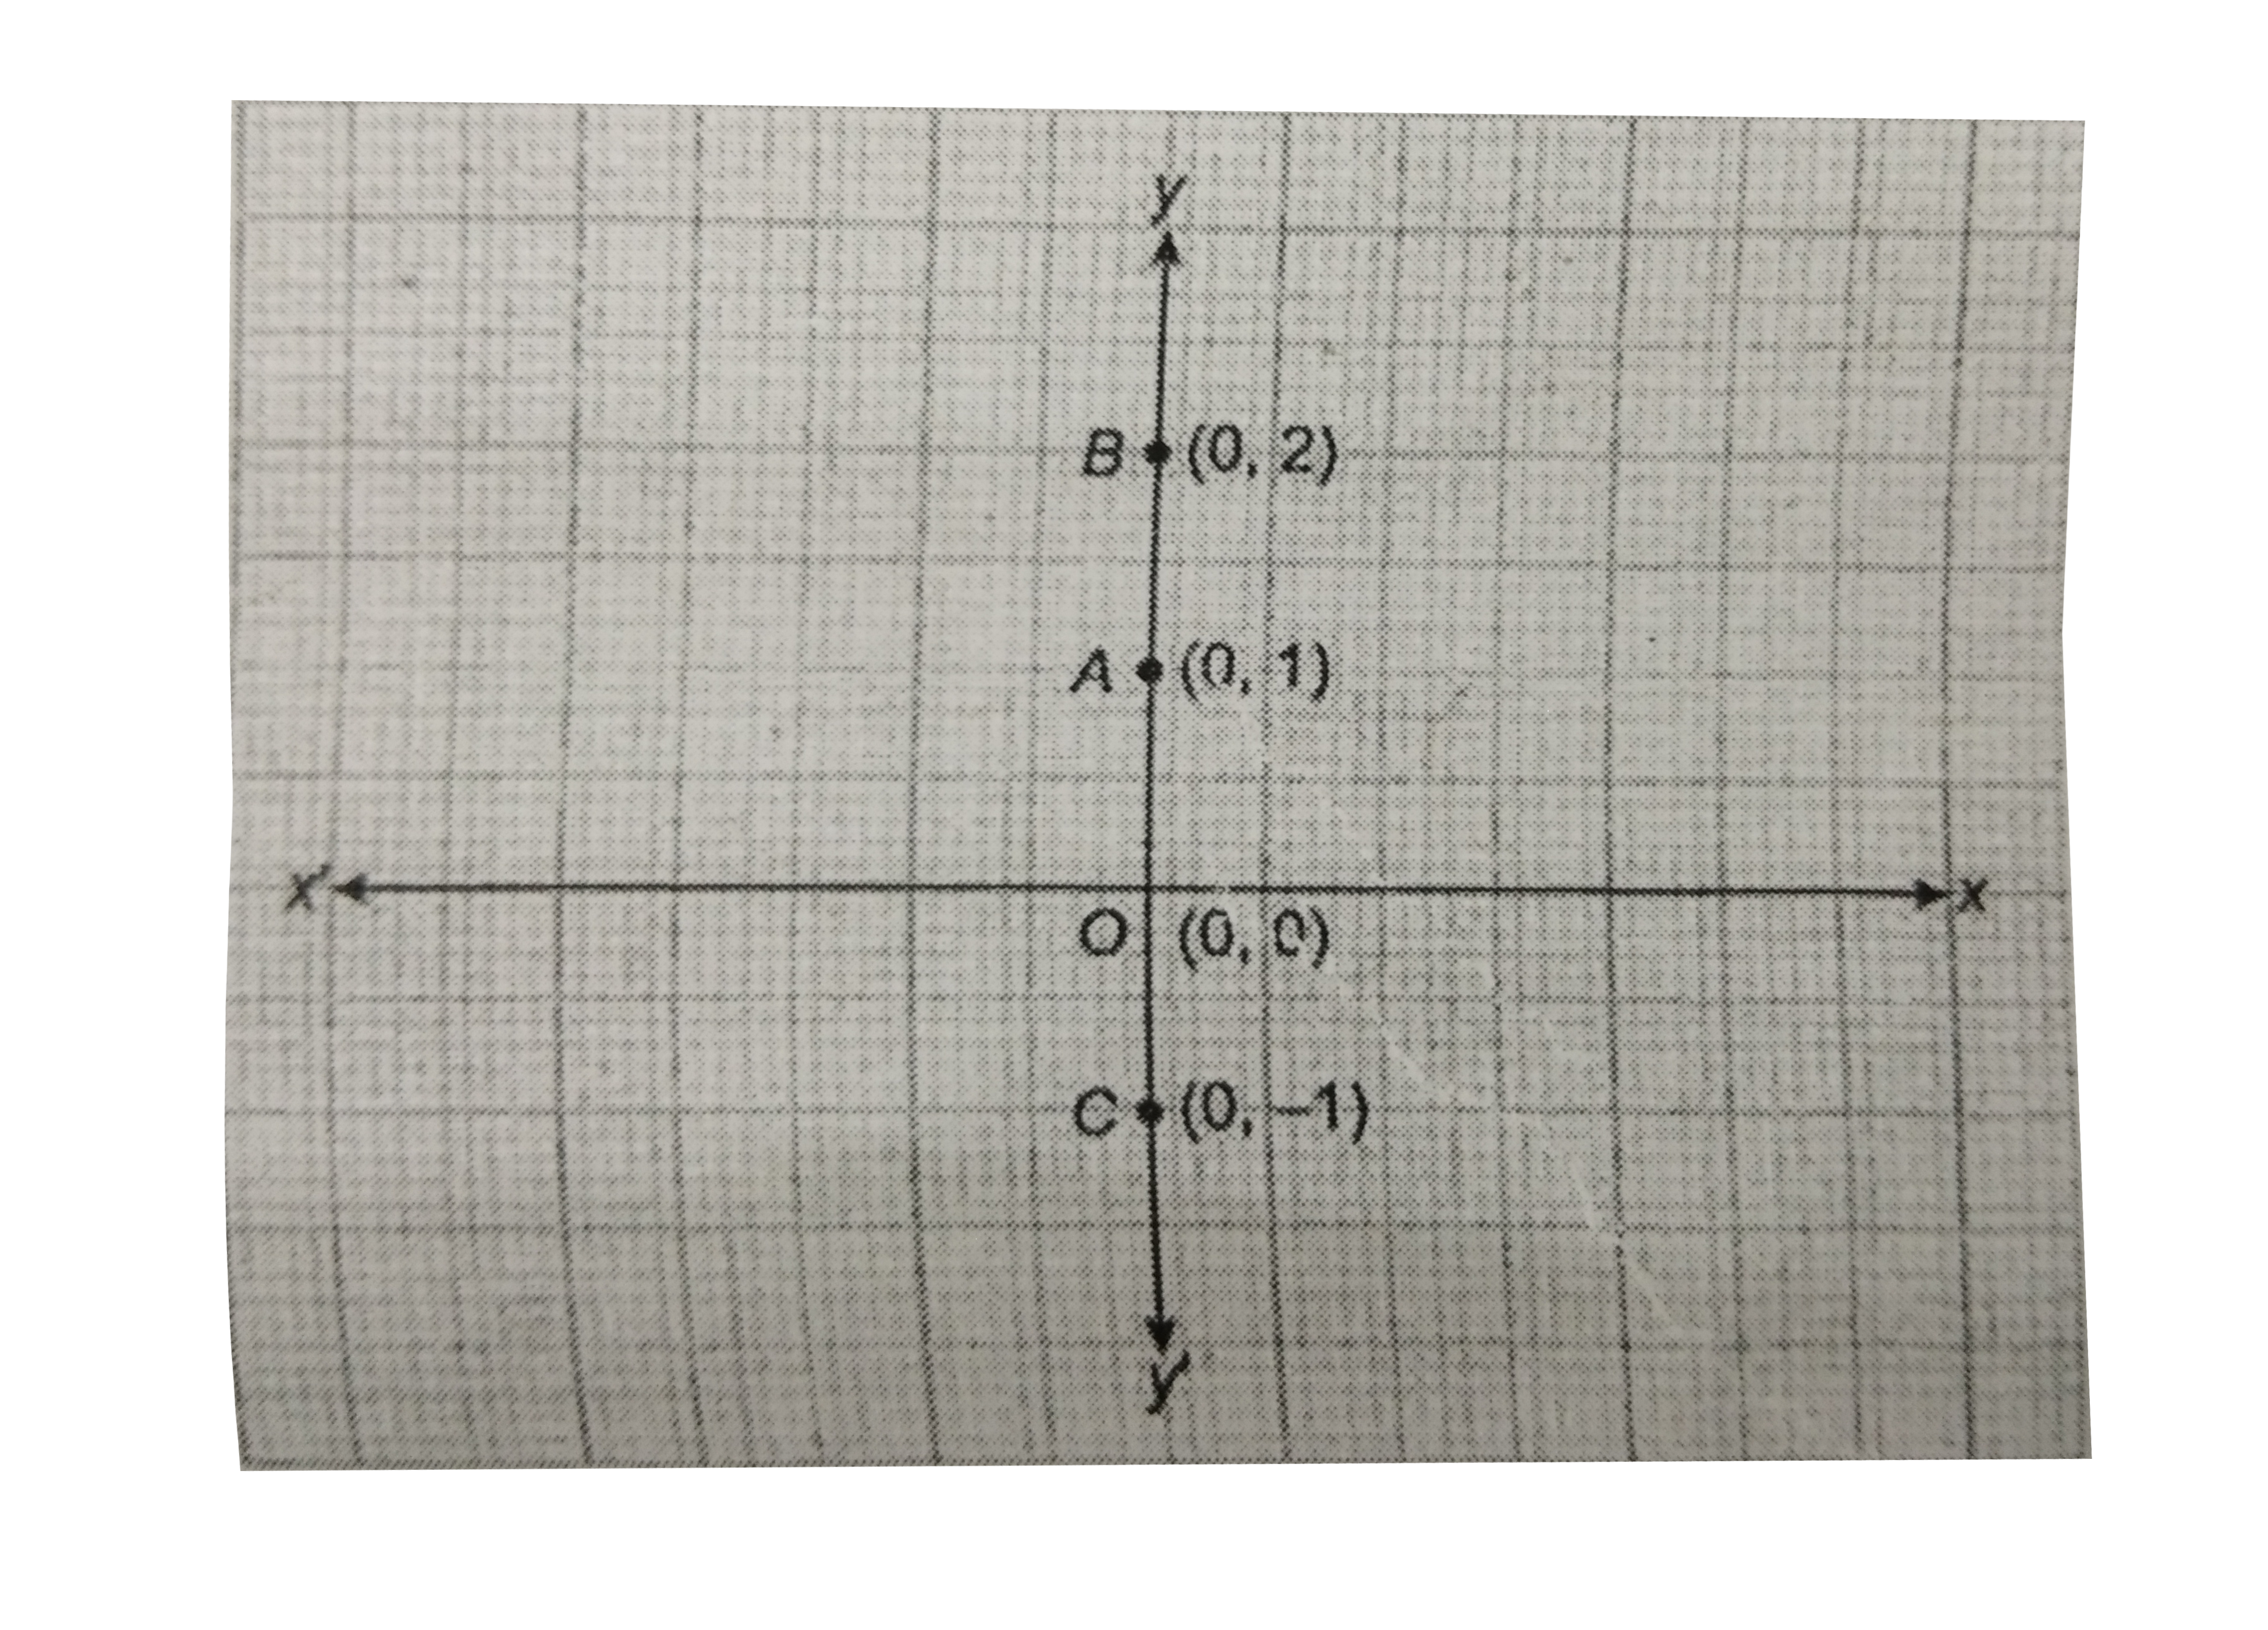
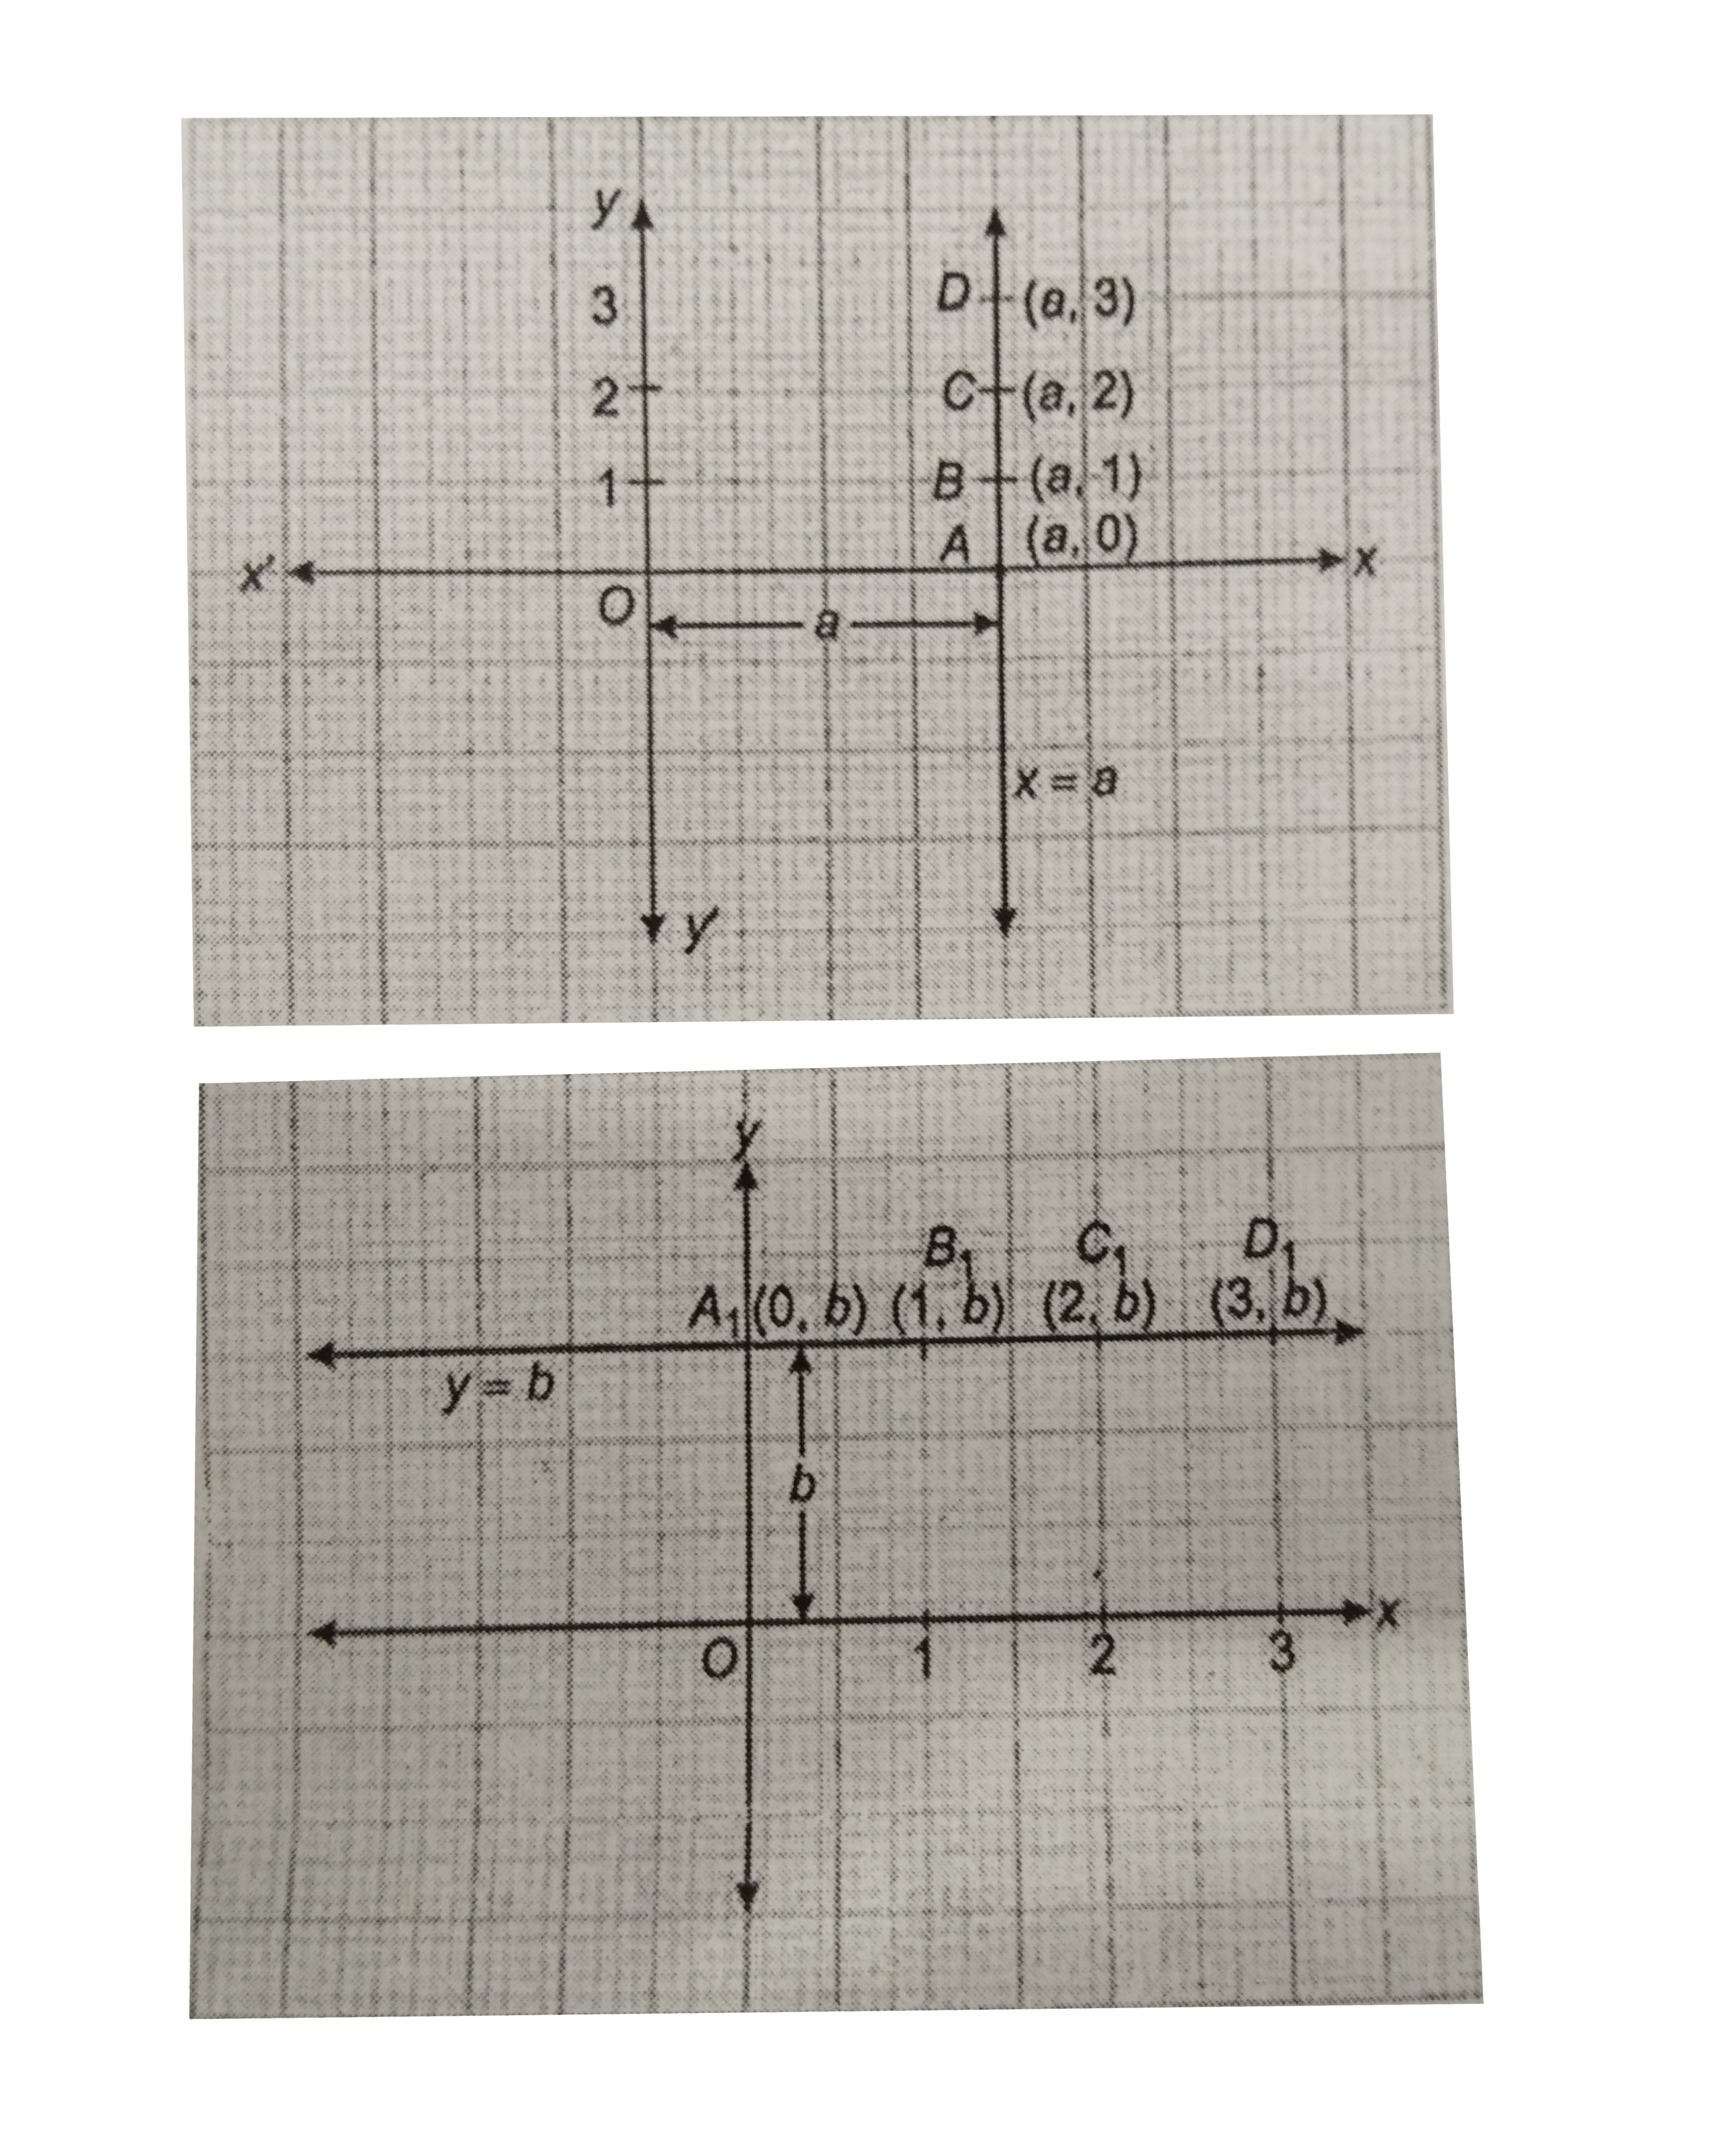
Draw the graphs of x =0, y =0,x=a,y=b
Video Solution
Text Solution
The correct Answer is:54 sq units
(i) Given equation is x = 0 i.e 1.x+0.y=0
x=0-0.y
Let y=0 x=0
Let y=1 rArr x=0
Let y =2 x=0
Let y =-1 x=0
Table for values :

Plot the points O (0,0) , A(0,1), B(0,2),C(0,-1) on the same graph paper and join them.
So , always remember that x =0 is the equation of y axis (as all these points lie on y axis)

(ii) Simi,lary we can plot the points for y = 0 i.e 0x+1y=1, and plot these points on the graph paper we find that y =0 is the equation of x - axis.
(iii) for x =a i.e x+0.y=a x=a-0.y
Let y =0, x=a
Let y =1, x=a
Let y =2, x=a
Let y=3,x=a
Tables for values:

Plot the points A(a,0),B(a,1),C(a,2),D(a,3) on the same graph paper and join them. so , always remember that x = a is the equation of straight line parallel to ya axis at a distance of 'a' units form the origin (as all points on its satisfy is equation)
(iv) Similary we can plot the points for y = b i.e 0, x+1 .y =b and plot these points on the graph paper we find that y = b is the equation of a straight line parallel to x axis at a distance of 'b' units from the origin . some points on this line are

|
Updated on:21/07/2023
Topper's Solved these Questions
- BOOK - NAGEEN PRAKASHANCHAPTER - LINEAR EQUATIONS IN TWO VARIABLESEXERCISE - Problems From NCERT/exemplar7videos
LINEAR EQUATIONS IN TWO VARIABLES
- BOOK - NAGEEN PRAKASHANCHAPTER - LINEAR EQUATIONS IN TWO VARIABLESEXERCISE - Exercise3videos
LINEAR EQUATIONS IN TWO VARIABLES
- BOOK - NAGEEN PRAKASHANCHAPTER - INTRODUCTION TO EUCLID'S GEOMETRYEXERCISE - Exercise3videos
INTRODUCTION TO EUCLID'S GEOMETRY
- BOOK - NAGEEN PRAKASHANCHAPTER - LINES AND ANGLESEXERCISE - Revision Exercise (long Answer Questions )6videos
LINES AND ANGLES
Similar Questions
Draw the graph of x+y=7
View SolutionDraw the graph of y=|x|
View SolutionDraw the graph of y=−x
View SolutionDraw the graph of y=2x.
View SolutionDraw the graph : x+y=4
View SolutionDraw the graph of x−2y≥4
View SolutionDraw the graph of y≤x+2.
View SolutionDraw the graph of y=|x|+2
View SolutionDraw graph of x<−y
View SolutionDraw the graph of y=x−sinx
View Solution

