Draw the rough sketches of altitudes from A to ¯¯¯¯¯¯BC for the following triangles (Fig 6.6)
 Solution in Punjabi
Step by step video & image solution for Draw the rough sketches of altitudes from A to bar(BC) for the following triangles (Fig 6.6) by Maths experts to help you in doubts & scoring excellent marks in Class 7 exams.
Topper's Solved these Questions
- BOOK - NAND LAL PUBLICATIONCHAPTER - THE TRIANGLE AND ITS PROPERTIESEXERCISE - Do This1videos
THE TRIANGLE AND ITS PROPERTIES
- BOOK - NAND LAL PUBLICATIONCHAPTER - THE TRIANGLE AND ITS PROPERTIESEXERCISE - Exercise 15videos
THE TRIANGLE AND ITS PROPERTIES
- BOOK - NAND LAL PUBLICATIONCHAPTER - THE TRIANGLE AND ITS PROPERTIESEXERCISE - Sample Paper for Practice9videos
THE TRIANGLE AND ITS PROPERTIES
- BOOK - NAND LAL PUBLICATIONCHAPTER - SYMMETRY EXERCISE - SAMPLE PAPER FOR PRACTICE (Answer the following :)9videos
SYMMETRY
Similar Questions
Take several cut outs of (i) an equilateral triangle, (ii) an isosceles triangle and (iii) a scalene triangle.
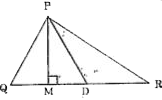
Find their altitudes and medians. Do you find any thing special about them? Discuss it with your friends.01:37View SolutionIn ΔPQR, D is the mid point of ¯¯¯¯¯¯QR
¯¯¯¯¯¯¯PM is …….
¯¯¯¯¯¯PD is …..
Is QM= MR?
 06:07View Solution
Answer the following
If PQ= PR in ΔPQR. Write the pair of equal angles02:11View SolutionWhat is the other name for lines of symmetry for
(i) Isosceles triangle
(ii) Circle01:31View SolutionHow many lines of symmetry does the above figure have ?
01:28View SolutionWhich of the following are correct chain isomers of butane ? (i)
02:45View SolutionDetermine the point of symmetry of a regular hexagon.
02:17View SolutionDtermine the images of the following figure about the given line :
05:41View SolutionDraw the bisector of ∠AOB=58∘
ltimg src="https://d10lpgp6xz60nq.cloudfront.net/physics_images/PS_MATH_VII_C05_S01_009_Q01.png" width="80%"gt02:10View SolutionMatch the following Column A to Column B
 02:17View Solution
Match the following Column A to Column B
 02:10View Solution
Match the following Column A to Column B
 04:23View Solution
The inequation represented by the graph given below is :
01:13View SolutionThe inequation that best describes the graph given below is _________
02:41View SolutionThe inequation that best describes the following graph is _________
03:12View SolutionWhich inequations represent the shaded region in the given figure
03:10View Solution
